

Local delivery of interleukin 7 with an oncolytic adenovirus activates tumor-infiltrating lymphocytes and causes tumor regression
- PMID: 35845722
- PMCID: PMC9278414
- DOI: 10.1080/2162402X.2022.2096572
Local delivery of interleukin 7 with an oncolytic adenovirus activates tumor-infiltrating lymphocytes and causes tumor regression
Abstract
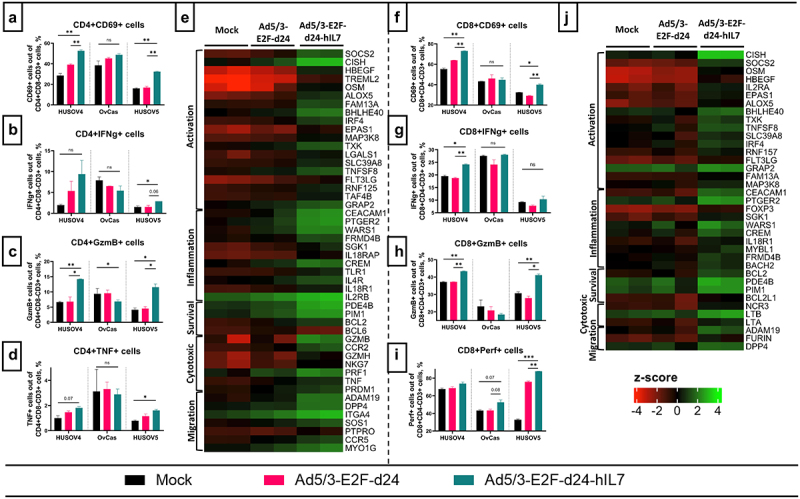
Cytokines have proven to be effective for cancer therapy, however whilst low-dose monotherapy with cytokines provides limited therapeutic benefit, high-dose treatment can lead to a number of adverse events. Interleukin 7 has shown promising results in clinical trials, but anti-cancer effect was limited, in part due to a low concentration of the cytokine within the tumor. We hypothesized that arming an oncolytic adenovirus with Interleukin 7, enabling high expression localized to the tumor microenvironment, would overcome systemic delivery issues and improve therapeutic efficacy. We evaluated the effects of Ad5/3-E2F-d24-hIL7 (TILT-517) on tumor growth, immune cell activation and cytokine profiles in the tumor microenvironment using three clinically relevant animal models and ex vivo tumor cultures. Our data showed that local treatment of tumor bearing animals with Ad5/3- E2F-d24-hIL7 significantly decreased cancer growth and increased frequency of tumor-infiltrating cells. Ad5/3-E2F-d24-hIL7 promoted notable upregulation of pro-inflammatory cytokines, and concomitant activation and migration of CD4+ and CD8 + T cells. Interleukin 7 expression within the tumor was positively correlated with increased number of cytotoxic CD4+ cells and IFNg-producing CD4+ and CD8+ cells. These findings offer an approach to overcome the current limitations of conventional IL7 therapy and could therefore be translated to the clinic.
Keywords: Oncolytic virus; adenovirus; immunotherapy; interleukin 7.
© 2022 The Author(s). Published with license by Taylor & Francis Group, LLC.
Conflict of interest statement
No potential conflict of interest was reported by the author(s).
Figures


Similar articles
-
Oncolytic adenovirus shapes the ovarian tumor microenvironment for potent tumor-infiltrating lymphocyte tumor reactivity.J Immunother Cancer. 2020 Jan;8(1):e000188. doi: 10.1136/jitc-2019-000188. J Immunother Cancer. 2020. PMID: 31940588 Free PMC article.
-
Interleukin-7-loaded oncolytic adenovirus improves CAR-T cell therapy for glioblastoma.Cancer Immunol Immunother. 2021 Sep;70(9):2453-2465. doi: 10.1007/s00262-021-02856-0. Epub 2021 Feb 4. Cancer Immunol Immunother. 2021. PMID: 33543339 Free PMC article.
-
Oncolytic Adenovirus Coding for a Variant Interleukin 2 (vIL-2) Cytokine Re-Programs the Tumor Microenvironment and Confers Enhanced Tumor Control.Front Immunol. 2021 May 18;12:674400. doi: 10.3389/fimmu.2021.674400. eCollection 2021. Front Immunol. 2021. PMID: 34084172 Free PMC article.
-
Multidirectional Strategies for Targeted Delivery of Oncolytic Viruses by Tumor Infiltrating Immune Cells.Pharmacol Res. 2020 Nov;161:105094. doi: 10.1016/j.phrs.2020.105094. Epub 2020 Aug 12. Pharmacol Res. 2020. PMID: 32795509 Review.
-
Oncolytic Adenovirus: Strategies and Insights for Vector Design and Immuno-Oncolytic Applications.Viruses. 2015 Nov 24;7(11):6009-42. doi: 10.3390/v7112923. Viruses. 2015. PMID: 26610547 Free PMC article. Review.
Cited by
-
Boosting cytotoxicity of adoptive allogeneic NK cell therapy with an oncolytic adenovirus encoding a human vIL-2 cytokine for the treatment of human ovarian cancer.Cancer Gene Ther. 2023 Dec;30(12):1679-1690. doi: 10.1038/s41417-023-00674-3. Epub 2023 Nov 10. Cancer Gene Ther. 2023. PMID: 37949944 Free PMC article.
-
Cancer Immunotherapy and Delivery System: An Update.Pharmaceutics. 2022 Aug 4;14(8):1630. doi: 10.3390/pharmaceutics14081630. Pharmaceutics. 2022. PMID: 36015256 Free PMC article. Review.
-
Strategies for engineering oncolytic viruses to enhance cancer immunotherapy.Front Pharmacol. 2024 Sep 6;15:1450203. doi: 10.3389/fphar.2024.1450203. eCollection 2024. Front Pharmacol. 2024. PMID: 39309012 Free PMC article. Review.
-
An oncolytic adenovirus coding for a variant interleukin 2 cytokine improves response to chemotherapy through enhancement of effector lymphocyte cytotoxicity, fibroblast compartment modulation and mitotic slippage.Front Immunol. 2023 Jul 5;14:1171083. doi: 10.3389/fimmu.2023.1171083. eCollection 2023. Front Immunol. 2023. PMID: 37475863 Free PMC article.
-
Tumor cells ectopically expressing the membrane-bound form of IL-7 develop an antitumor immune response efficiently in a colon carcinoma model.Mol Cells. 2025 Feb;48(2):100175. doi: 10.1016/j.mocell.2024.100175. Epub 2024 Dec 30. Mol Cells. 2025. PMID: 39743142 Free PMC article.
References
-
- Golomb HM, Ratain MJ, Mick R, Daly K. Interferon treatment for hairy cell leukemia: an update on a cohort of 69 patients treated from 1983-1986. Leukemia. 1992. Nov;6(11):1177–1180. - PubMed
-
- Kammula US, White DE, Rosenberg SA. Trends in the safety of high dose bolus interleukin-2 administration in patients with metastatic cancer. Cancer. 1998. Aug; 83(4):797–805. PMID: 9708948. - PubMed
Publication types
MeSH terms
Substances
LinkOut - more resources
Full Text Sources
Research Materials