

CDK4/6 blockade provides an alternative approach for treatment of mismatch-repair deficient tumors
- PMID: 35845723
- PMCID: PMC9278458
- DOI: 10.1080/2162402X.2022.2094583
CDK4/6 blockade provides an alternative approach for treatment of mismatch-repair deficient tumors
Abstract
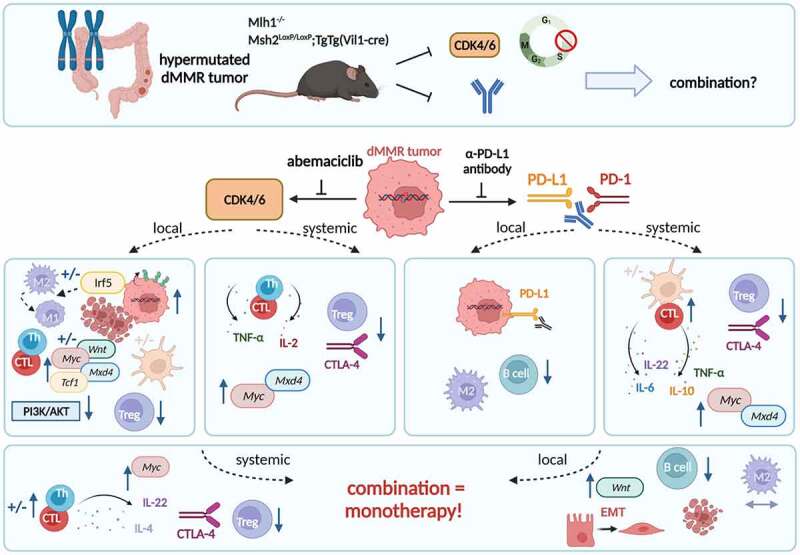
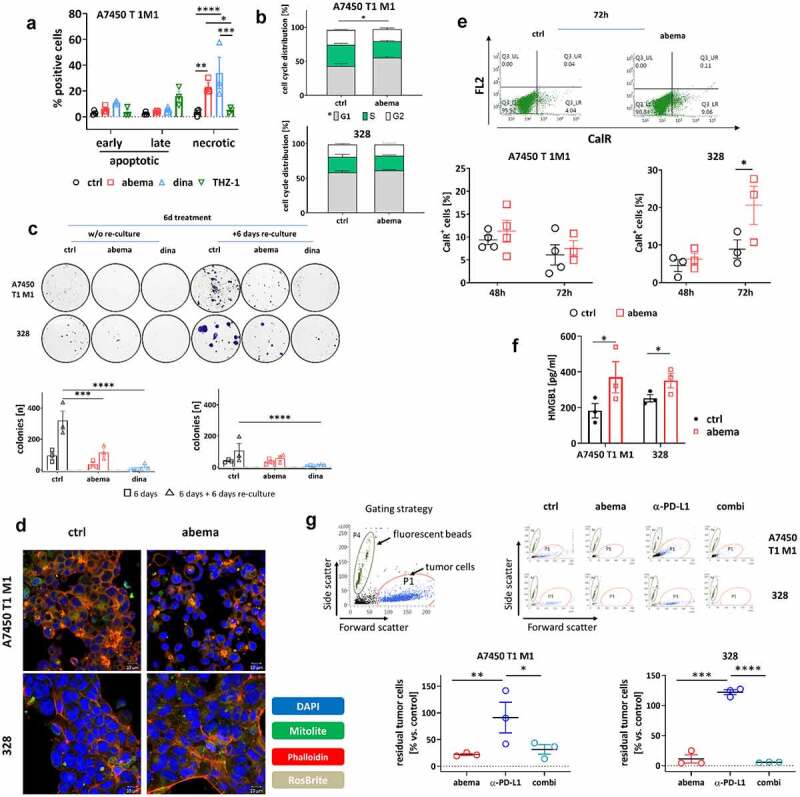
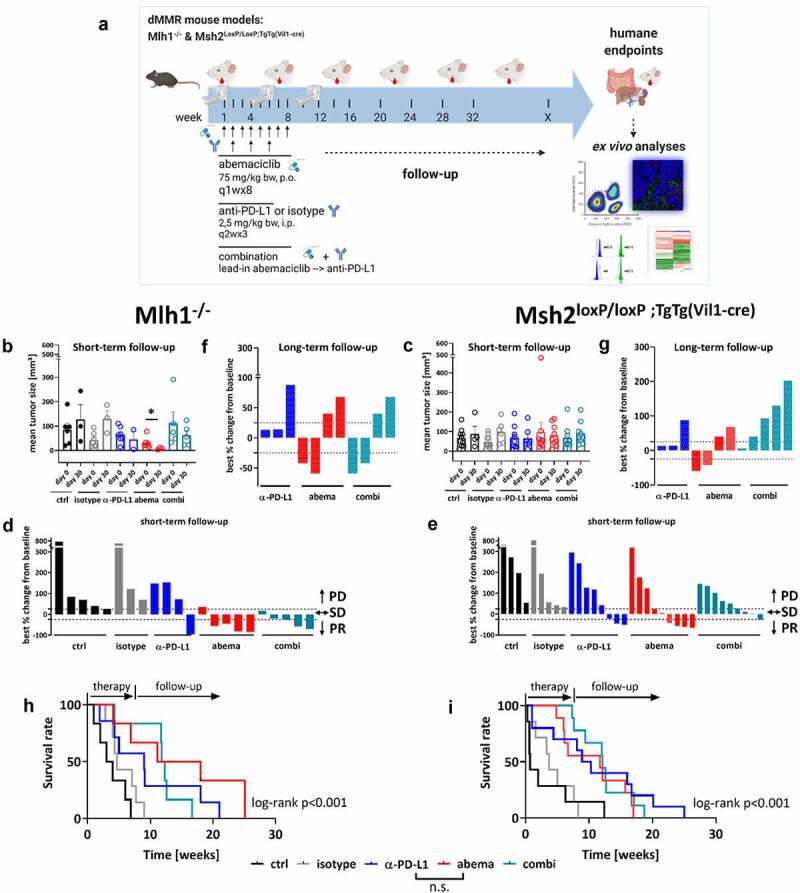
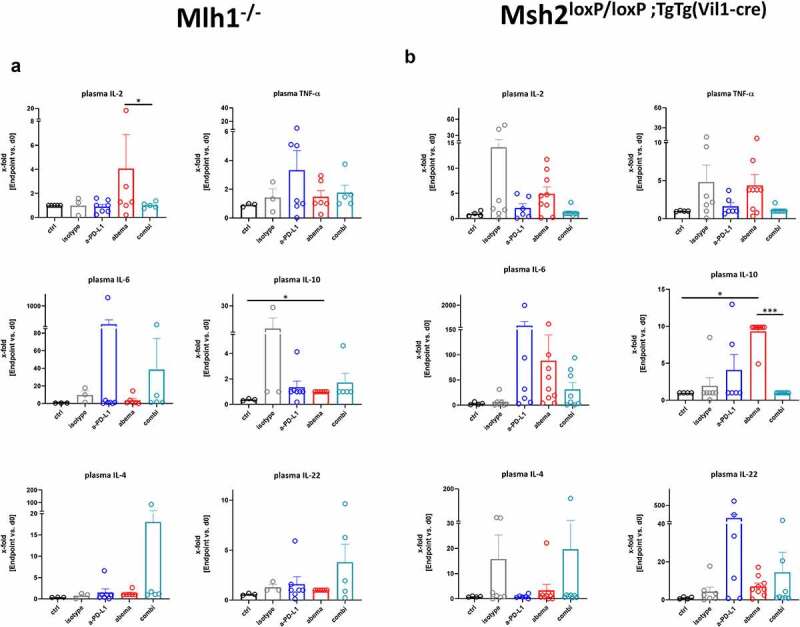
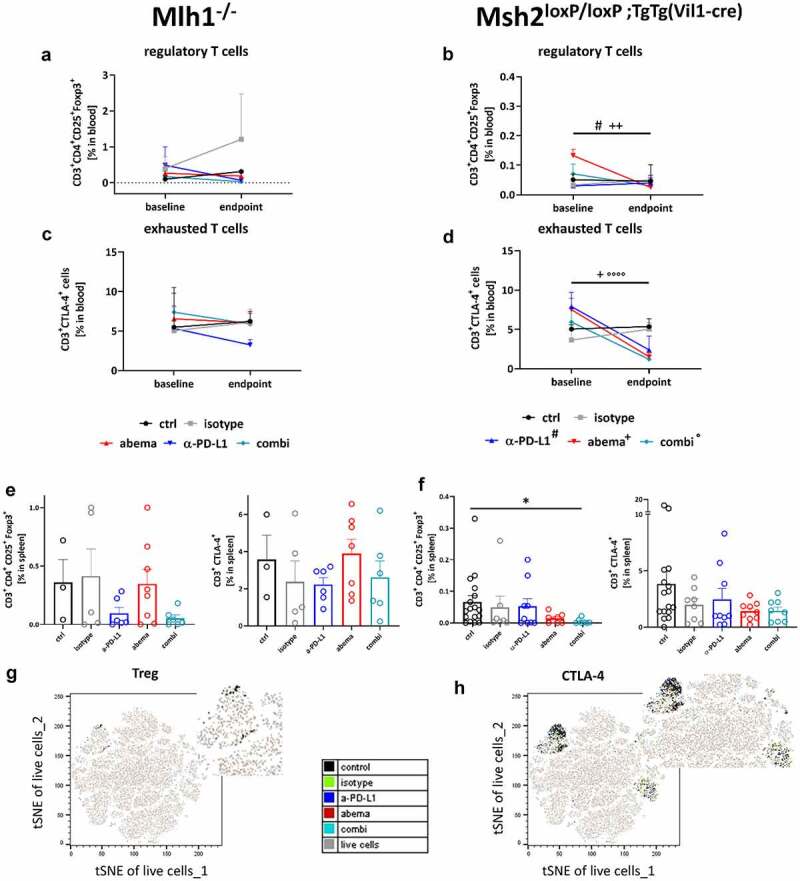
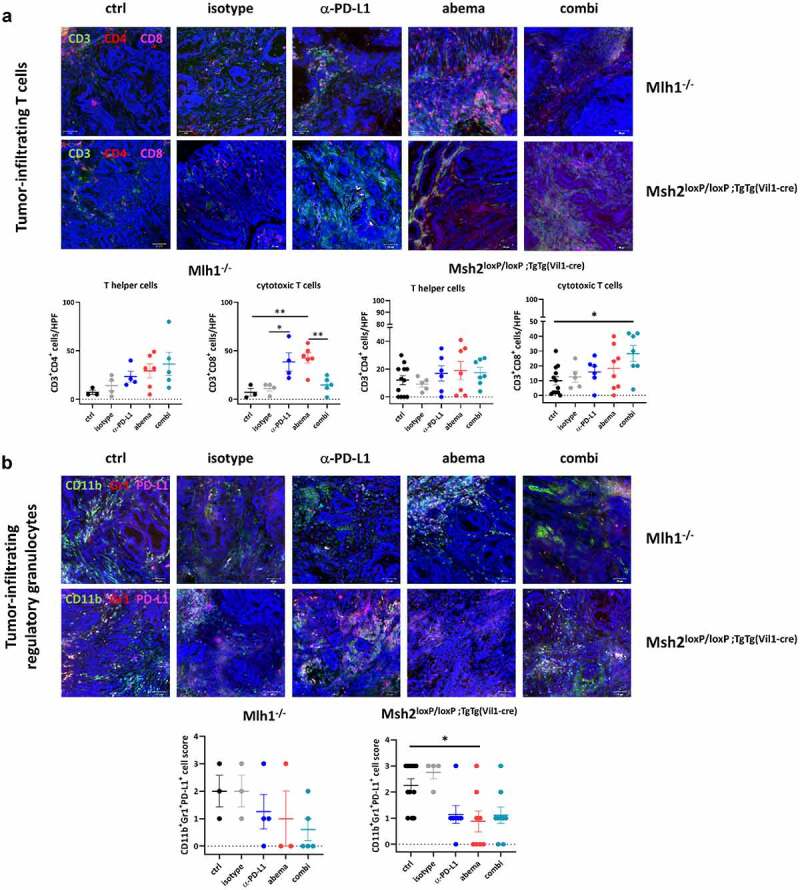
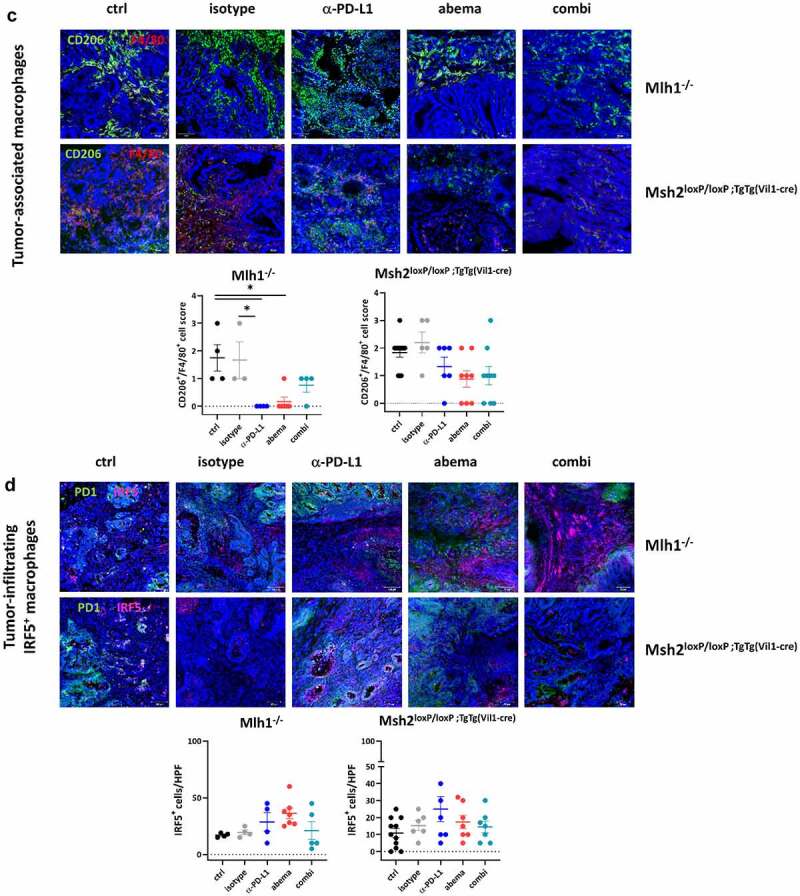
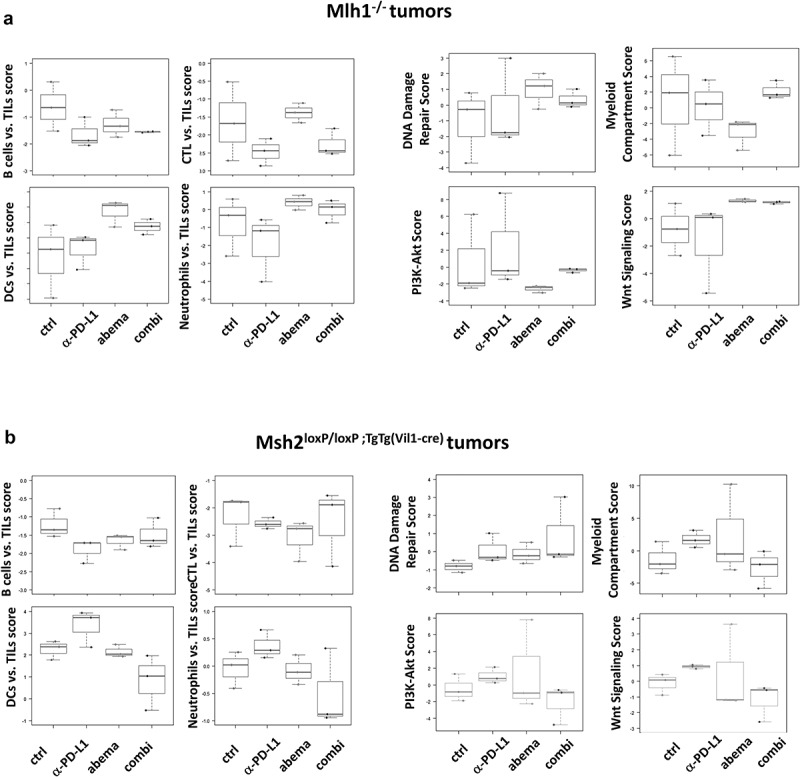
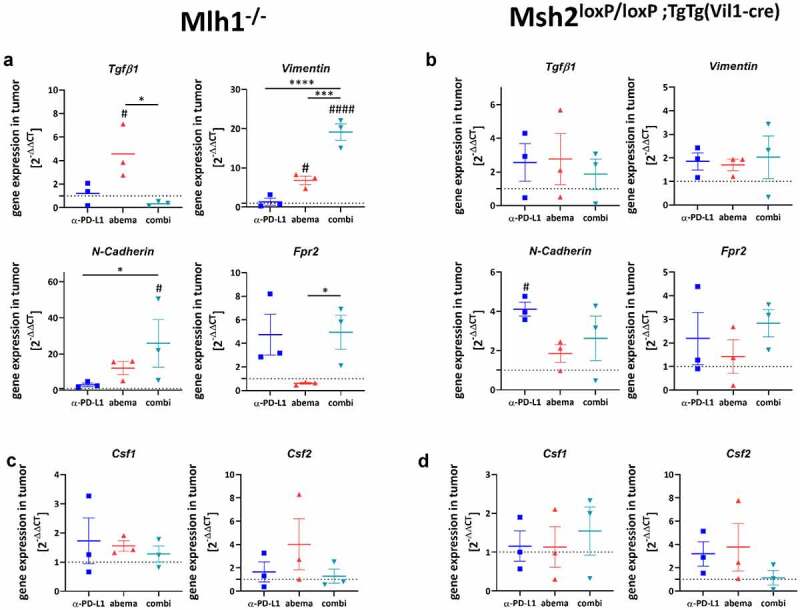
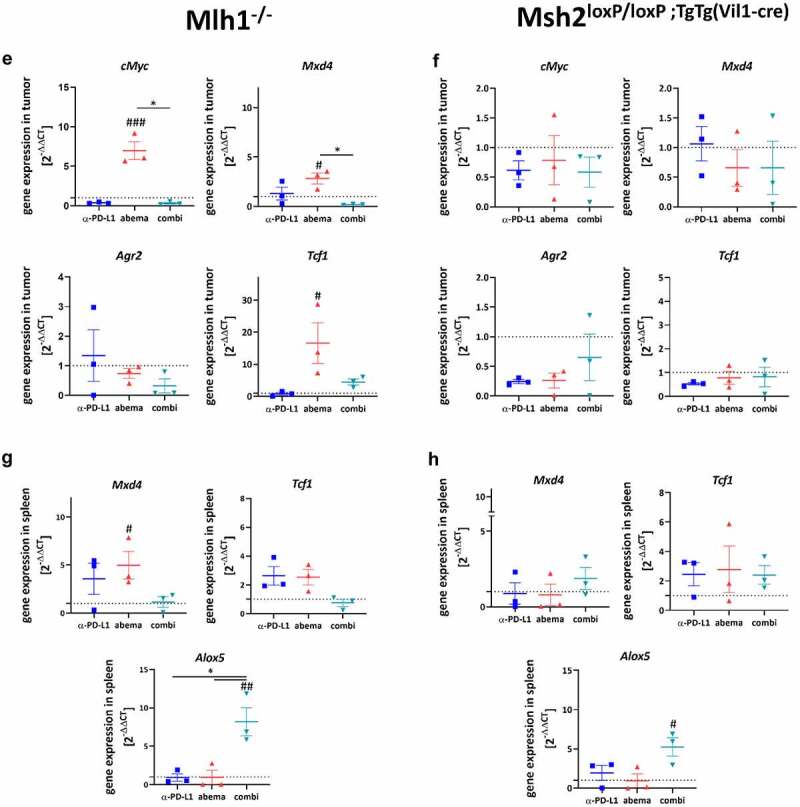
Mismatch repair-deficient (dMMR) tumors show a good response toward immune checkpoint inhibitors (ICI), but developing resistance impairs patients' outcomes. Here, we compared the therapeutic potential of an α-PD-L1 antibody with the CDK4/6 inhibitor abemaciclib in two preclinical mouse models of dMMR cancer, focusing on immune-modulatory effects of either treatment. Abemaciclib monotherapy significantly prolonged overall survival of Mlh1-/- and Msh2loxP/loxP;TgTg(Vil1- cre) mice (Mlh1-/-: 14.5 wks vs. 9.0 wks (α-PD-L1), and 3.5 wks (control); Msh2loxP/loxP;TgTg(Vil1- cre): 11.7 wks vs. 9.6 wks (α-PD-L1), and 2.0 wks (control)). The combination was not superior to either monotherapy. PET/CT imaging revealed individual response profiles, with best clinical responses seen with abemaciclib mono- and combination therapy. Therapeutic effects were accompanied by increasing numbers of tumor-infiltrating CD4+/CD8+ T-cells and lower numbers of M2-macrophages. Levels of T cell exhaustion markers and regulatory T cell counts declined. Expression analysis identified higher numbers of dendritic cells and neutrophils within tumors together with high expression of DNA damage repair genes as part of the global stress response. In Mlh1-/- tumors, abemaciclib suppressed the PI3K/Akt pathway and led to induction of Mxd4/Myc. The immune-modulatory potential of abemaciclib renders this compound ideal for dMMR patients not eligible for ICI treatment.
© 2022 The Author(s). Published with license by Taylor & Francis Group, LLC.
Conflict of interest statement
No potential conflict of interest was reported by the authors.
Figures
Similar articles
-
Prophylaxis with abemaciclib delays tumorigenesis in dMMR mice by altering immune responses and reducing immunosuppressive extracellular vesicle secretion.Transl Oncol. 2024 Sep;47:102053. doi: 10.1016/j.tranon.2024.102053. Epub 2024 Jul 9. Transl Oncol. 2024. PMID: 38986222 Free PMC article.
-
Combined vaccine-immune-checkpoint inhibition constitutes a promising strategy for treatment of dMMR tumors.Cancer Immunol Immunother. 2021 Dec;70(12):3405-3419. doi: 10.1007/s00262-021-02933-4. Epub 2021 Apr 18. Cancer Immunol Immunother. 2021. PMID: 33870463 Free PMC article.
-
Immune-checkpoint inhibition for tumor prevention in a preclinical Lynch syndrome model.Transl Oncol. 2025 Oct;60:102472. doi: 10.1016/j.tranon.2025.102472. Epub 2025 Jul 16. Transl Oncol. 2025. PMID: 40674934 Free PMC article.
-
A Systematic Review of the Tumor-Infiltrating CD8+ T-Cells/PD-L1 Axis in High-Grade Glial Tumors: Toward Personalized Immuno-Oncology.Front Immunol. 2021 Sep 17;12:734956. doi: 10.3389/fimmu.2021.734956. eCollection 2021. Front Immunol. 2021. PMID: 34603316 Free PMC article.
-
Clinical benefits of PD-1/PD-L1 inhibitors in patients with metastatic colorectal cancer: a systematic review and meta-analysis.World J Surg Oncol. 2022 Mar 24;20(1):93. doi: 10.1186/s12957-022-02549-7. World J Surg Oncol. 2022. PMID: 35331250 Free PMC article.
Cited by
-
Development of CDK4/6 Inhibitors in Gastrointestinal Cancers: Biomarkers to Move Forward.Curr Issues Mol Biol. 2025 Jun 12;47(6):454. doi: 10.3390/cimb47060454. Curr Issues Mol Biol. 2025. PMID: 40699853 Free PMC article. Review.
-
Pharmacological modulation of RB1 activity mitigates resistance to neoadjuvant chemotherapy in locally advanced rectal cancer.Proc Natl Acad Sci U S A. 2024 Feb 6;121(6):e2304619121. doi: 10.1073/pnas.2304619121. Epub 2024 Jan 30. Proc Natl Acad Sci U S A. 2024. PMID: 38289962 Free PMC article.
-
Short-term immune-checkpoint inhibition partially rescues perturbed bone marrow hematopoiesis in mismatch-repair deficient tumors.Oncoimmunology. 2023 Jun 28;12(1):2230669. doi: 10.1080/2162402X.2023.2230669. eCollection 2023. Oncoimmunology. 2023. PMID: 37396958 Free PMC article.
-
Identification and immunological characterization of cuproptosis-related molecular clusters in ulcerative colitis.BMC Gastroenterol. 2023 Jun 27;23(1):221. doi: 10.1186/s12876-023-02831-2. BMC Gastroenterol. 2023. PMID: 37370003 Free PMC article.
-
A single-arm phase 2 study of abemaciclib in adult patients with recurrent grade 3 oligodendroglioma.Neurooncol Adv. 2025 Jan 17;7(1):vdaf011. doi: 10.1093/noajnl/vdaf011. eCollection 2025 Jan-Dec. Neurooncol Adv. 2025. PMID: 39944054 Free PMC article.
References
-
- Liu J, Zhang S, Hu Y, Yang Z, Li J, Liu X, Deng L, Wang Y, Zhang X, Jiang T, et al. Targeting PD-1 and Tim-3 pathways to reverse CD8 T-cell exhaustion and enhance ex vivo T-cell responses to autologous dendritic/tumor vaccines. J ImmunoTher. 2016;39(4):171–20. doi:10.1097/CJI.0000000000000122. - DOI - PubMed
-
- Tan E, Sahin IH.. Defining the current role of immune checkpoint inhibitors in the treatment of mismatch repair-deficient/microsatellite stability-high colorectal cancer and shedding light on future approaches. Expert Rev Gastroenterol Hepatol. 2021. Feb 4;15(7):735–742. doi:10.1080/17474124.2021.1886077. - DOI - PubMed
-
- Sousa Linhares A D, Battin C, Jutz S, Leitner J, Hafner C, Tobias J, Wiedermann U, Kundi M, Zlabinger GJ, Grabmeier-Pfistershammer K, et al. Therapeutic PD-L1 antibodies are more effective than PD-1 antibodies in blocking PD-1/PD-L1 signaling. Sci Reports. 2019;9(1):1–9. doi:10.1038/s41598-019-47910-1. - DOI - PMC - PubMed
-
- Kim JH, Kim SY, Baek JY, Cha YJ, Ahn JB, Kim HS, Lee K-W, Kim J-W, Kim T-Y, Chang WJ, et al. A phase II study of avelumab monotherapy in patients with mismatch repair-deficient/microsatellite instability-high or POLE-Mutated metastatic or unresectable colorectal cancer. Cancer Res Treat. 2020. Apr 24. doi:10.4143/crt.2020.218. - DOI - PMC - PubMed
Publication types
MeSH terms
Substances
LinkOut - more resources
Full Text Sources
Medical
Research Materials