. 2022 Jun 30:9:916271.
doi: 10.3389/fnut.2022.916271. eCollection 2022.

Hypoglycemic Effects of Lycium barbarum Polysaccharide in Type 2 Diabetes Mellitus Mice via Modulating Gut Microbiota

Affiliations

Hypoglycemic Effects of Lycium barbarum Polysaccharide in Type 2 Diabetes Mellitus Mice via Modulating Gut Microbiota

Qingyu Ma et al. Front Nutr. .

Abstract

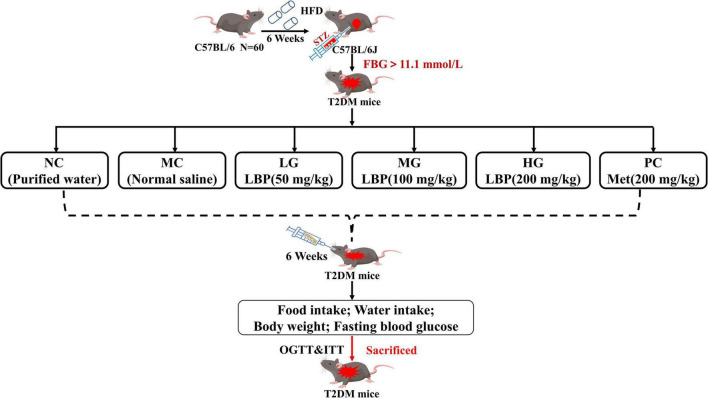
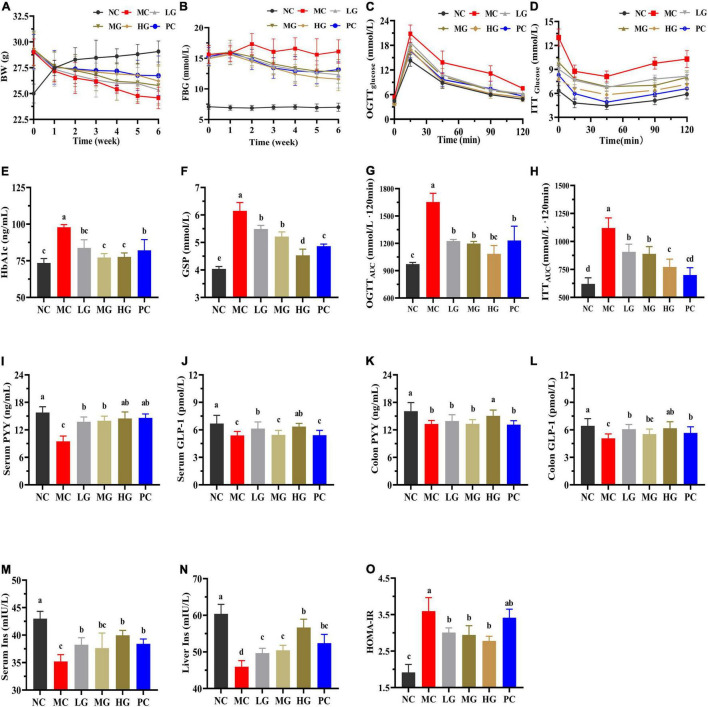
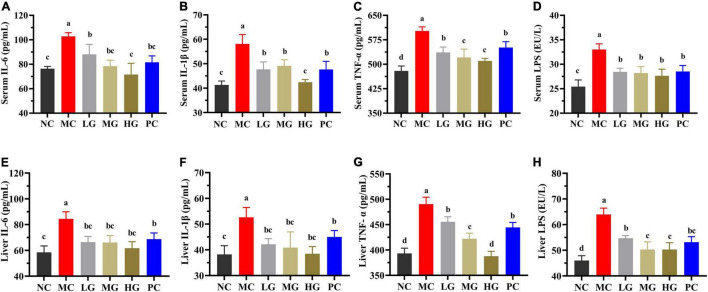
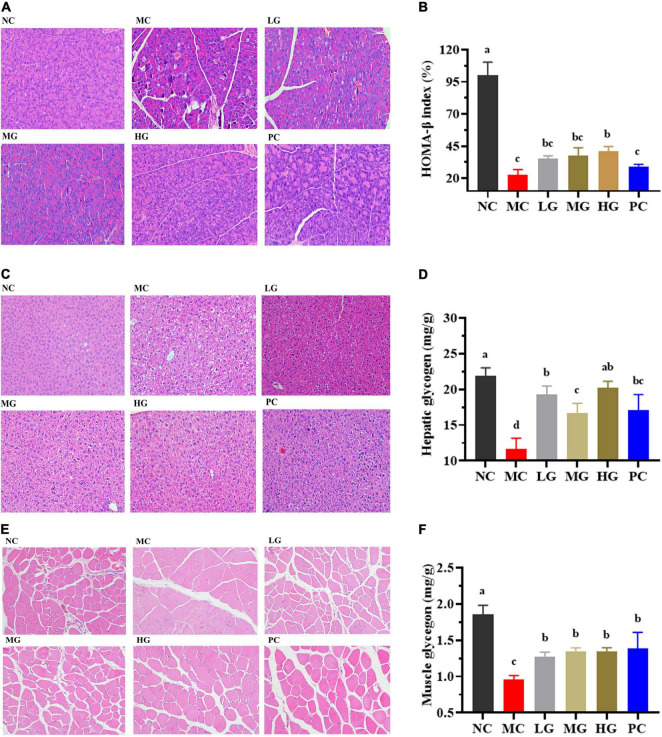
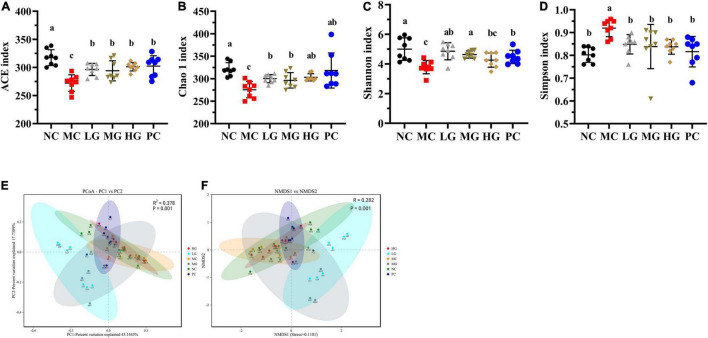
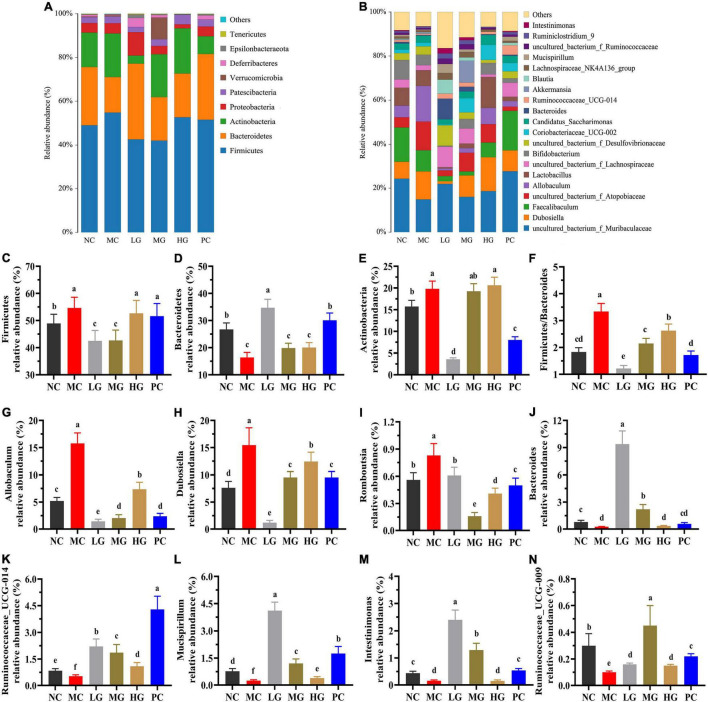
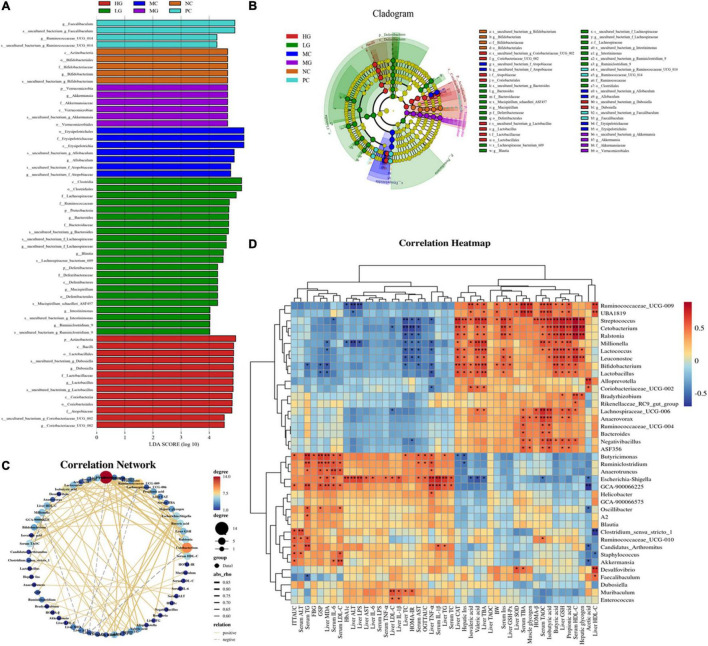
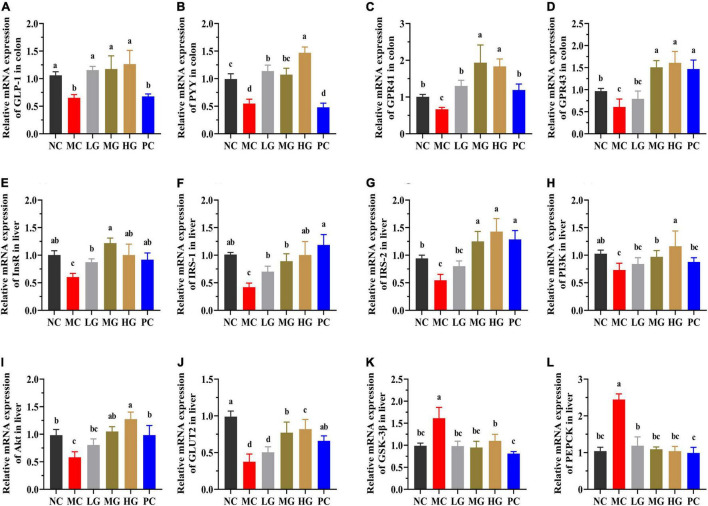
This study aims to explore the molecular mechanisms of Lycium barbarum polysaccharide (LBP) in alleviating type 2 diabetes through intestinal flora modulation. A high-fat diet (HFD) combined with streptozotocin (STZ) was applied to create a diabetic model. The results indicated that LBP effectively alleviated the symptoms of hyperglycemia, hyperlipidemia, and insulin resistance in diabetic mice. A high dosage of LBP exerted better hypoglycemic effects than low and medium dosages. In diabetic mice, LBP significantly boosted the activities of CAT, SOD, and GSH-Px and reduced inflammation. The analysis of 16S rDNA disclosed that LBP notably improved the composition of intestinal flora, increasing the relative abundance of Bacteroides, Ruminococcaceae_UCG-014, Intestinimonas, Mucispirillum, Ruminococcaceae_UCG-009 and decreasing the relative abundance of Allobaculum, Dubosiella, Romboutsia. LBP significantly improved the production of short-chain fatty acids (SCFAs) in diabetic mice, which corresponded to the increase in the beneficial genus. According to Spearman's correlation analysis, Cetobacterium, Streptococcus, Ralstonia. Cetobacterium, Ruminiclostridium, and Bifidobacterium correlated positively with insulin, whereas Cetobacterium, Millionella, Clostridium_sensu_stricto_1, Streptococcus, and Ruminococcaceae_UCG_009 correlated negatively with HOMA-IR, HDL-C, ALT, AST, TC, and lipopolysaccharide (LPS). These findings suggested that the mentioned genus may be beneficial to diabetic mice's hypoglycemia and hypolipidemia. The up-regulation of peptide YY (PYY), glucagon-like peptide-1 (GLP-1), and insulin were remarkably reversed by LBP in diabetic mice. The real-time PCR (RT-PCR) analysis illustrated that LBP distinctly regulated the glucose metabolism of diabetic mice by activating the IRS/PI3K/Akt signal pathway. These results indicated that LBP effectively alleviated the hyperglycemia and hyperlipidemia of diabetic mice by modulating intestinal flora.

Keywords: Lycium barbarum polysaccharide; gut microbiota; hypoglycemia; hypolipidemia; type 2 diabetes mellieus.


Conflict of interest statement

The authors declare that the research was conducted in the absence of any commercial or financial relationships that could be construed as a potential conflict of interest.

Figures

FIGURE 1
FIGURE 1
Animal experimental protocol and design. All the mice were divided into a normal group (administrated with normal saline) and diabetic groups (injected with multiple low dosages of STZ at the beginning of the seventh week, 40 mg/kg/day × 3). The diabetic mice were divided randomly into five groups: model control group (MC), low dosage group (LG), medium dosage group (MG), high dosage group (HG), and positive control group (PC).
FIGURE 2
FIGURE 2
Chemical information of LBP. GC chromatogram of the monosaccharide standards (A), and LBP (B). The peaks in monosaccharide standards and LBP represent (1) rhamnose, (2) fructose, (3) arabinose, (4) xylose, (5) mannose, (6) glucose, (7) galactose, (8) glucuronic acid, (9) galacturonic acid; the (C) UV spectra of LBP, (D) FTIR spectra of LBP.
FIGURE 3
FIGURE 3
Effects of LBP on biochemical parameters. (A) BW; (B) FBG; (C) OGTT; (D) ITT; (E) HbA1c; (F) GSP; (G) OGTTAUC; (H) ITTAUC; (I) serum PYY; (J) serum GLP-1; (K) colon PYY; (L) colon GLP-1; (M) serum INS; (N) liver INS; and (O) HOMA-IR. Different letters denote significant differences at p < 0.05.
FIGURE 4
FIGURE 4
Effects of LBP on (A) serum IL-6; (B) serum IL-1β; (C) serum TNF-α; (D) serum LPS; (E) liver IL-6; (F) liver IL-1β; (G) liver TNF-α; and (H) liver LPS. Different letters denote significant differences at p < 0.05.
FIGURE 5
FIGURE 5
Effects of LBP on pancreas, liver, skeletal muscle, hepatic glycogen, and muscle glycogen. (A) H&E staining of pancreas; (B) HOMA-β; (C) H&E staining of liver; (D) hepatic glycogen; (E) H&E staining of muscle; and (F) muscle glycogen. Different letters denote significant differences at p < 0.05.
FIGURE 6
FIGURE 6
Effects of LBP on alpha diversity and beta diversity. (A) ACE index; (B) Chao 1 index; (C) Shannon index; (D) Simpson index; (E) PCoA; and (F) NMDS. Different letters denote significant differences at p < 0.05.
FIGURE 7
FIGURE 7
Effects of LBP on the relative abundance of gut microbiota at levels of phylum and genus. (A) Phylum (top 10); (B) genus (top 30); (C) Firmicutes; (D) Bacteroidetes; (E) Actinobacteria; (F) ratio of Firmicutes/Bacteroidetes; (G) Allobaculum; (H) Dubosiella; (I) Romboutsia; (J) Bacteroides; (K) Ruminococcaceae_UCG-014; (L) Mucispirillum; (M) Intestinimonas; and (N) Ruminococcaceae_UCG-009. Different letters denote significant differences at p < 0.05.
FIGURE 8
FIGURE 8
Comparison of gut microbiota by LEfSe analysis and correlation analysis. (A) Histogram of LDA values (lg 10 > 4); (B) taxonomic cladogram obtained by LEfSe. Differences are represented by the color of the most abundant class. (C) Visual network diagram. (D) Spearman correlation analysis between intestinal flora and biochemical profiles. Different letters denote significant differences at p < 0.05.
FIGURE 9
FIGURE 9
The mRNA expressions were determined using the real-time PCR and normalized with the β-actin expression. (A) GLP-1; (B) PYY; (C) GPR41; (D) GPR43; (E) InsR; (F) IRS-1; (G) IRS-2; (H) PI3K; (I) Akt; (J) GLUT2; (K) GSK-3β; and (L) PEPCK. Different letters denote significant differences at p < 0.05.

Similar articles

Cited by

References

    1. DeFronzo RA, Ferrannini E, Groop L, Henry RR, Herman WH, Holst JJ, et al. Type 2 diabetes mellitus. Nat Rev Dis Primers. (2015) 1:1–22. 10.1038/nrdp.2015.19 - DOI - PubMed
    1. Sun H, Saeedi P, Karuranga S, Pinkepank M, Ogurtsova K, Duncan BB, et al. IDF diabetes atlas: global, regional and country-level diabetes prevalence estimates for 2021 and projections for 2045. Diabetes Res Clin Pract. (2022) 183:109119–31. 10.1016/j.diabres.2021.109119 - DOI - PMC - PubMed
    1. Panwar H, Rashmi HM, Batish VK, Grover S. Probiotics as potential biotherapeutics in the management of type 2 diabetes – prospects and perspectives. Diabetes Metab Res Rev. (2013) 29:103–12. 10.1002/dmrr.2376 - DOI - PubMed
    1. Zhang L, Zhou W, Zhan L, Hou S, Zhao C, Bi T, et al. Fecal microbiota transplantation alters the susceptibility of obese rats to type 2 diabetes mellitus. Aging. (2020) 12:17480–502. 10.18632/aging.103756 - DOI - PMC - PubMed
    1. Fiorentino TV, Prioletta A, Zuo P, Folli F. Hyperglycemia-induced oxidative stress and its role in diabetes mellitus related cardiovascular diseases. Curr Pharm Des. (2013) 19:5695–703. 10.2174/1381612811319320005 - DOI - PubMed