. 2022 Jun 30:9:889131.
doi: 10.3389/fnut.2022.889131. eCollection 2022.

Reno-Protective Effect of Low Protein Diet Supplemented With α-Ketoacid Through Gut Microbiota and Fecal Metabolism in 5/6 Nephrectomized Mice

Affiliations

Reno-Protective Effect of Low Protein Diet Supplemented With α-Ketoacid Through Gut Microbiota and Fecal Metabolism in 5/6 Nephrectomized Mice

Yifan Zhu et al. Front Nutr. .

Abstract

Background: Low protein supplemented with α-ketoacid diet (LKD) was recommended to be an essential intervention to delay the progression of chronic kidney disease (CKD) in patients who were not yet on dialysis. Aberrant gut microbiota and metabolism have been reported to be highly associated with CKD. However, the effect of LKD on gut microbiota and related fecal metabolism in CKD remains unclear.

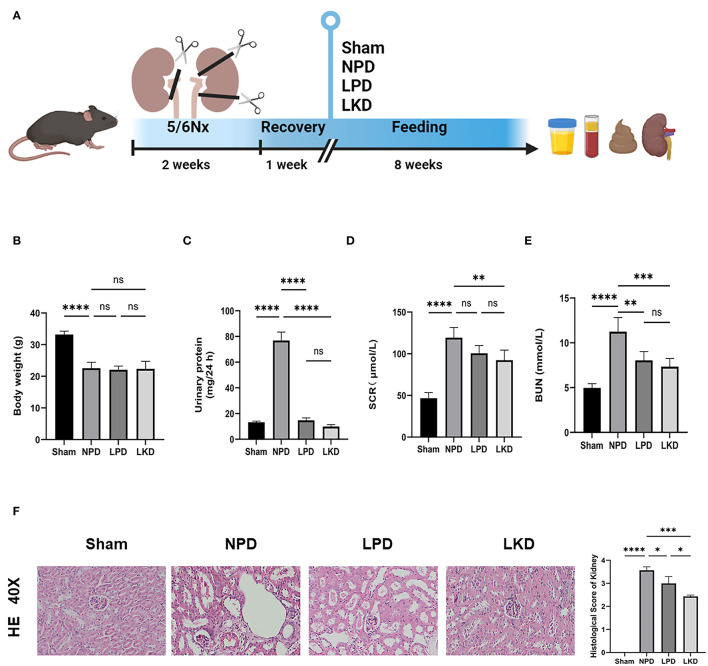
Methods: Mice were fed with normal protein diet (NPD group), low protein diet (LPD group), and low protein diet supplemented with α-ketoacid (LKD group) after 5/6 nephrectomy. At the end of the study, blood, kidney tissues, and feces were collected for biochemical analyses, histological, 16S rRNA sequence of gut microbiome, and untargeted fecal metabolomic analyses.

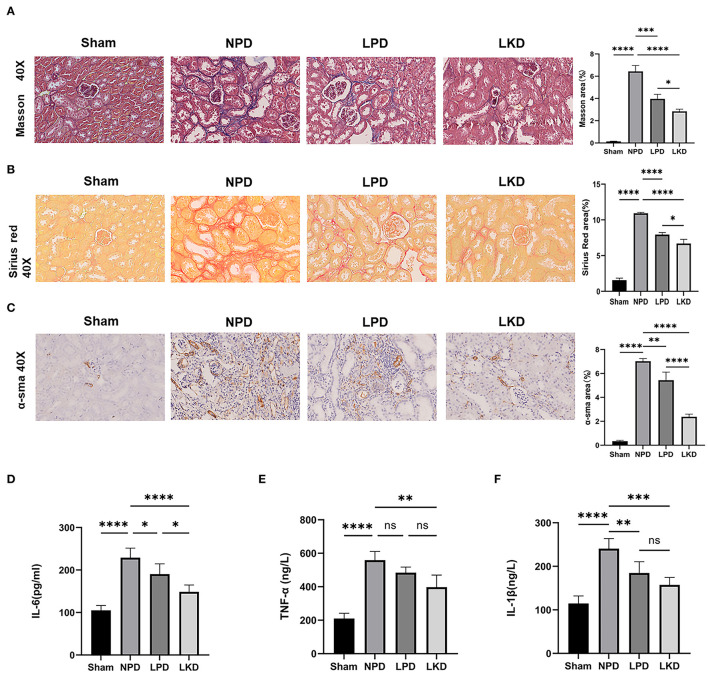
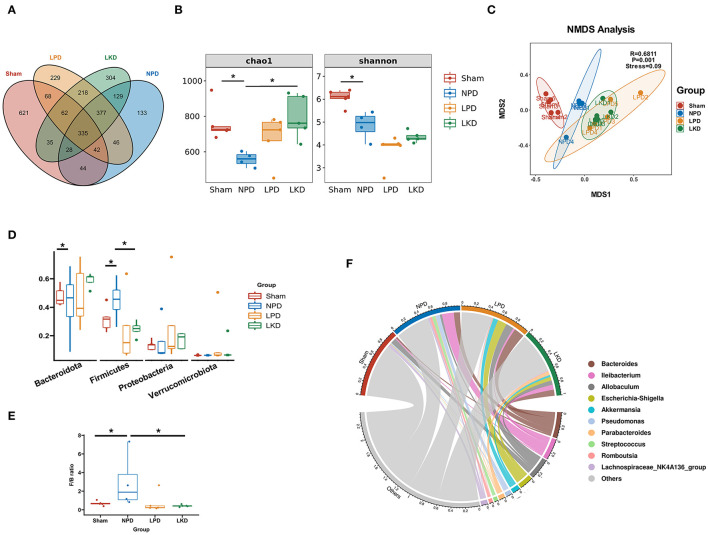
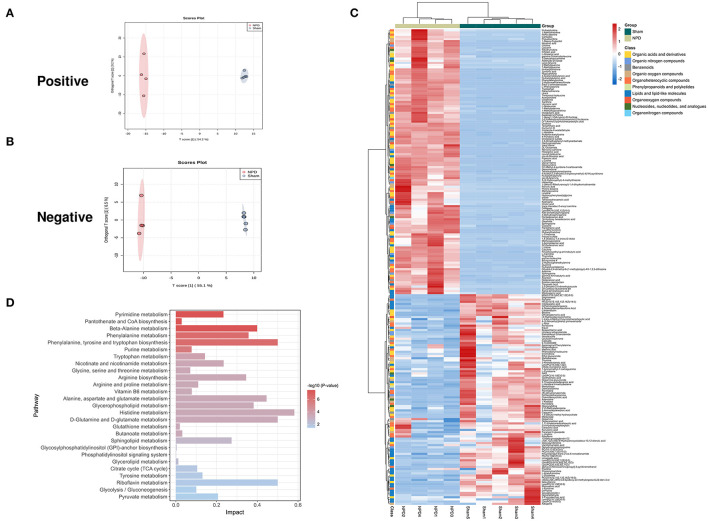
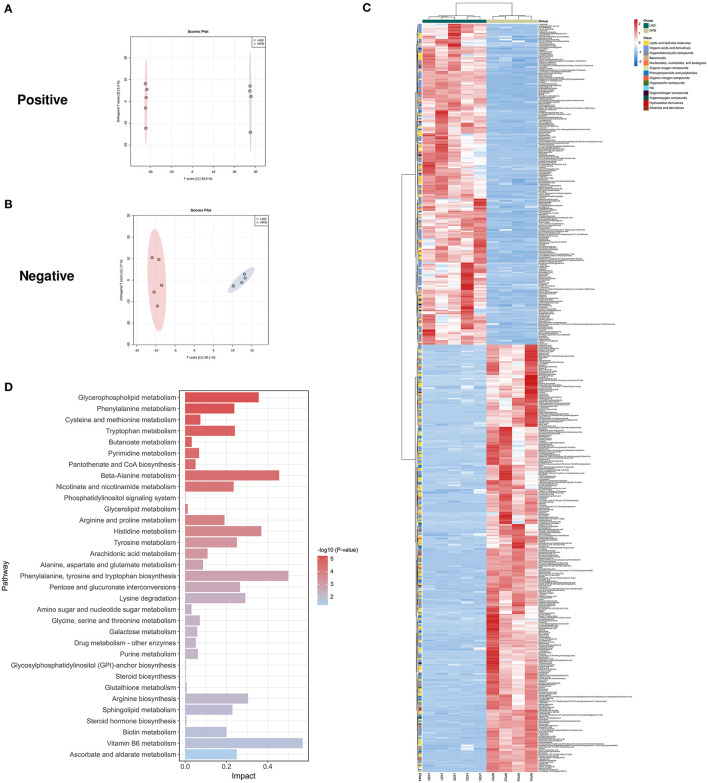
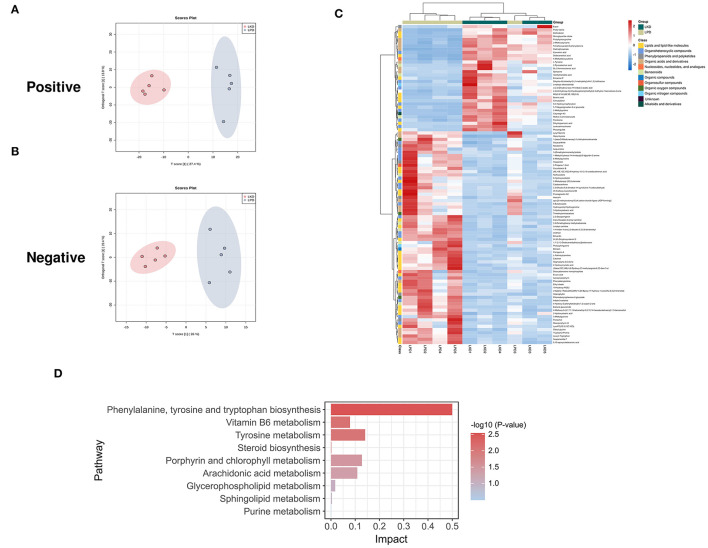
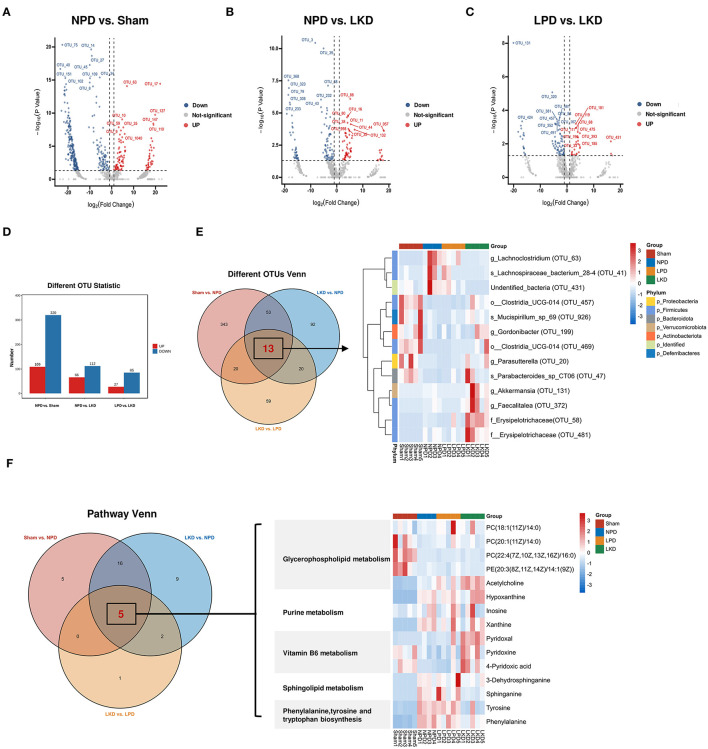
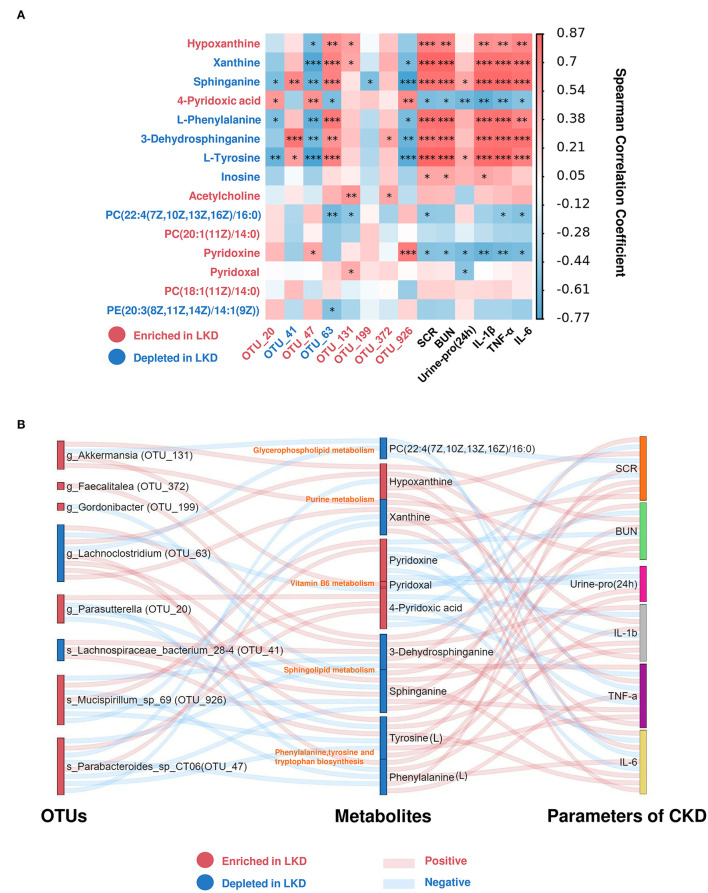
Results: Both LKD and LPD alleviate renal failure and fibrosis, and inflammatory statement in 5/6 nephrectomized mice, especially the LKD. In terms of gut microbiome, LKD significantly improved the dysbiosis induced by 5/6Nx, representing increased α-diversity and decreased F/B ratio. Compared with NPD, LKD significantly increased the abundance of g_Parasutterella, s_Parabacteroides_sp_CT06, f_Erysipelotrichaceae, g_Akkermansia, g_Gordonibacter, g_Faecalitalea, and s_Mucispirillum_sp_69, and decreased s_Lachnospiraceae_bacterium_28-4 and g_Lachnoclostridium. Moreover, 5/6Nx and LKD significantly altered fecal metabolome. Then, multi-omics analysis revealed that specific metabolites involved in glycerophospholipid, purine, vitamin B6, sphingolipid, phenylalanine, tyrosine and tryptophan biosynthesis, and microbes associated with LKD were correlated with the amelioration of CKD.

Conclusion: LKD had a better effect than LPD on delaying renal failure in 5/6 nephrectomy-induced CKD, which may be due to the regulation of affecting the gut microbiome and fecal metabolic profiles.

Keywords: 5/6Nx mice; chronic kidney disease; fecal metabolism; gut microbiota; low-protein diet supplemented with α-ketoacid; renal fibrosis.


Conflict of interest statement

The authors declare that the research was conducted in the absence of any commercial or financial relationships that could be construed as a potential conflict of interest.

Figures

Figure 1
Figure 1
Flowchart, analysis of renal function, and kidney H&E staining. (A) The flowchart of the animal experiment. Mice were randomly divided into three groups after 5/6Nx and fed with different weight of protein. (B) Comparison of the body weight after 8-week feeding (ANOVA test). (C) Comparison of the urinary protein (24 h) (ANOVA test). (D) Comparison of the serum level of creatinine (ANOVA test). (E) Comparison of the level of blood urea nitrogen (ANOVA test). (F) Representative images (40×) for H&E staining of kidney tissues and score of renal injury (ANOVA test). Ns, not significant; *p < 0.05; **p < 0.01; ***p < 0.001; ****p < 0.0001.
Figure 2
Figure 2
LKD attenuate renal fibrosis and decrease inflammatory factors. (A) Representative images (40×) for Masson staining of kidney tissues and fibrosis area score (ANOVA test). (B) Representative images (40×) for Sirius red staining of kidney tissues and fibrosis area score (ANOVA test). (C) Representative images (40×) for immunohistochemical α-SMA of kidney tissues and fibrosis area score (ANOVA test). (D–F) Comparison of inflammatory factors by ELISA. (D) IL-6, (E) TNF-α, (F) IL-1β (ANOVA test). Ns, not significant; *p < 0.05; **p < 0.01; ***p < 0.001; ****p < 0.0001.
Figure 3
Figure 3
Gut microbiome taxonomic features of four groups. (A) Venn plot indicating the number of OTUs of four groups. (B) α-Diversity: Chao1 and Shannon indexes (Mann-Whitney U-test). (C) β-Diversity analyzed by NMDS based on Bray-Curtis distances. (D) Comparison of the relative abundance of gut microbiota at the phylum level (Mann-Whitney U-test). (E) Comparison of the F/B ratio (Mann-Whitney U-test). (F) Chord plot showing the top 10 genera and their contribution to each group. *P < 0.05.
Figure 4
Figure 4
Different expressed metabolites between NPD and sham. (A) OPLS-DA score chart of positive mode between sham and NPD. (B) OPLS-DA score chart of negative mode between sham and NPD. (C) Heatmap of 219 DEMs between sham and NPD after combing positive and negative modes. The classification of these DEMs is indicated by different colors. (D) Enriched KEGG pathways of DEMs between sham and NPD with p < 0.05.
Figure 5
Figure 5
Different expressed metabolites between LKD and NPD. (A) OPLS-DA score chart of positive mode between LKD and NPD. (B) OPLS-DA score chart of negative mode between LKD and NPD. (C) Heatmap of 492 DEMs between LKD and NPD after combing positive and negative modes. The classification of these DEMs is indicated by different colors. (D) Enriched KEGG pathways of DEMs between LKD and NPD with p < 0.05.
Figure 6
Figure 6
Different expressed metabolites between LKD and LPD. (A) OPLS-DA score chart of positive mode between sham and LPD. (B) OPLS-DA score chart of negative mode between LKD and LPD. (C) Heatmap of 99 DEMs between LKD and LPD after combing positive and negative modes. The classification of these DEMs is indicated by different colors. (D) Enriched KEGG pathways of DEMs between LKD and LPD with p < 0.05.
Figure 7
Figure 7
Identification of key DEMs and OTUs associated with LKD. (A–C) Volcano plots showing differential OTUs by DEseq2. (A) NPD vs. sham. (B) NPD vs. LKD. (C) LPD vs. LKD. (D) Histogram showing different numbers of OTUs among three comparisons. (E) Venn plot showing the overlapped differential OTUs among three comparisons; heatmap showing the abundance of overlapped differential OTUs. (F) Venn plot showing the overlapped differential KEGG metabolic pathways among three comparisons; heatmap showing the DEMs (NPD vs. LKD) involved in these pathways.
Figure 8
Figure 8
Spearman's correlations between differential metabolites and OTUs associated with LKD or parameters for CKD. (A) Heatmap showing Spearman's correlation between differential metabolites and OTUs associated with LKD or parameters for CKD. The IDs of metabolites or OTUs are highlighted in red (enriched in LKD) and blue (depleted in LKD). *p < 0.05, **p < 0.01, ***p < 0.001. (B) Sankey plot was used to visualize the relationship among the differential OTUs and serum metabolites associated with LKD, and major parameters of CKD. Red connections indicate significant positive correlations, and blue connections indicate significant negative correlations (Spearman's correlation analysis, p < 0.05). In the left and middle column, blue boxes indicate OTUs or DEMs that are significantly depleted in LKD compared with NPD, and red boxes indicate OTUs or DEMs that are significantly elevated in LKD compared with NPD.

Similar articles

Cited by

References

    1. Bikbov B, Purcell CA, Levey AS, Smith M, Abdoli A, Abebe M, et al. . Global, regional, and national burden of chronic kidney disease, 1990-2017: a systematic analysis for the Global Burden of Disease Study 2017. Lancet. (2020) 395:709–33. - PMC - PubMed
    1. Weiner ID, Mitch WE, Sands JM. Urea and ammonia metabolism and the control of renal nitrogen excretion. Clin J Am Soc Nephrol. (2015) 10:1444–58. 10.2215/CJN.10311013 - DOI - PMC - PubMed
    1. Hostetter TH, Meyer TW, Rennke HG, Brenner BM. Chronic effects of dietary protein in the rat with intact and reduced renal mass. Kidney Int. (1986) 30:509–17. 10.1038/ki.1986.215 - DOI - PubMed
    1. Brunori G, Viola BF, Parrinello G, De Biase V, Como G, Franco V, et al. . Efficacy and safety of a very-low-protein diet when postponing dialysis in the elderly: A prospective randomized multicenter controlled study. Am J Kidney Dis. (2007) 49:569–80. 10.1053/j.ajkd.2007.02.278 - DOI - PubMed
    1. Ikizler TA, Burrowes JD, Byham-Gray LD, Campbell KL, Carrero JJ, Chan W, et al. . KDOQI Clinical Practice Guideline for Nutrition in CKD: 2020 Update. Am J Kidney Dis. (2020) 76:S1–107. 10.1053/j.ajkd.2020.05.006 - DOI - PubMed

LinkOut - more resources