Effect of Thymoquinone on Renal Damage Induced by Hyperlipidemia in LDL Receptor-Deficient (LDL-R-/-) Mice
- PMID: 35845925
- PMCID: PMC9279052
- DOI: 10.1155/2022/7709926
Effect of Thymoquinone on Renal Damage Induced by Hyperlipidemia in LDL Receptor-Deficient (LDL-R-/-) Mice
Abstract
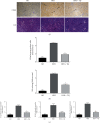
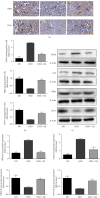
Hyperlipidemia is a well-established risk factor for kidney injury, which can lead to chronic kidney disease (CKD). Thymoquinone (TQ) is one of the most active ingredients in Nigella sativa seeds. It has various beneficial properties, including antioxidant and anti-inflammatory activities. TQ also exerts positive effects on doxorubicin- (DOX-) induced nephropathy and ischemia-reperfusion-induced kidney injury in rats. Therefore, in this study, we investigated the possible protective effects of TQ against kidney injury in low-density lipoprotein receptor-deficient (LDL-R-/-) mice. Eight-week-old male LDL-R-/- mice were randomly divided into the following three groups: normal diet (ND group), high-fat diet (HFD group), and HFD combined with TQ (HFD+TQ group). The mice were fed the same diet for eight weeks. After eight weeks, we performed serological analysis of the mice in all three groups. We histologically analyzed the kidney tissue and also investigated the expression of proinflammatory cytokines in the kidney tissue. Metabolic characteristics, including total cholesterol (TC), low-density lipoprotein-cholesterol (LDL-C), and creatinine (CRE) levels, were lower in the LDL-R-/- HFD+TQ mice than in the HFD mice. Periodic acid-Schiff (PAS) and Masson's trichrome staining revealed excessive lipid deposition and collagen accumulation in the kidneys of the LDL-R-/- HFD mice, which were significantly reduced in the LDL-R-/- HFD+TQ mice. Furthermore, macrophages and levels of proinflammatory cytokines were lower in the kidney tissues of the LDL-R-/- HFD+TQ mice than in those of the LDL-R-/- HFD mice. Moreover, profibrosis- and oxidative stress-related protein expression was lower in the kidney tissues of the LDL-R-/- HFD+TQ mice than in those of the LDL-R-/- HFD mice. These results indicate that TQ may be a potential therapeutic agent for kidney damage caused by hyperlipidemia.
Copyright © 2022 Wanjing Li et al.
Conflict of interest statement
The authors have declared that no competing interests exist.
Figures


Similar articles
-
Thymoquinone Protects against Hyperlipidemia-Induced Cardiac Damage in Low-Density Lipoprotein Receptor-Deficient (LDL-R-/-) Mice via Its Anti-inflammatory and Antipyroptotic Effects.Biomed Res Int. 2020 Oct 29;2020:4878704. doi: 10.1155/2020/4878704. eCollection 2020. Biomed Res Int. 2020. PMID: 33178827 Free PMC article.
-
Thymoquinone Protects Neurons in the Cerebellum of Rats through Mitigating Oxidative Stress and Inflammation Following High-Fat Diet Supplementation.Biomolecules. 2021 Jan 27;11(2):165. doi: 10.3390/biom11020165. Biomolecules. 2021. PMID: 33513819 Free PMC article.
-
Thymoquinone reduces cardiac damage caused by hypercholesterolemia in apolipoprotein E-deficient mice.Lipids Health Dis. 2018 Jul 26;17(1):173. doi: 10.1186/s12944-018-0829-y. Lipids Health Dis. 2018. PMID: 30049280 Free PMC article.
-
Thymoquinone, a major constituent in Nigella sativa seeds, is a potential preventative and treatment option for atherosclerosis.Eur J Pharmacol. 2021 Oct 15;909:174420. doi: 10.1016/j.ejphar.2021.174420. Epub 2021 Aug 12. Eur J Pharmacol. 2021. PMID: 34391767 Review.
-
The protective effect of thymoquinone, an anti-oxidant and anti-inflammatory agent, against renal injury: a review.Saudi J Kidney Dis Transpl. 2009 Sep;20(5):741-52. Saudi J Kidney Dis Transpl. 2009. PMID: 19736468 Review.
Cited by
-
Analysis of Dopamine Receptor D2 Gene Polymorphism and Correlation with Dyslipidemia in the Chinese Population.Mol Syndromol. 2024 Feb;15(1):37-42. doi: 10.1159/000533637. Epub 2023 Sep 13. Mol Syndromol. 2024. PMID: 38357252 Free PMC article.
-
Alleviation of High-Fat Diet-Induced Hyperlipidemia in Mice by Stachys sieboldii Miq. Huangjiu via the Modulation of Gut Microbiota Composition and Metabolic Function.Foods. 2024 Jul 26;13(15):2360. doi: 10.3390/foods13152360. Foods. 2024. PMID: 39123552 Free PMC article.
References
-
- Sudhakaran S., Bottiglieri T., Tecson K. M., Kluger A. Y., McCullough P. A. Alteration of lipid metabolism in chronic kidney disease, the role of novel antihyperlipidemic agents, and future directions. Reviews in Cardiovascular Medicine . 2018;19(3):77–88. doi: 10.31083/j.rcm.2018.03.908. - DOI - PubMed
-
- Navar-Boggan A. M., Peterson E. D., D'Agostino R. B., Sr., Neely B., Sniderman A. D., Pencina M. J. Response to letter regarding article, "hyperlipidemia in early adulthood increases long-term risk of coronary heart disease". Circulation . 2015;132(16, article e203) doi: 10.1161/CIRCULATIONAHA.115.017048. - DOI - PubMed
-
- Lee E. S., Kwon M. H., Kim H. M., et al. Dibenzoylmethane ameliorates lipid-induced inflammation and oxidative injury in diabetic nephropathy. The Journal of Endocrinology . 2019;240(2):169–179. - PubMed
Publication types
MeSH terms
Substances
LinkOut - more resources
Full Text Sources
Medical

