. 2022 Jul 5:2022:7382130.
doi: 10.1155/2022/7382130. eCollection 2022.

Investigating Celastrol's Anti-DCM Targets and Mechanisms via Network Pharmacology and Experimental Validation

Affiliations

Investigating Celastrol's Anti-DCM Targets and Mechanisms via Network Pharmacology and Experimental Validation

Rui Xi et al. Biomed Res Int. .

Retraction in

Abstract

Methods: Data from TCMSP and GEO databases were utilized to identify targets for Celastrol on DCM. The relationship between the major targets and conventional glycolipid metabolism was obtained with Spearman correlation analysis. Experiments on animals were conducted utilizing healthy control (HC), low-dose Celastrol interventions (CL), and no intervention groups (NC), all of which had 8 SD rats in each group. To study alterations in signaling molecules, RT-PCR was performed.

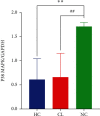
Results: There were 76 common targets and 5 major targets for Celastrol-DCM. Celastrol have been found to regulate AGE-RAGE, TNF, MAPK, TOLL-like receptors, insulin resistance, and other signaling pathways, and they are closely linked to adipocytokines, fatty acid metabolism, glycolipid biosynthesis, and glycosylphosphati-dylinositol biosynthesis on DCM. These five major targets have been found to regulate these pathways. Experiments on rats indicated that P38 MAPK was considerably elevated in the cardiac tissue from rats in the CL and NC groups compared to the HC group, and the difference was statistically significant (P < 0.01). Significant differences were seen between the CL and NC groups in P38 MAPK levels, with a statistical significance level of less than 0.05.

Conclusion: Celastrol may play a role in reversing energy remodeling, anti-inflammation, and oxidative stress via modulating p38 protein expression in the MAPK pathway, which have been shown in the treatment of DCM.


Conflict of interest statement

Authors confirm that there is no conflicts of interest.

Figures

Figure 1
Figure 1
A schematic diagram showing analysis performed in this study. Network pharmacology methods were used to identify effective targets of Celastrol through TCMSP database, Swiss Target database, and Batman-TCM database. Potential effective targets related to DCM were then identified using DisGeNET database, OMIM database, GeneCard database, and GEO database (GSE4745). Further, common targets of Celastrol and DCM were determined using a Venn diagram. STRING tool was used to construct PPI networks for targets of Celastrol and DCM, and visualization was done using Cytoscape 3.7.1. KEGG enrichment analysis was performed to explore signaling pathways of the drug and DCM that are implicated in energy reconstruction. The metabolic pathway level of each sample was quantified based on ssGSEA, and the relationship between major targets and energy metabolism was explored through Spearman correlation analysis. Experiments on animals were conducted to study alterations in signaling molecules.
Figure 2
Figure 2
Venn diagram of common targets of Celastrol and DCM. There were 161 targets of Celastrol that can prevent and treat disease, 2075 targets for the prevention and treatment of DCM, and 76 common targets for Celastrol and diabetic cardiomyopathy (DCM).
Figure 3
Figure 3
Relationship between the five key targets. Celastrol key targets against DCM were IL6, VEGFA, TNF, CASP3, and MAPK8.
Figure 4
Figure 4
GO enrichment analysis of biological processes associated with the five major targets of Celastrol on DCM. The top 30 biological processes (BP) with P < 0.05 were identified using R packages. (a) Histograms, (b) bubble diagram, and (c) chordal graph showing top 30 enriched BP categories. The x-axis represents enriched gene count or ratio, whereas the y-axis represents the different biological processes. Color intensity represents adjusted P value.
Figure 5
Figure 5
KEGG enrichment analysis for five key targets implicated in the role of Celastrol in DCM. Top 30 signaling pathway with P < 0.05 were identified using R packages. (a) Histograms, (b) bubble diagram, and (c) chordal graph showing top 30 enriched signaling pathways. The x-axis represents enriched gene count or ratio, and y-axis represents the different biological processes. Color intensity represents adjusted P value.
Figure 6
Figure 6
Network visualization of detailed interactions of Celastrol-target-GO-KEGG-DCM. Orange regions on both sides show the top 30 biological processes and the top 30 signal pathways in implicated in the mechanism of Celastrol in DCM. The upper green region represents Celastrol, the middle red region represents the 5 key targets, and the lower region represents DCM.
Figure 7
Figure 7
Correlation analysis between target gene expression levels and metabolic pathways. Correlation is color-coded; a value greater than 0 indicates a positive correlation whereas a value less than 0 indicates a negative correlation; P < 0.05 and ∗∗P < 0.01.
Figure 8
Figure 8
RT-PCR-based myocardial P38 MAPK protein expression for comparison. HC is the healthy control group, CL is the low-dose Celastrol intervention group, and NC is the nonintervention group. ∗∗P < 0.01 compared with HC group; ##P < 0.01 compared with NC group.

Similar articles

Cited by

References

    1. Nunes S., Soares E., Fernandes J., et al. Early cardiac changes in a rat model of prediabetes: brain natriuretic peptide overexpression seems to be the best marker. Cardiovascular Diabetology . 2013;12(1) doi: 10.1186/1475-2840-12-44. - DOI - PMC - PubMed
    1. Wende A. R., Schell J. C., Ha C. M., et al. Maintaining myocardial glucose utilization in diabetic cardiomyopathy accelerates mitochondrial dysfunction. Diabetes . 2020;69(10):2094–2111. doi: 10.2337/db19-1057. - DOI - PMC - PubMed
    1. Battault S., Renguet E., Van Steenbergen A., Horman S., Beauloye C., Bertrand L. Myocardial glucotoxicity: mMechanisms and potential therapeutic targets. Archives of Cardiovascular Diseases . 2020;113(11):736–748. doi: 10.1016/j.acvd.2020.06.006. - DOI - PubMed
    1. Freemantle N., Danchin N., Calvi-Gries F., Vincent M., Home P. D. Relationship of glycaemic control and hypoglycaemic episodes to 4-year cardiovascular outcomes in people with type 2 diabetes starting insulin. Diabetes, Obesity & Metabolism . 2016;18(2):152–158. doi: 10.1111/dom.12598. - DOI - PMC - PubMed
    1. Gao J. M., Hu B., Shen E. Research progress on the association between myocardial fibroblast transdifferentiation and diabetic cardiomyopathy. Zhonghua Xin Xue Guan Bing Za Zhi . 2020;48(10):885–889. doi: 10.3760/cma.j.cn112148-20191027-00659. - DOI - PubMed

Publication types

LinkOut - more resources