. 2022 Jul 1:13:890102.
doi: 10.3389/fphys.2022.890102. eCollection 2022.

Myosin 5a in the Urinary Bladder: Localization, Splice Variant Expression, and Functional Role in Neurotransmission

Affiliations

Myosin 5a in the Urinary Bladder: Localization, Splice Variant Expression, and Functional Role in Neurotransmission

Josephine A Carew et al. Front Physiol. .

Abstract

Dysregulation of neurotransmission is a feature of several prevalent lower urinary tract conditions, but the mechanisms regulating neurotransmitter release in the bladder are not completely understood. The unconventional motor protein, Myosin 5a, transports neurotransmitter-containing synaptic vesicles along actin fibers towards the varicosity membrane, tethering them at the active zone prior to reception of a nerve impulse. Our previous studies indicated that Myosin 5a is expressed and functionally relevant in the peripheral nerves of visceral organs such as the stomach and the corpora cavernosa. However, its potential role in bladder neurotransmission has not previously been investigated. The expression of Myosin 5a was examined by quantitative PCR and restriction analyses in bladders from DBA (dilute-brown-nonagouti) mice which express a Myosin 5a splicing defect and in control mice expressing the wild-type Myosin 5a allele. Functional differences in contractile responses to intramural nerve stimulation were examined by ex vivo isometric tension analysis. Data demonstrated Myosin 5a localized in cholinergic nerve fibers in the bladder and identified several Myosin 5a splice variants in the detrusor. Full-length Myosin 5a transcripts were less abundant and the expression of splice variants was altered in DBA bladders compared to control bladders. Moreover, attenuation of neurally-mediated contractile responses in DBA bladders compared to control bladders indicates that Myosin 5a facilitates excitatory neurotransmission in the bladder. Therefore, the array of Myosin 5a splice variants expressed, and the abundance of each, may be critical parameters for efficient synaptic vesicle transport and neurotransmission in the urinary bladder.

Keywords: Myosin 5a; bladder smooth muscle; myosin motor; neurotransmission; peripheral nerve; protein splice variants.


Conflict of interest statement

The authors declare that the research was conducted in the absence of any commercial or financial relationships that could be construed as a potential conflict of interest.

Figures

FIGURE 1
FIGURE 1
Expression of Myo5a in bladder tissue. (A–C) Laser scanning confocal microscopy of sections from WT detrusor detected Myo5a immunoreactivity (red staining) on nerve fibers that were immunoreactive for the pan-neuronal marker synaptophysin (Syp, green staining). The merged image on the right shows co-localization of these markers in yellow. (D–F) Immunoreactivity for Myo5a (red staining) and vesicular acetylcholine transporter (VAChT, green staining) in WT bladder muscularis. Co-localization of these two proteins in the merged panel (yellow) indicates expression of Myo5a in cholinergic fibers of the urinary bladder. Arrows indicate serosa. (Scale bar = 50 µm; Mag ×40).
FIGURE 2
FIGURE 2
Myo5a schematic. Schematic of Myo5a mRNA/cDNA, depicting regions encoding the major structural domains of the Myo5a protein monomer: the ATP hydrolyzing/actin binding motor domain, the light-chain binding IQ domain, the central dimerization domain, the alternative exon domain, and the globular tail/cargo binding domain. Three coiled-coil regions (CC1, CC2, and CC3) have been described and are shown in the second line; CC1 and CC2 are within the dimerization domain, while CC3 is intact only in variants that do not contain exon F (such as the predominant brain form of Myo5a, ABCE), since it includes part of exon E sequence and part of globular tail domain sequence. CC3 is bisected by exon F, if present. Alternative exons are shown in the expansion; sequence encoding the constitutive exons A, C and E and the optional exons B, D and F are indicated by solid and speckled patterns, respectively. The red arrow indicates the position of the molecular defect in the Myo5a gene in the DBA mouse, which impairs mRNA splicing. Below, the products of detrusor nested PCR reactions are shown, as are the locations of restriction enzyme cleavage sites. The absence of exon B (and its diagnostic Sty I restriction site) in detrusor nested PCR products is indicated by the dashed line. The red lines indicate the positions of the RT-PCR assays employed.
FIGURE 3
FIGURE 3
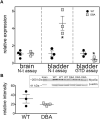
Overall Myo5a expression in bladder. (A) cDNA from brains and detrusors of WT (black circles, N = 3) and DBA animals (gray squares, N = 3) was assayed in triplicate for the two different pan-Myo5a RT-PCR primer/probe sets indicated, and for 18S rRNA as internal control. Expression was determined by the ∆∆Ct method and graphed relative to WT within each organ. Comparison of WT vs. DBA brain was not significant (p = 0.67), but of WT vs. DBA detrusor was significantly higher for the N-terminal (N-t) assay and lower for the globular tail domain (GTD) assay (*p < 0.05). (B) Representative immunoblot (inset box) and quantitative graph showing the expression of Myo5a protein in lysates from WT (black circles, N = 3) and DBA detrusors (gray circles, N = 3). 30 µg aliquots of detrusor extracts were immunoblotted with Myo5a antibody (LF-18). Brain extract was loaded in lane 1 as a positive control. When intensities of the ∼200 kDa Myo5a band were corrected for intensities of the 42 kDa ß-actin loading control, WT and DBA Myo5a protein levels were not significantly different (p = 0.4).
FIGURE 4
FIGURE 4
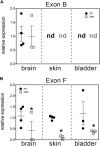
Relative expression of variant exons in WT and DBA tissues. cDNAs made from total RNA of brain, skin and detrusor of WT animals (black circles, N = 4) and DBA animals (gray squares, N = 3) were assayed in triplicate for Myo5a exon B or for exon F with their specific TaqMan assays, and for 18S rRNA as an internal control. Expression was determined by the ∆∆Ct method and graphed relative to WT within each tissue. Horizontal line indicates average relative expression ±SEM. (A) Expression of exon B in brain was not different in DBA compared to WT (p = 0.67). In detrusor and skin, exon B was not detected (nd) and therefore differences between strains could not be determined. (B) Expression of exon F was lower in DBA brain, skin and detrusor (*p < 0.05) than in corresponding WT tissues.
FIGURE 5
FIGURE 5
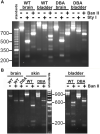
Myo5a splice variants in tissues of WT and DBA mice. (A) Illustration of differential Myo5a variant expression pattern in detrusor and brain from WT and DBA mice. Nested PCR fragments of brain and detrusor cDNAs from a WT and a DBA mouse pair were prepared with primer pair 2, then compared by agarose gel electrophoresis either undigested or digested with Sty I or Ban II, as shown above the lanes. A 50 base pair (bp) ladder with weighted 350 bp standard is at left. Contrast was adjusted separately for the standard lane, to bring out the positions of the smaller standards. (B) Nested PCR fragments prepared from brain, skin, and detrusor of a WT and DBA mouse with primer pair 2, were compared before and after digestion with Ban II. A100 bp ladder with weighted 600 bp standard is shown and contrast was adjusted separately. All lanes were from a single gel; those for detrusor PCRs and digests were moved to the right, so that sizes of the standard fragments could be added.
FIGURE 6
FIGURE 6
Myo5a exons D and F in bladders from WT and DBA mice. (A) Nested PCR fragments from detrusors of WT (N = 6) and DBA (N = 5) animals were prepared with primer pair 3 and electrophoresed. A representative agarose gel with bands corresponding to fragments with and without exon D from three WT and three DBA detrusors is shown, with individual WT and DBA brain samples as controls. Exposure of the 50 bp standard lane, with weighted 350 bp band, was adjusted separately. (B) The intensity of +D bands is graphed as a proportion of total intensity in each lane (sum of +D and −D) and plotted for WT (black circles), and DBA (gray squares). Horizontal line indicates average intensity in % ± SEM for the +D band in all replicates. The comparison between WT and DBA detrusor was significant (*p = 0.015). (C) Nested PCR fragments from detrusor of three WT and three DBA animals were prepared with primer pair 4, digested with Ban II to cleave the +D band, and electrophoresed. The relative positions of detrusor exon F-containing digestion fragments including or lacking exon D are indicated, and a flanking lane with 100 bp standards is marked. Contrast for the standard lane was adjusted separately. (D) Data are graphically represented; the horizontal line indicates average intensities in % ± SEM for PCR product containing exon D (black circles, WT; gray squares, DBA) are graphed. Coincidence of exons D and F in the same cDNA fragment was significantly reduced in DBA detrusor (p = 0.03).
FIGURE 7
FIGURE 7
Morphologic, functional and molecular evaluation of bladder smooth muscle contractile apparatus. Histomorphometric evaluation of bladder tissue sections stained with H&E (A) and MT (B) from WT (N = 3) and DBA (N = 3) mice (Mag X10, scale bar 50 µm, arrows indicate serosa). (C) Quantification of the collagen/smooth muscle (SM) ratio was comparable between WT (black bar) and DBA (gray bar) bladders. (D) Representative Western blot and (E) quantitative graph of intensity of myosin heavy chain (Myh11) immunoreactivity detected in protein lysates from mucosa-denuded WT and DBA bladders. Band intensities in WT (black circles, N = 3) were not different from DBA (gray squares, N = 3) when normalized by ß-actin, which was used as the loading control. (F) Contractile responses induced by direct smooth muscle depolarization achieved by KCl 120 mM in WT (N = 11, black bar) and DBA (N = 13, gray bar) bladders were not different.
FIGURE 8
FIGURE 8
Contractile responses to EFS in WT and DBA bladders. (A) Representative membrane and quantitative graph showing the expression of neuronal marker peripherin in WT (N = 3, black circles) and DBA (N = 3, gray squares) detrusor lysates. The intensity of both immunoreactive bands, corresponding to the ∼56 and ∼58 kDa peripherin isoforms (Landon et al., 2000) were normalized by internal control β-actin. No differences in peripherin expression were detected between WT and DBA detrusors. (B) Representative tracing showing the contractile responses to EFS at frequencies between 2 and 64 Hz in WT (top trace) vs. DBA (bottom trace) detrusors. (C) The amplitude and (D) the area under the curve (AUC) of EFS-induced contractions of WT (black circles) and DBA (gray squares) detrusor tissue are plotted. Contractile responses of DBA detrusor were significantly lower than that of WT detrusor over a range of frequencies, as indicated by the asterisks. (E) The peak rate of rise of the ascending phase of the contraction, (F) the time to peak, as well as (G) the rate of decay (Tau) of the descending phase of the neurogenic contractions are graphed for WT (black circles) and DBA (gray squares) detrusors. Especially at middle to higher frequencies of stimulation, contractions in DBA mice were significantly decreased in slope with delayed time to peak and prolonged recovery time, compared to those measured in WT (N = 11 WT, N = 13 DBA; *p < 0.05).
FIGURE 9
FIGURE 9
Purinergic and cholinergic inhibition of neurally evoked contractile responses. Effect of post-junctional inhibition on the frequency-response curves in WT [(A,D), black symbols] and DBA [(B,E), gray symbols] detrusors. Contractile responses to EFS in the absence (triangles) versus the presence (diamonds) of P2XR antagonists (NF449 and 5BDBD) in detrusors from (A) WT and (B) DBA mice. Following purinergic inhibition, responses to EFS of both WT and DBA detrusors were significantly reduced at all frequencies as indicated by asterisks. Data are normalized by the baseline response (without inhibitors) at 32 Hz. (C) Compared to WT (black circles), the reduction in force relative to the baseline response due to purinergic inhibition (change from baseline) was significantly lower in DBA detrusors (gray squares) at frequencies of stimulation above 8 Hz (*significantly lower than WT at this frequency; # significantly lower than 2 and 4 Hz within DBA). Comparison of the effect of muscarinic receptor antagonist atropine on nerve-mediated contractile responses in (D) WT and (E) DBA detrusors. Normalized force is graphed versus stimulation frequency, in the absence (triangles) and presence (diamonds) of atropine. Data are normalized by baseline responses at 32 Hz. Atropine significantly reduced the responses of both WT and DBA detrusor to EFS at frequencies greater than 1 Hz (*). (F) The inhibitory effect of atropine on nerve mediated responses relative to baseline conditions was significantly less in DBA (gray squares) at stimulations from 1 to 8 Hz compared to the effect in WT (black circles). (* significantly lower than WT at this frequency; # significantly higher than 1–4 Hz within DBA; ⇞ significantly higher than 1 and 2 Hz within DBA; ⇟ significantly different than 1, 2, 32 and 64 Hz within WT; $ significantly lower than 8–32 Hz within WT (N = 11 WT, N = 13 DBA, symbols indicate p < 0.05)).
FIGURE 10
FIGURE 10
Purinergic responses of WT and DBA bladders. (A) Comparison of the contractile response of WT (black bar) and DBA (gray bar) bladder smooth muscle to the purinergic receptor agonist, αβmeATP (10 µM). Contractions of WT and DBA bladders were not significantly different under this condition (N = 11 WT, N = 13 DBA; p = 0.21). (B) Western blot comparing expression of the P2X1 purinergic receptor in WT and DBA extracts from bladder tissue devoid of mucosa. β-actin, shown in bottom panel, served as loading control. Molecular weights of mass standards (in kDa) are indicated at tick marks. (C) Quantitative data for WT (black circles) and DBA (gray squares) are graphed at right. The intensity of P2X1 receptor immunoreactivity, normalized by intensity of β-actin, was not different between groups (N = 3, p = 0.2).
FIGURE 11
FIGURE 11
Cholinergic responses of WT and DBA bladders. (A) Contractile responses of DBA (gray bar) bladder smooth muscle to the muscarinic receptor agonist CCh, was significantly lower than WT (black bar) responses (N = 11 WT, N = 13 DBA, *p = 0.041). (B) Western blot comparing expression of M3R in WT and DBA bladder smooth muscle extracts, relative to β-actin loading control. The molecular weight in kDa of mass standards are shown by the tick marks. (C) Quantitative data indicate that muscarinic M3R expression in WT (black circles) and DBA (gray squares) detrusors was not significantly different (N = 3, p = 0.8). (D) Contractile responses induced by CCh in WT and DBA detrusors were generated before (black bars) and after (gray bars) inhibition of the M1R inhibitor with pirenzepine. In WT detrusors, CCh-evoked contractions were significantly inhibited by pirenzepine (N = 7; *p = 0.008), while contractions in DBA detrusors were not affected (N = 5, p = 0.31). In the presence of pirenzepine, the contractile response to CCh in WT was not different from DBA (p = 0.25). (E) Western blot comparing the expression of the facilitatory muscarinic receptor, M1R, in three WT and three DBA bladder muscularis extracts. Molecular weight in kDa of mass standards is indicated at tick marks. (F) The intensity of M1R immunoreactivity, normalized to the β-actin loading control, was not significantly different in WT (black circles) and DBA (gray squares) bladders (N = 3, p = 0.7).

Similar articles

Cited by

References

    1. Au J. S.-Y., Huang J.-D. (2002). A Tissue-specific Exon of Myosin Va Is Responsible for Selective Cargo Binding in Melanocytes. Cell Motil. Cytoskelet. 53 (2), 89–102. 10.1002/cm.10061 - DOI - PubMed
    1. Brooks S. A., Gabreski N., Miller D., Brisbin A., Brown H. E., Streeter C., et al. (2010). Whole-genome SNP Association in the Horse: Identification of a Deletion in Myosin Va Responsible for Lavender Foal Syndrome. PLoS Genet. 6 (4), e1000909. 10.1371/journal.pgen.1000909 - DOI - PMC - PubMed
    1. Brozzi F., Diraison F., Lajus S., Rajatileka S., Philips T., Regazzi R., et al. (2012). Molecular Mechanism of Myosin Va Recruitment to Dense Core Secretory Granules. Traffic 13 (1), 54–69. 10.1111/j.1600-0854.2011.01301.x - DOI - PubMed
    1. Buttow N. C., Espreafico E. M., de Souza R. R., Romano E. B. (2006). Immunolocalization of Myosin-V in the Peribronchial, Intrapulmonary Peritracheal Plexuses of the Wistar Rat. J. Neurosci. Methods 152 (1-2), 274–277. 10.1016/j.jneumeth.2005.09.012 - DOI - PubMed
    1. Carew J. A., Cristofaro V., Siegelman N. A., Goyal R. K., Sullivan M. P. (2021). Expression of Myosin 5a Splice Variants in Murine Stomach. Neurogastroenterol. Motil. 33 (10), e14162. 10.1111/nmo.14162 - DOI - PubMed

LinkOut - more resources