

Exploring the Effects of Mitonuclear Interactions on Mitochondrial DNA Gene Expression in Humans
- PMID: 35846132
- PMCID: PMC9277102
- DOI: 10.3389/fgene.2022.797129
Exploring the Effects of Mitonuclear Interactions on Mitochondrial DNA Gene Expression in Humans
Abstract
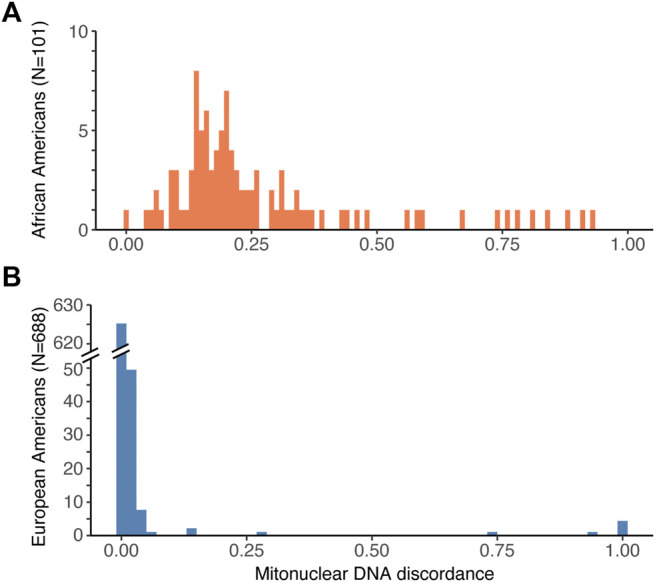
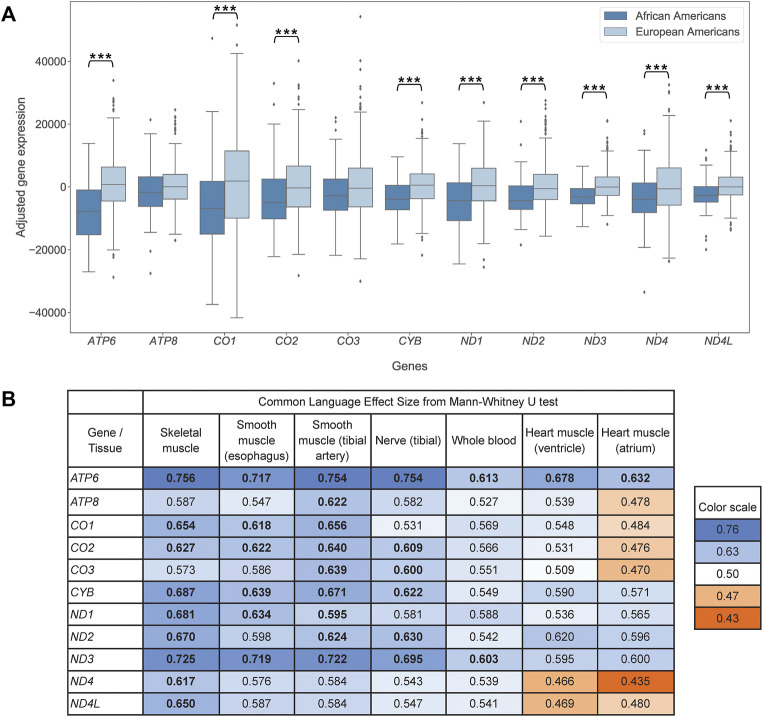
Most mitochondrial protein complexes include both nuclear and mitochondrial gene products, which coevolved to work together. This coevolution can be disrupted due to disparity in genetic ancestry between the nuclear and mitochondrial genomes in recently admixed populations. Such mitonuclear DNA discordance might result in phenotypic effects. Several nuclear-encoded proteins regulate expression of mitochondrial DNA (mtDNA) genes. We hypothesized that mitonuclear DNA discordance affects expression of genes encoded by mtDNA. To test this, we utilized the data from the GTEx project, which contains expression levels for ∼100 African Americans and >600 European Americans. The varying proportion of African and European ancestry in recently admixed African Americans provides a range of mitonuclear discordance values, which can be correlated with mtDNA gene expression levels (adjusted for age and ischemic time). In contrast, European Americans did not undergo recent admixture. We demonstrated that, for most mtDNA protein-coding genes, expression levels in energetically-demanding tissues were lower in African Americans than in European Americans. Furthermore, gene expression levels were lower in individuals with higher mitonuclear discordance, independent of population. Moreover, we found a negative correlation between mtDNA gene expression and mitonuclear discordance. In African Americans, the average value of African ancestry was higher for nuclear-encoded mitochondrial than non-mitochondrial genes, facilitating a match in ancestry with the mtDNA and more optimal interactions. These results represent an example of a phenotypic effect of mitonuclear discordance on human admixed populations, and have potential biomedical applications.
Keywords: gene expression; genetic ancestry; mitochondrial DNA; mitonuclear DNA discordance; mitonuclear coevolution; mitonuclear incompatibility.
Copyright © 2022 Torres-Gonzalez and Makova.
Conflict of interest statement
The authors declare that the research was conducted in the absence of any commercial or financial relationships that could be construed as a potential conflict of interest.
Figures


Similar articles
-
Investigating mitonuclear interactions in human admixed populations.Nat Ecol Evol. 2019 Feb;3(2):213-222. doi: 10.1038/s41559-018-0766-1. Epub 2019 Jan 14. Nat Ecol Evol. 2019. PMID: 30643241 Free PMC article.
-
Selection Increases Mitonuclear DNA Discordance but Reconciles Incompatibility in African Cattle.Mol Biol Evol. 2025 Feb 3;42(2):msaf039. doi: 10.1093/molbev/msaf039. Mol Biol Evol. 2025. PMID: 39921600 Free PMC article.
-
Mitonuclear incompatibility as a hidden driver behind the genome ancestry of African admixed cattle.BMC Biol. 2022 Jan 17;20(1):20. doi: 10.1186/s12915-021-01206-x. BMC Biol. 2022. PMID: 35039029 Free PMC article.
-
The Role of Mitonuclear Incompatibility in Bipolar Disorder Susceptibility and Resilience Against Environmental Stressors.Front Genet. 2021 Mar 16;12:636294. doi: 10.3389/fgene.2021.636294. eCollection 2021. Front Genet. 2021. PMID: 33815470 Free PMC article. Review.
-
Mitonuclear interactions: evolutionary consequences over multiple biological scales.Philos Trans R Soc Lond B Biol Sci. 2014 Jul 5;369(1646):20130443. doi: 10.1098/rstb.2013.0443. Philos Trans R Soc Lond B Biol Sci. 2014. PMID: 24864313 Free PMC article. Review.
Cited by
-
Exploring the Impact of Mitonuclear Discordance on Disease in Latin American Admixed Populations.Genes (Basel). 2025 May 27;16(6):638. doi: 10.3390/genes16060638. Genes (Basel). 2025. PMID: 40565530 Free PMC article.
References
Grants and funding
LinkOut - more resources
Full Text Sources