Identification of Immune-Related Subtypes and Characterization of Tumor Microenvironment Infiltration in Kidney Renal Clear Cell Carcinoma
- PMID: 35846133
- PMCID: PMC9277187
- DOI: 10.3389/fgene.2022.906113
Identification of Immune-Related Subtypes and Characterization of Tumor Microenvironment Infiltration in Kidney Renal Clear Cell Carcinoma
Abstract
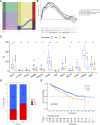
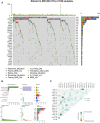
Background: Tumor microenvironment (TME) plays indisputable role in the progression of cancers. Immune cell infiltration (ICI) in TME was related to the prognosis of tumor patients. In this paper, we identified the pattern of immune-related ICI subtypes based on the TME immune infiltration pattern. Methods: The data from kidney renal clear cell carcinoma data (KIRC) was downloaded from the TCGA database. The distinct ICI subtypes were identified using CIBERSORT and ESTIMATE algorithms. The gene subgroups were identified based on DEGs in ICI subtypes. The single sample gene set enrichment analysis (ssGSEA) was used to ascertain the ICI score. Kaplan-Meier curve with log-rank test was conducted to analyze the survival probability of patients with KIRC in different subtypes. Results: The patients with high ICI scores exhibited a longer survival time and lower expression of checkpoint-related and immune activity-related genes. The high ICI score clusters were positively related to TMB. The patients in the low TMB subgroups have a favorable prognosis. The prediction ICI score did not affect the TMB status, and the low TMB subgroups + low/high ICI score subgroups exhibited better survival. Conclusion: In all, the tumor immune microenvironment, ICI score, and TMB were important determinants of KIRC patients' survival outcomes. The TMB + ICI score may be a potential biomarker for predicting the prognosis of patients and for targeted immunotherapies to treating KIRC.
Keywords: TCGA; TME; immune score; kidney renal clear cell carcinoma; tumor microenvironment.
Copyright © 2022 Qin, Wang and Zhang.
Conflict of interest statement
The authors declare that the research was conducted in the absence of any commercial or financial relationships that could be construed as a potential conflict of interest.
Figures


Similar articles
-
Identification of Immune-Related Subtypes and Characterization of Tumor Microenvironment Infiltration in Bladder Cancer.Front Cell Dev Biol. 2021 Aug 31;9:723817. doi: 10.3389/fcell.2021.723817. eCollection 2021. Front Cell Dev Biol. 2021. PMID: 34532318 Free PMC article.
-
Identification of the immune cell infiltration landscape in pancreatic cancer to assist immunotherapy.Future Oncol. 2021 Nov;17(31):4131-4143. doi: 10.2217/fon-2021-0495. Epub 2021 Aug 4. Future Oncol. 2021. PMID: 34346253
-
Characterization of the basement membrane in kidney renal clear cell carcinoma to guide clinical therapy.Front Oncol. 2022 Nov 10;12:1024956. doi: 10.3389/fonc.2022.1024956. eCollection 2022. Front Oncol. 2022. PMID: 36439501 Free PMC article.
-
Immune microenvironment infiltration landscape and immune-related subtypes in prostate cancer.Front Immunol. 2023 Jan 9;13:1001297. doi: 10.3389/fimmu.2022.1001297. eCollection 2022. Front Immunol. 2023. PMID: 36700224 Free PMC article. Review.
-
Understanding the Tumor Immune Microenvironment in Renal Cell Carcinoma.Cancers (Basel). 2023 Apr 27;15(9):2500. doi: 10.3390/cancers15092500. Cancers (Basel). 2023. PMID: 37173966 Free PMC article. Review.
Cited by
-
Identifying ADME-related gene signature for immune landscape and prognosis in KIRC by single-cell and spatial transcriptome analysis.Sci Rep. 2025 Jan 8;15(1):1294. doi: 10.1038/s41598-024-84018-7. Sci Rep. 2025. PMID: 39779746 Free PMC article.
References
-
- Bejarano L., Jordāo M. J. C., Joyce J. A. (2021). Therapeutic Targeting of the Tumor Microenvironment. J. Immunol. Res. 11, 933–959. 10.1158/2159-8290.cd-20-1808 - DOI - PubMed
-
- Cristescu R., Aurora-Garg D., Albright A., Xu L., Liu X. Q., Loboda A., et al. (2022). Tumor Mutational Burden Predicts the Efficacy of Pembrolizumab Monotherapy: A Pan-Tumor Retrospective Analysis of Participants with Advanced Solid Tumors. J. Immunother. Cancer 10 (1), e003091. 10.1136/jitc-2021-003091 - DOI - PMC - PubMed
LinkOut - more resources
Full Text Sources

