

Prognosis Prediction Through an Integrated Analysis of Single-Cell and Bulk RNA-Sequencing Data in Triple-Negative Breast Cancer
- PMID: 35846145
- PMCID: PMC9283578
- DOI: 10.3389/fgene.2022.928175
Prognosis Prediction Through an Integrated Analysis of Single-Cell and Bulk RNA-Sequencing Data in Triple-Negative Breast Cancer
Abstract
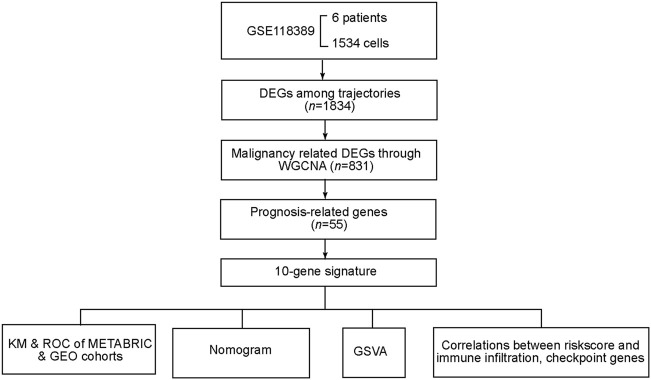
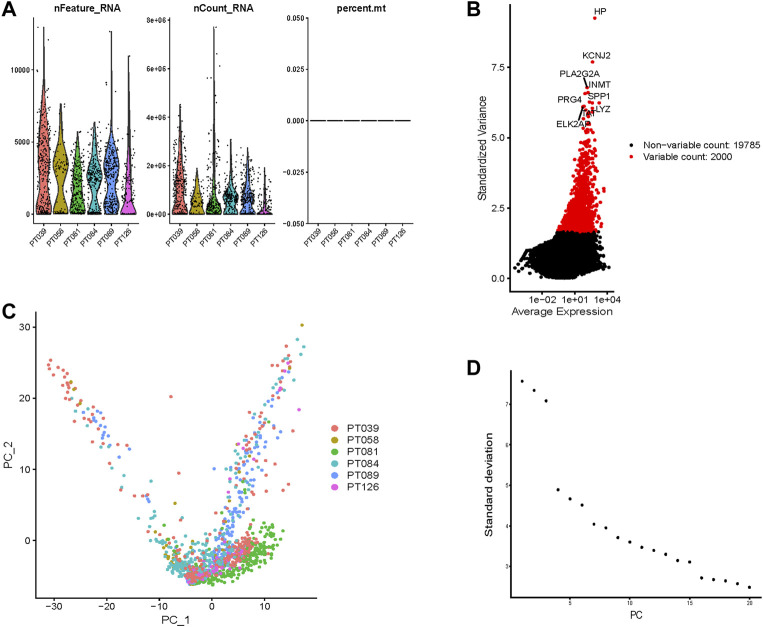
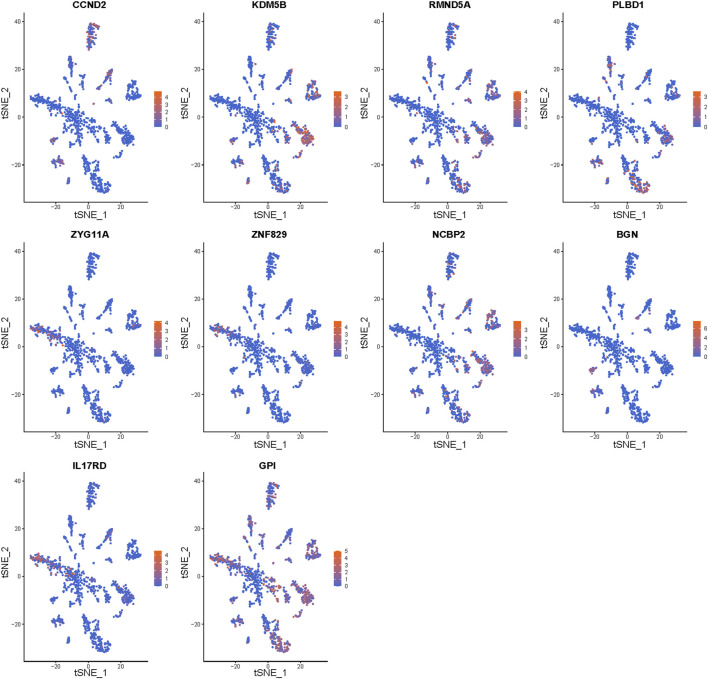
Background: Genomic and antigenic heterogeneity pose challenges in the precise assessment of outcomes of triple-negative breast cancer (TNBC) patients. Thus, this study was designed to investigate the cardinal genes related to cell differentiation and tumor malignant grade to advance the prognosis prediction in TNBC patients through an integrated analysis of single-cell and bulk RNA-sequencing (RNA-seq) data. Methods: We collected RNA-seq and microarray data of TNBC from two public datasets. Using single-cell pseudotime analysis, differentially expressed genes (DEGs) among trajectories from 1534 cells of 6 TNBC patients were identified as the potential genes crucial for cell differentiation. Furthermore, the grade- and tumor mutational burden (TMB)-related DEGs were explored via a weighted correlation network analysis using the Molecular Taxonomy of Breast Cancer International Consortium dataset. Subsequently, we utilized the DEGs to construct a prognostic signature, which was validated using another independent dataset. Moreover, as gene set variation analysis indicated the differences in immune-related pathways between different risk groups, we explored the immune differences between the two groups. Results: A signature including 10 genes related to grade and TMB was developed to assess the outcomes of TNBC patients, and its prognostic efficacy was prominent in two cohorts. The low-risk group generally harbored lower immune infiltration compared to the high-risk group. Conclusion: Cell differentiation and grade- and TMB-related DEGs were identified using single-cell and bulk RNA-seq data. A 10-gene signature for prognosis prediction in TNBC patients was constructed, and its performance was excellent. Interestingly, the signature was found to be closely related to tumor immune infiltration, which might provide evidence for the crucial roles of immune cells in malignant initiation and progression in TNBC.
Keywords: Triple-negative breast cancer (TNBC); immune infiltration; prognosis; single cell; tumor mutational burden.
Copyright © 2022 Wang and Chen.
Conflict of interest statement
The authors declare that the research was conducted in the absence of any commercial or financial relationships that could be construed as a potential conflict of interest.
Figures


Similar articles
-
Identification of differentially expressed genes at the single-cell level and prognosis prediction through bulk RNA sequencing data in breast cancer.Front Genet. 2022 Sep 16;13:979829. doi: 10.3389/fgene.2022.979829. eCollection 2022. Front Genet. 2022. PMID: 36186437 Free PMC article.
-
Identification of a pyroptosis-related prognostic signature in breast cancer.BMC Cancer. 2022 Apr 20;22(1):429. doi: 10.1186/s12885-022-09526-z. BMC Cancer. 2022. PMID: 35443644 Free PMC article.
-
Integrated analysis of single-cell RNA-seq and bulk RNA-seq unravels T cell-related prognostic risk model and tumor immune microenvironment modulation in triple-negative breast cancer.Comput Biol Med. 2023 Jul;161:107066. doi: 10.1016/j.compbiomed.2023.107066. Epub 2023 May 27. Comput Biol Med. 2023. PMID: 37263064
-
Identification of a novel glycolysis-related prognosis risk signature in triple-negative breast cancer.Front Oncol. 2023 May 18;13:1171496. doi: 10.3389/fonc.2023.1171496. eCollection 2023. Front Oncol. 2023. PMID: 37274269 Free PMC article.
-
Development of a CD8+ T cell-based molecular classification for predicting prognosis and heterogeneity in triple-negative breast cancer by integrated analysis of single-cell and bulk RNA-sequencing.Heliyon. 2023 Sep 6;9(9):e19798. doi: 10.1016/j.heliyon.2023.e19798. eCollection 2023 Sep. Heliyon. 2023. PMID: 37810147 Free PMC article.
Cited by
-
Overview of triple negative breast cancer prognostic signatures in the context of data science-driven clinico-genomics research.Ann Transl Med. 2022 Dec;10(24):1300. doi: 10.21037/atm-22-5477. Ann Transl Med. 2022. PMID: 36660729 Free PMC article. No abstract available.
-
Construction of stemness gene score by bulk and single-cell transcriptome to characterize the prognosis of breast cancer.Aging (Albany NY). 2023 Aug 18;15(16):8185-8203. doi: 10.18632/aging.204963. Epub 2023 Aug 18. Aging (Albany NY). 2023. PMID: 37602872 Free PMC article.
-
RankCompV3: a differential expression analysis algorithm based on relative expression orderings and applications in single-cell RNA transcriptomics.BMC Bioinformatics. 2024 Aug 7;25(1):259. doi: 10.1186/s12859-024-05889-1. BMC Bioinformatics. 2024. PMID: 39112940 Free PMC article.
References
LinkOut - more resources
Full Text Sources