. 2022 Jun 30:13:865313.
doi: 10.3389/fgene.2022.865313. eCollection 2022.

RNA-SSNV: A Reliable Somatic Single Nucleotide Variant Identification Framework for Bulk RNA-Seq Data

Affiliations

RNA-SSNV: A Reliable Somatic Single Nucleotide Variant Identification Framework for Bulk RNA-Seq Data

Qihan Long et al. Front Genet. .

Abstract

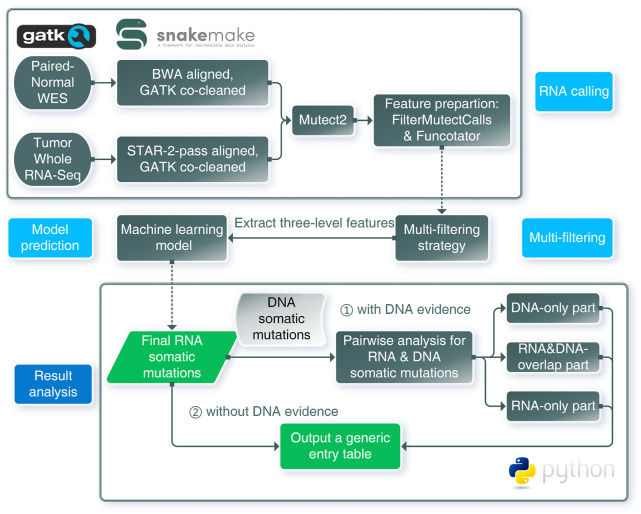
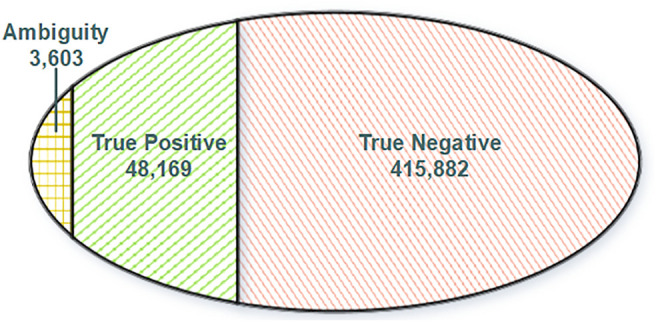
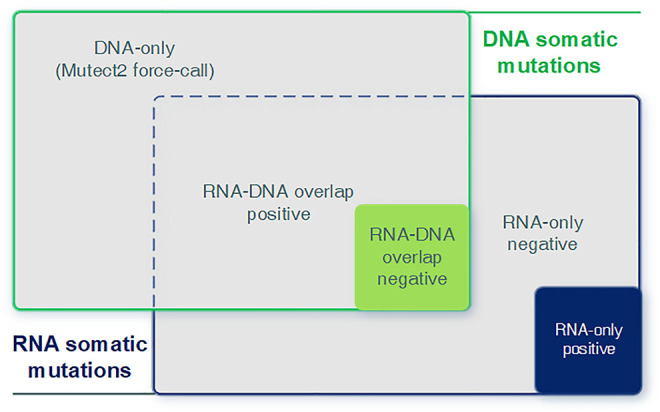
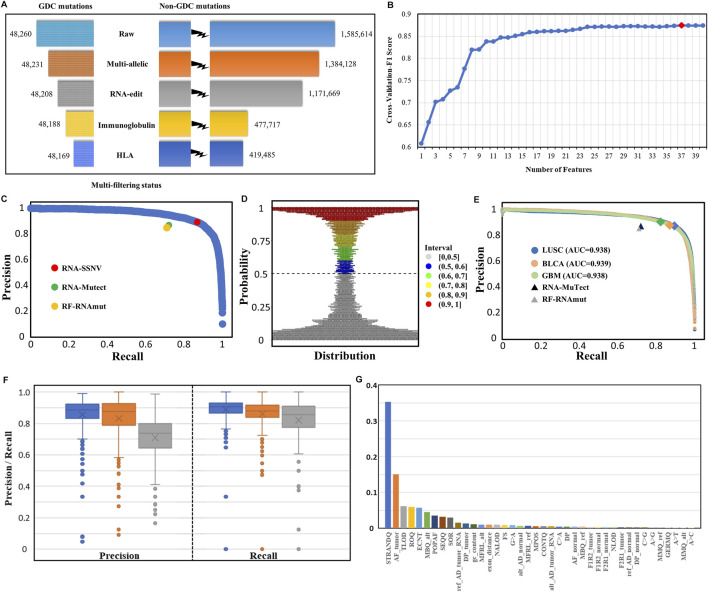
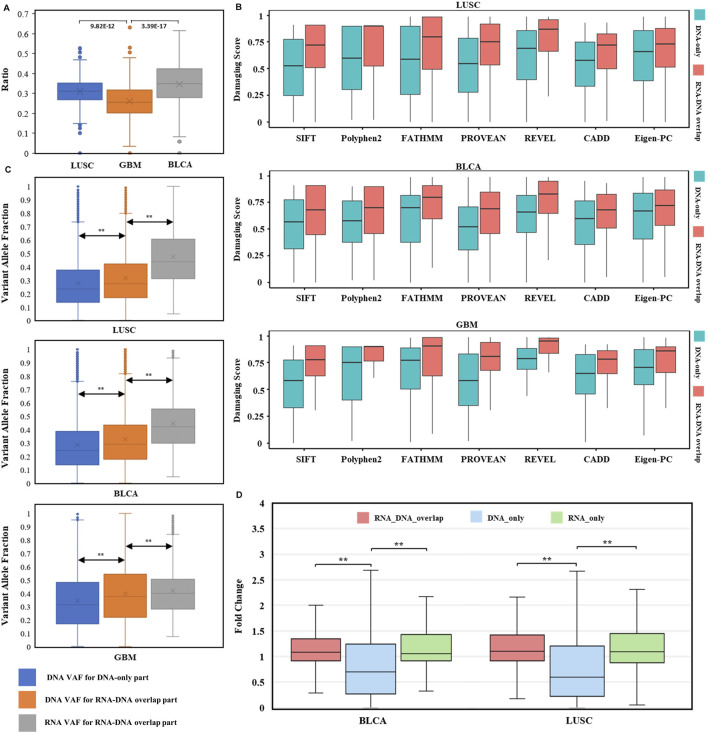
The usage of expressed somatic mutations may have a unique advantage in identifying active cancer driver mutations. However, accurately calling mutations from RNA-seq data is difficult due to confounding factors such as RNA-editing, reverse transcription, and gap alignment. In the present study, we proposed a framework (named RNA-SSNV, https://github.com/pmglab/RNA-SSNV) to call somatic single nucleotide variants (SSNV) from tumor bulk RNA-seq data. Based on a comprehensive multi-filtering strategy and a machine-learning classification model trained with comprehensively curated features, RNA-SSNV achieved the best precision-recall rate (0.880-0.884) in a testing dataset and robustly retained 0.94 AUC for the precision-recall curve in three validation adult-based TCGA (The Cancer Genome Atlas) datasets. We further showed that the somatic mutations called by RNA-SSNV tended to have a higher functional impact and therapeutic power in known driver genes. Furthermore, VAF (variant allele fraction) analysis revealed that subclonal harboring expressed mutations had evolutional selection advantage and RNA had higher detection power to rescue DNA-omitted mutations. In sum, RNA-SSNV will be a useful approach to accurately call expressed somatic mutations for a more insightful analysis of cancer drive genes and carcinogenic mechanisms.

Keywords: RNA; RNA-SSNV; RNA-Seq; cancer; machine learning; somatic mutation.


Conflict of interest statement

The authors declare that the research was conducted in the absence of any commercial or financial relationships that could be construed as a potential conflict of interest.

Figures

FIGURE 1
FIGURE 1
Schematic overview of the framework for RNA somatic mutation identification. RNA calling: RNA-seq and WES data were aligned and co-cleaned accordingly. Mutect2 was used to conduct RNA somatic calling with paired tumor RNA-seq and normal WES data. Features were extracted from outputs of FilterMutectCalls and Funcotator. Multi-filtering: multi-filtering strategy was conducted in Mutect2 called mutations by removing multiallelic, RNA-editing, immunoglobin, and HLA sites. Model prediction: using the trained model, mutations with extracted features were predicted as positive or negative, only positives were regarded as reliable mutations. Result analysis: pairwise analysis can be conducted when DNA evidence was available. RNA-SSNV will output a generic entry table containing all features and predicting information to facilitate downstream analysis.
FIGURE 2
FIGURE 2
Venn diagram of training dataset categories. True positive: RNA somatic mutations overlapping with GDC mutations. Ambiguity: RNA somatic mutations overlapping with GDC omitted somatic mutations. True negative: RNA somatic mutations without DNA support.
FIGURE 3
FIGURE 3
Graphical introduction for the DNA-only, DNA–RNA overlap, and RNA-only parts. Graphical introduction for detailed combination of RNA and DNA somatic mutations. DNA-only: DNA somatic mutations not detected (expressed) in RNA. RNA–DNA overlap: somatic mutations detected in both RNA and DNA. RNA-only: RNA somatic mutations without any DNA evidence.
FIGURE 4
FIGURE 4
Multi-filtering strategy and machine-learning model performance in testing and validation datasets. (A) Loss of GDC mutations (true positive) and non-GDC mutations after the removal of multiallelic, RNA-editing, immunoglobulin, and HLA sites. (B) Change in cross-validated F1 score with the number of features decreasing using the Recursive Feature Elimination with Cross-Validation (RFECV) method. Initial number of features was 40 and each iteration removed one least important feature. (C) P–R (blue) curve for the testing dataset. RNA-SSNV achieved 0.880 precision and 0.884 recall rate (red point) in the testing dataset under the default 0.5 threshold. RNA-Mutect (green point) and RF-RNAmut (orange point) had reported precision–recall with 0.87–0.72 and 0.85–0.71, respectively. (D) Probability distribution of the predicted scores for the testing dataset. Most somatic mutation records were at the upper or lower ends of the plot, conforming a clear classification boundary. (E) P–R curves for independent validation datasets. P–R curves for LUSC (blue), BLCA (orange), and GBM (green) had identical 0.94 AUC. The peaks meant slightly different P–R performances for our model using the default 0.5 threshold in three datasets: LUSC (0.872–0.894), BLCA (0.876–0.870), and GBM (0.902–0.825). P–Rs for RNA-Mutect and RF-RNAmut were also used for comparison. (F) Precision and recall distribution for each case across three types of cancer (LUSC, BLCA, and GBM). Box plots showed median, 25th and 75th quantiles, outliers were presented as dots. (G) Relative importance distribution for each feature. Gini impurity-based feature importance values were normalized to sum to one.
FIGURE 5
FIGURE 5
Evaluation of RNA somatic mutations and integrative analysis with DNA evidence. (A) Distribution of RNA expression ratios for known DNA somatic mutations across three types of cancer. Box plots’ heights ranged from 0.000 to 0.632. The comparisons utilized two-sided independent t-test with p-value < 1e-5. (B) Distributions of seven pathogenicity prediction scores for missense mutations within cancer driver genes across three cancer types (LUSC, BLCA, and GBM). DNA-only and RNA–DNA overlap parts in each cancer type were used for comparison (all comparisons passed two-sided independent t-test with p-value < 1e-5). (C) Variant allele fraction (VAF) distributions of DNA-only and RNA–DNA overlap parts within three cancer types. Left box: VAF distribution for DNA somatic mutations in DNA-only part. Middle box: VAF distribution for DNA somatic mutations in the RNA–DNA-overlap part. Right box: VAF distribution for RNA somatic mutations in the RNA–DNA-overlap part. The comparisons utilized two-sided independent t-test with p-value < 1e-5. (D) TPM fold change (FC) distributions for BLCA and LUSC. The comparisons utilized the Wilcoxon rank-sum test with p-value < 1e-5.

Similar articles

Cited by

References

    1. Adzhubei I. A., Schmidt S., Peshkin L., Ramensky V. E., Gerasimova A., Bork P. (2010). A Method and Server for Predicting Damaging Missense Mutations. Nat. Methods. 7(4), 248–249. 10.1038/nmeth0410-248 - DOI - PMC - PubMed
    1. Ainscough B. J., Griffith M., Coffman A. C., Wagner A. H., Kunisaki J., Choudhary M. N., et al. (2016). DoCM: A Database of Curated Mutations in Cancer. [Letter; Research Support, N.I.H., Extramural]. Nat. Methods. 13 (10), 806–807. 10.1038/nmeth.4000 - DOI - PMC - PubMed
    1. Alam H., Tang M., Maitituoheti M., Dhar S. S., Kumar M., Han C. Y., et al. (2020). KMT2D Deficiency Impairs Super-enhancers to Confer a Glycolytic Vulnerability in Lung Cancer. Cancer Cell 37 (4), 599–617. 10.1016/j.ccell.2020.03.005 - DOI - PMC - PubMed
    1. Aran D., Sirota M., Butte A. J. (2015). Systematic Pan-Cancer Analysis of Tumour Purity. Nat. Commun. 6 (1). 10.1038/ncomms9971 - DOI - PMC - PubMed
    1. Ardeshir-Larijani F., Bhateja P., Lipka M. B., Sharma N., Fu P., Dowlati A. (2018). KMT2D Mutation Is Associated with Poor Prognosis in Non–small-cell Lung Cancer. Clin. Lung Cancer. 19 (4), e489–e501. 10.1016/j.cllc.2018.03.005 - DOI - PubMed