. 2020 Mar;4(1):1.
doi: 10.1145/3381014. Epub 2020 Mar 18.

FluSense: A Contactless Syndromic Surveillance Platform for Influenza-Like Illness in Hospital Waiting Areas

Affiliations

FluSense: A Contactless Syndromic Surveillance Platform for Influenza-Like Illness in Hospital Waiting Areas

Forsad Al Hossain et al. Proc ACM Interact Mob Wearable Ubiquitous Technol. 2020 Mar.

Abstract

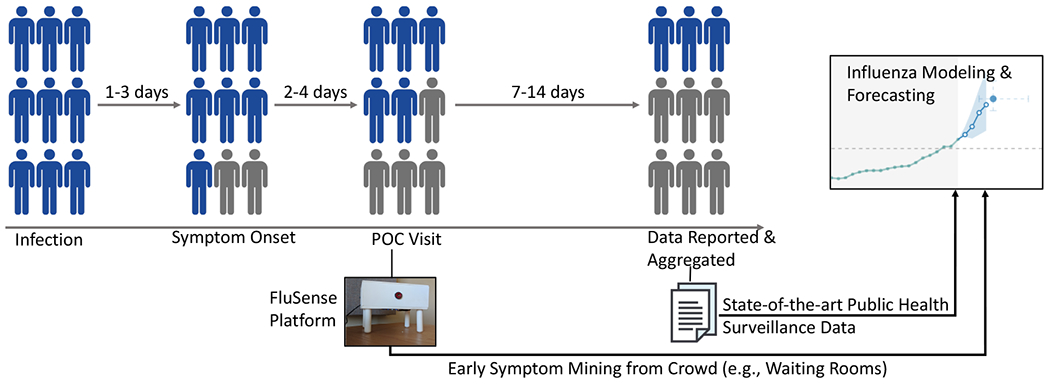
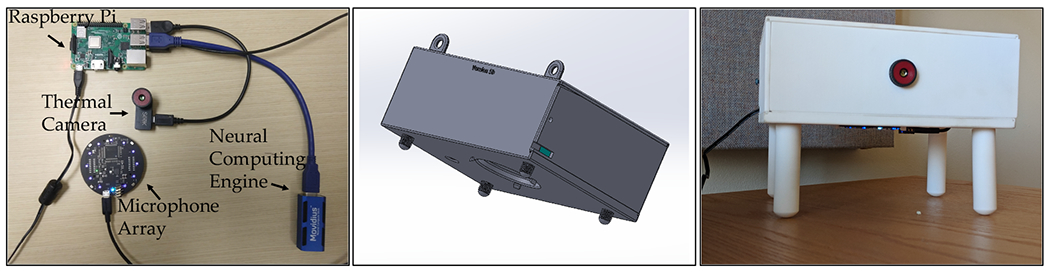
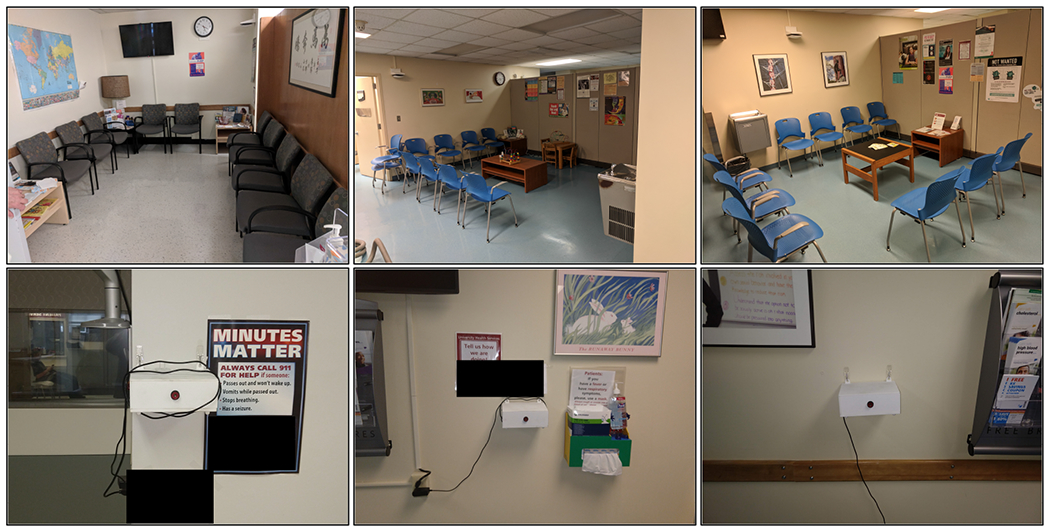
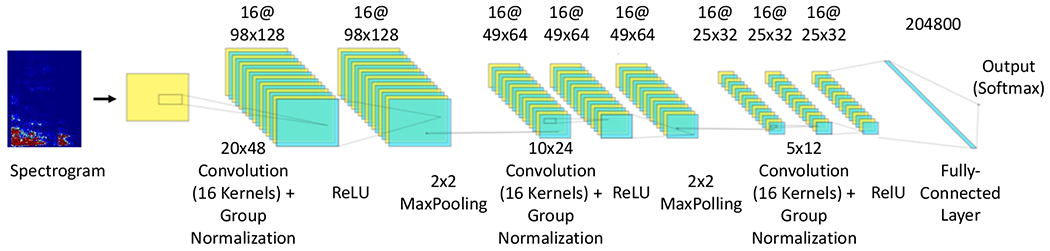
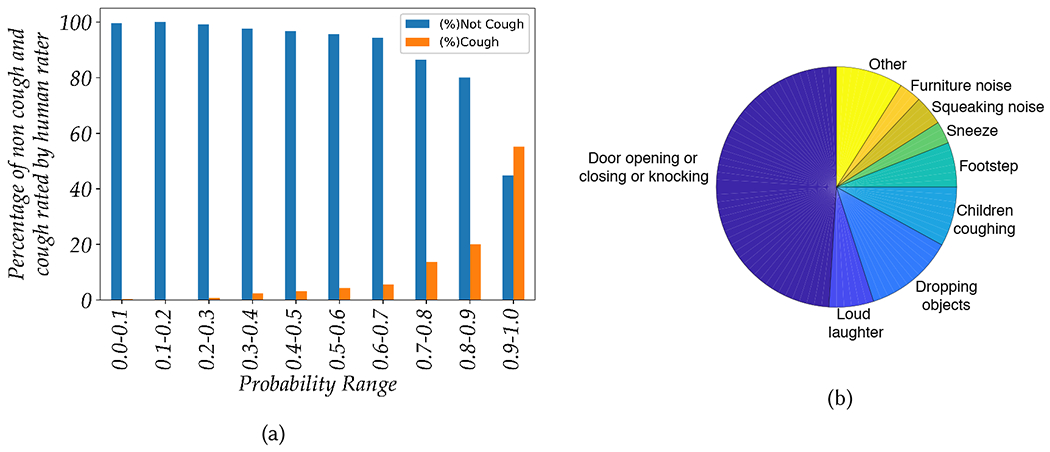
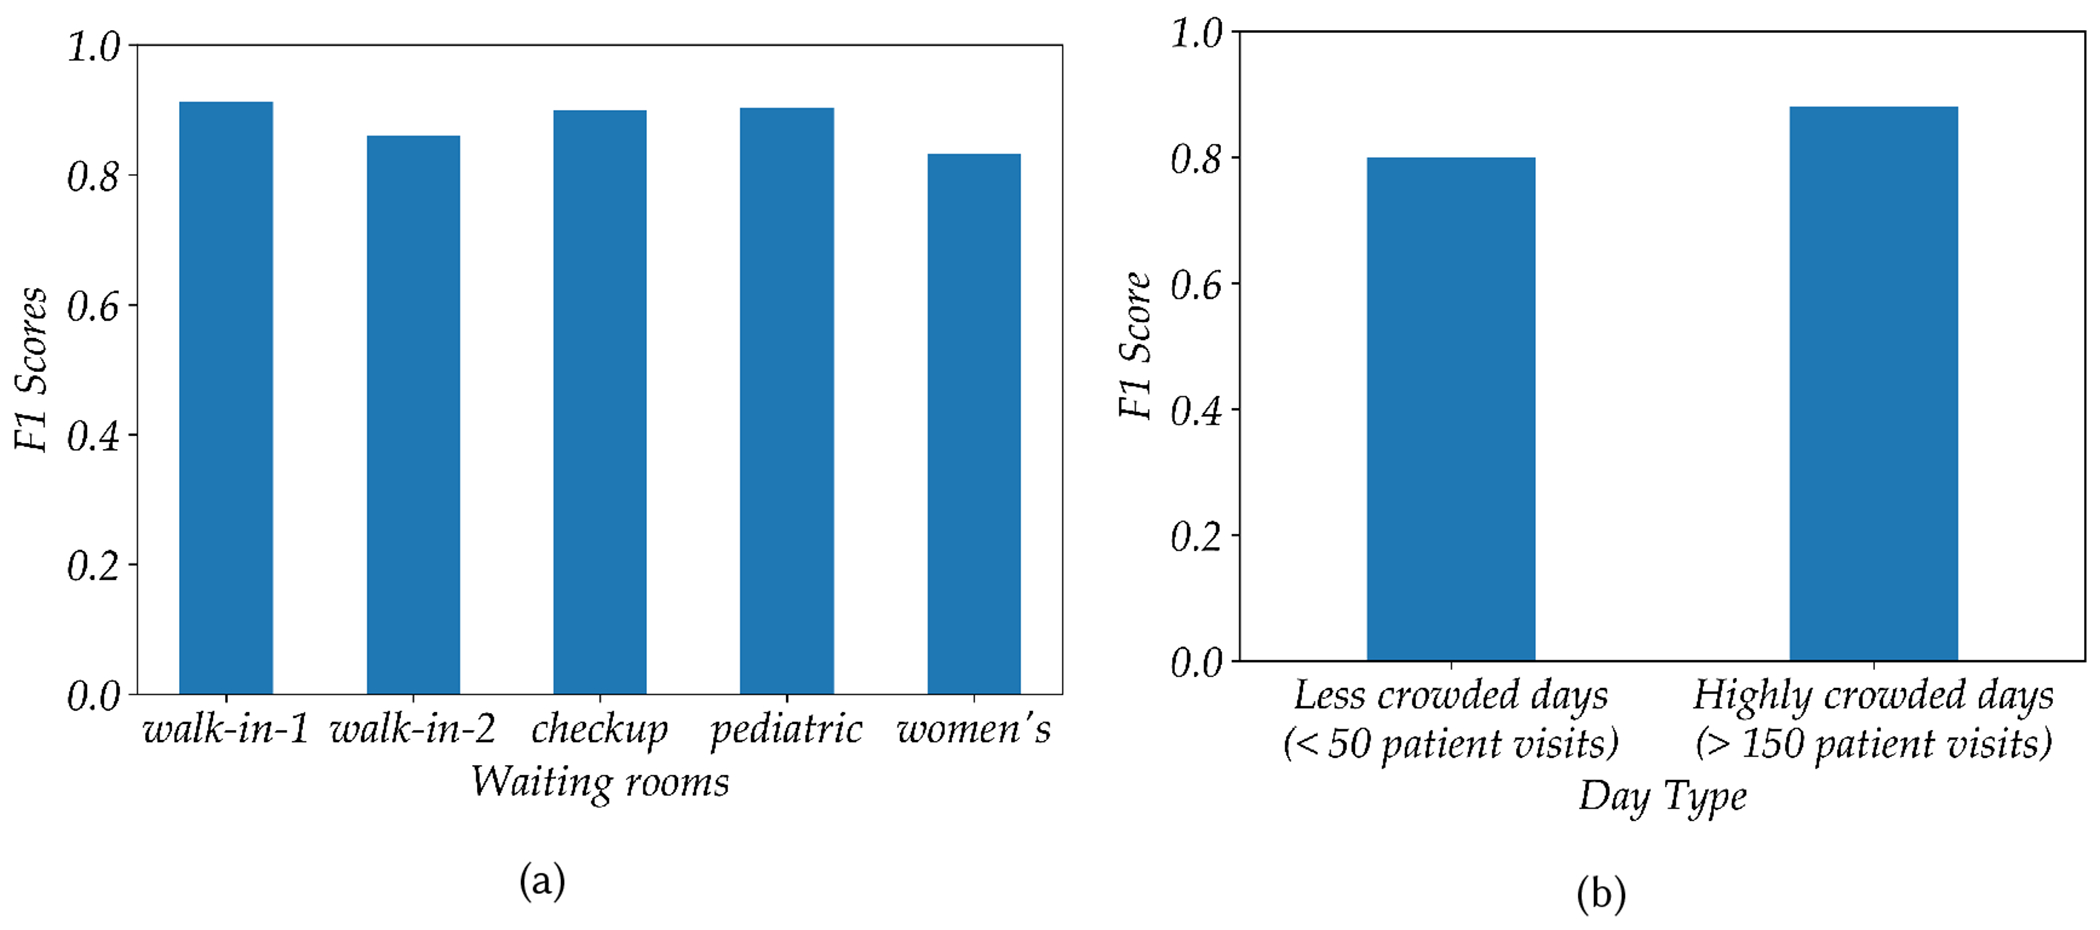
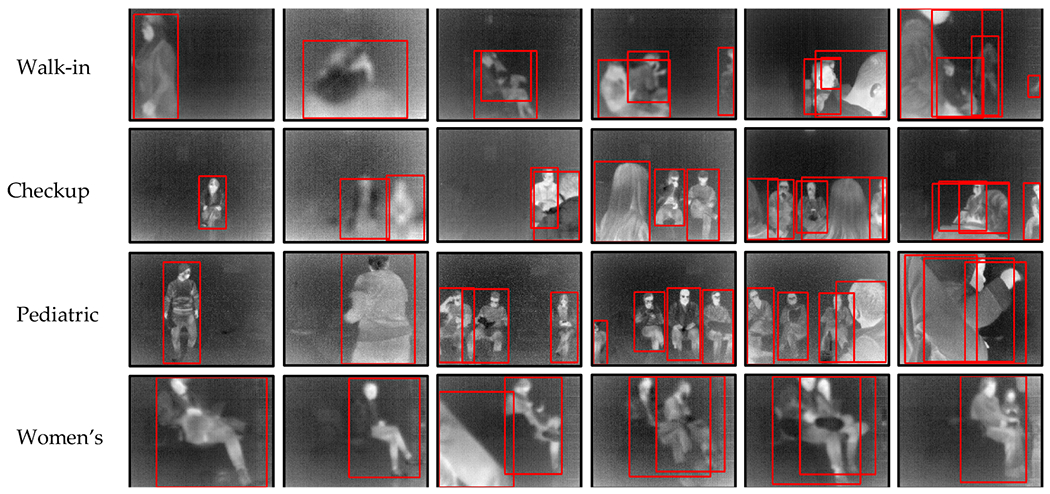
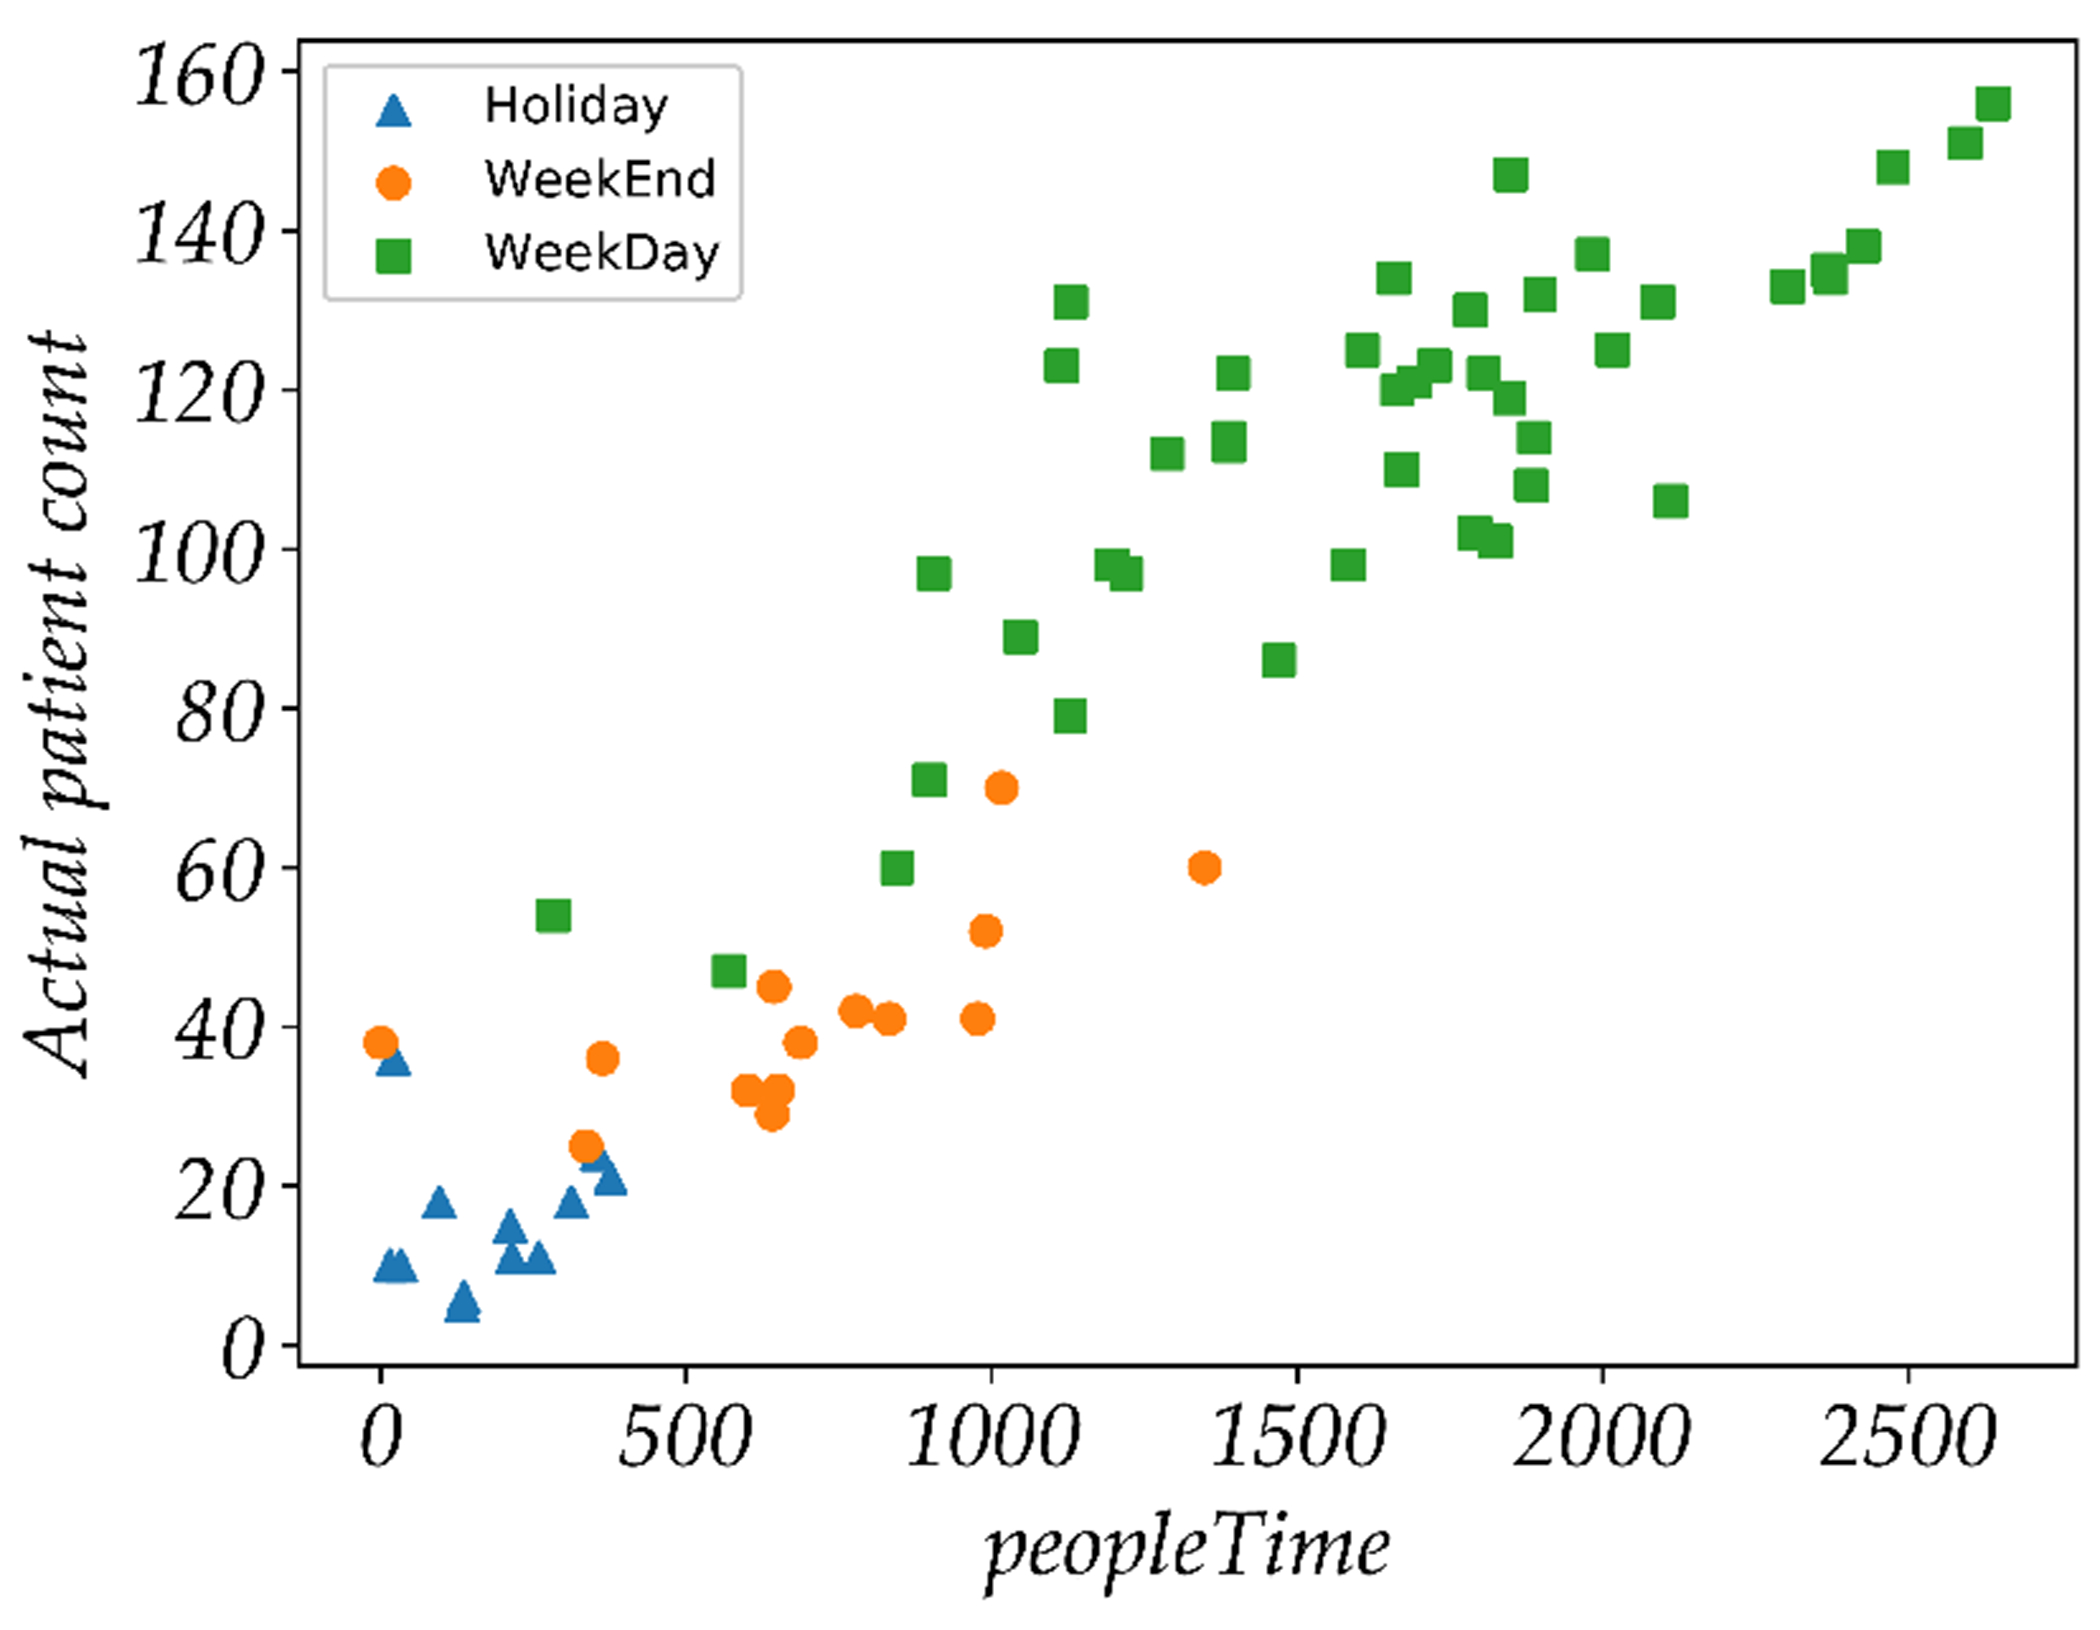
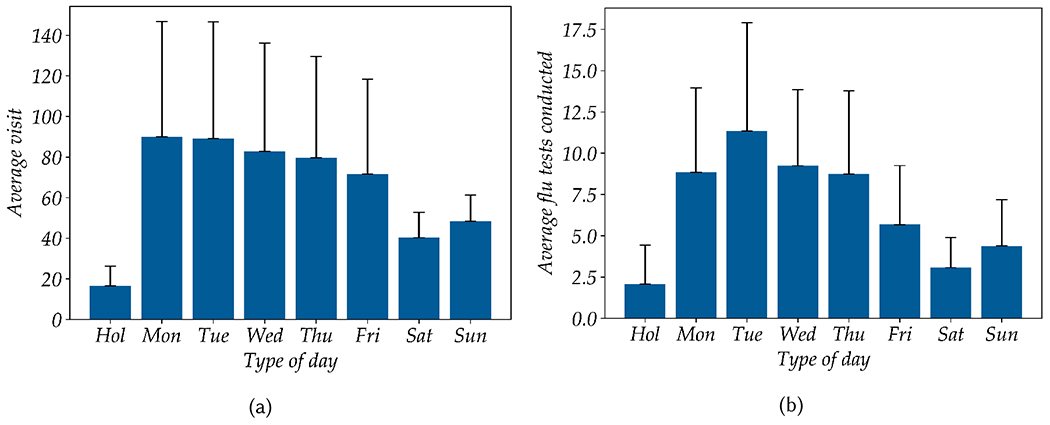
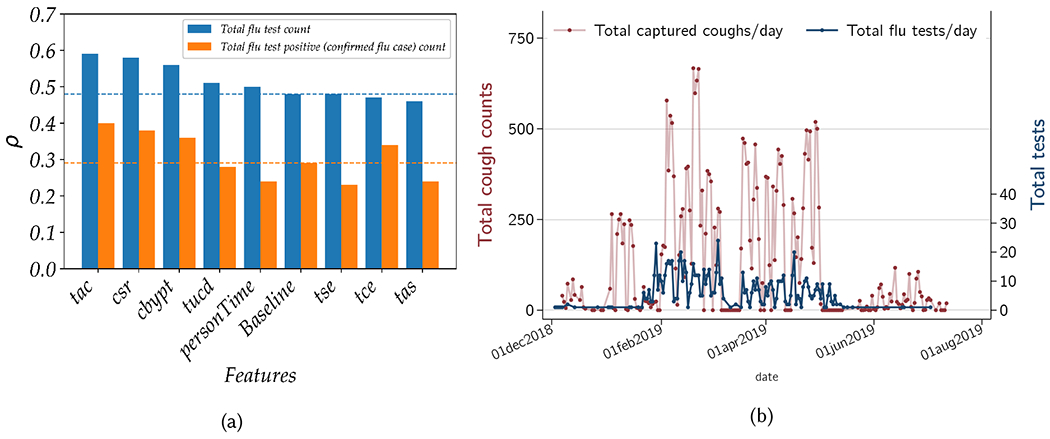
We developed a contactless syndromic surveillance platform FluSense that aims to expand the current paradigm of influenza-like illness (ILI) surveillance by capturing crowd-level bio-clinical signals directly related to physical symptoms of ILI from hospital waiting areas in an unobtrusive and privacy-sensitive manner. FluSense consists of a novel edge-computing sensor system, models and data processing pipelines to track crowd behaviors and influenza-related indicators, such as coughs, and to predict daily ILI and laboratory-confirmed influenza caseloads. FluSense uses a microphone array and a thermal camera along with a neural computing engine to passively and continuously characterize speech and cough sounds along with changes in crowd density on the edge in a real-time manner. We conducted an IRB-approved 7 month-long study from December 10, 2018 to July 12, 2019 where we deployed FluSense in four public waiting areas within the hospital of a large university. During this period, the FluSense platform collected and analyzed more than 350,000 waiting room thermal images and 21 million non-speech audio samples from the hospital waiting areas. FluSense can accurately predict daily patient counts with a Pearson correlation coefficient of 0.95. We also compared signals from FluSense with the gold standard laboratory-confirmed influenza case data obtained in the same facility and found that our sensor-based features are strongly correlated with laboratory-confirmed influenza trends.

Keywords: Contactless Sensing; Crowd Behavior Mining; Edge Computing; Influenza Surveillance.


Figures

Fig. 11.
Fig. 11.
shows the system benchmarking in terms of (a) throughput and (b) power consumption for the proposed platform.
Fig. 12.
Fig. 12.
(a) shows the DOA estimation error by the microphone array. (b) shows the Total Unique Cough DOAs (tucd) feature estimation when six persons are coughing (referred as A-F) over a period of time.
Fig. 1.
Fig. 1.
Comparison of target populations and reporting delays in the proposed contactless syndromic surveillance platform FluSense versus current public health surveillance. FluSense could capture ILI symptom-related information 7-14 days earlier than the current ILI surveillance mechanisms.
Fig. 2.
Fig. 2.
Illustration of electronic components (left) the 3D mechanical design of the sensor box/enclosure (middle) and the deployed FluSense platform (right).
Fig. 3.
Fig. 3.
illustrates the deployment of the contactless sensing platform in different hospital waiting areas (i.e., women’s clinic, pediatric clinic, and checkup clinic waiting areas from left to right).
Fig. 4.
Fig. 4.
illustrates the architecture of the CNN-based cough recognition algorithm.
Fig. 5.
Fig. 5.
(a) Overall proportion cough and non-cough sounds manually labeled by a human rater using decile probability bins from the cough model (Model 6) before transfer learning, (b) Distribution of audio events that produced false positive and false negative errors from Model 6 before transfer learning.
Fig. 6.
Fig. 6.
(a) Performance of the cough model (after transfer learning) in different waiting areas in terms of F1 score. (b) Performance of the cough model for highly crowded vs less crowded days
Fig. 7.
Fig. 7.
Sample thermal images collected in different waiting rooms (with one room per column column) and the inferred bounding boxes provided by our thermal imaging model. The last row illustrates situations where our thermal model performs sub-optimally.
Fig. 8.
Fig. 8.
Relationship between personTime and actual daily patient count.
Fig. 9.
Fig. 9.
Distribution of total daily patient visits (a) and total flu test counts (b) over holidays (Hol), weekdays (Mon-Fri), and weekends (Sat-Sun). Each bar represent the mean value, with the thin black line represents one standard deviation.
Fig. 10.
Fig. 10.
Depiction of (a) the performance (measured via Pearson correlation coefficient ρ) of different daily total flu test and total test positive count regression models trained on different feature groups and (b) comparison of total cough counts captured by our device vs the total patient load with ILI, by day.

References

    1. [n. d.]. ETSI Binaural sound database. https://docbox.etsi.org/stq/Open/TS103224BackgroundNoiseDatabase/Binaural. ([n. d.]).
    1. [n. d.]. Incidence rate. https://wiki.ecdc.europa.eu/fem/w/wiki/incidence-rate.
    1. [n. d.]. Intel Neural Compute Stick 2. https://software.intel.com/en-us/neural-compute-stick. ([n. d.]).
    1. Achrekar Harshavardhan, Gandhe Avinash, Lazarus Ross, Yu Ssu-Hsin, and Liu Benyuan. 2011. Predicting flu trends using twitter data. In 2011 IEEE conference on computer communications workshops (INFOCOM WKSHPS). IEEE, 702–707.
    1. Althouse Benjamin M, Ng Yih Yng, and Cummings Derek AT. 2011. Prediction of dengue incidence using search query surveillance. PLoS neglected tropical diseases 5, 8 (2011), e1258. - PMC - PubMed

LinkOut - more resources