

Vascular Endothelial Growth Factor Receptor-1 Modulates Hypoxia-Mediated Endothelial Senescence and Cellular Membrane Stiffness via YAP-1 Pathways
- PMID: 35846360
- PMCID: PMC9283904
- DOI: 10.3389/fcell.2022.903047
Vascular Endothelial Growth Factor Receptor-1 Modulates Hypoxia-Mediated Endothelial Senescence and Cellular Membrane Stiffness via YAP-1 Pathways
Abstract
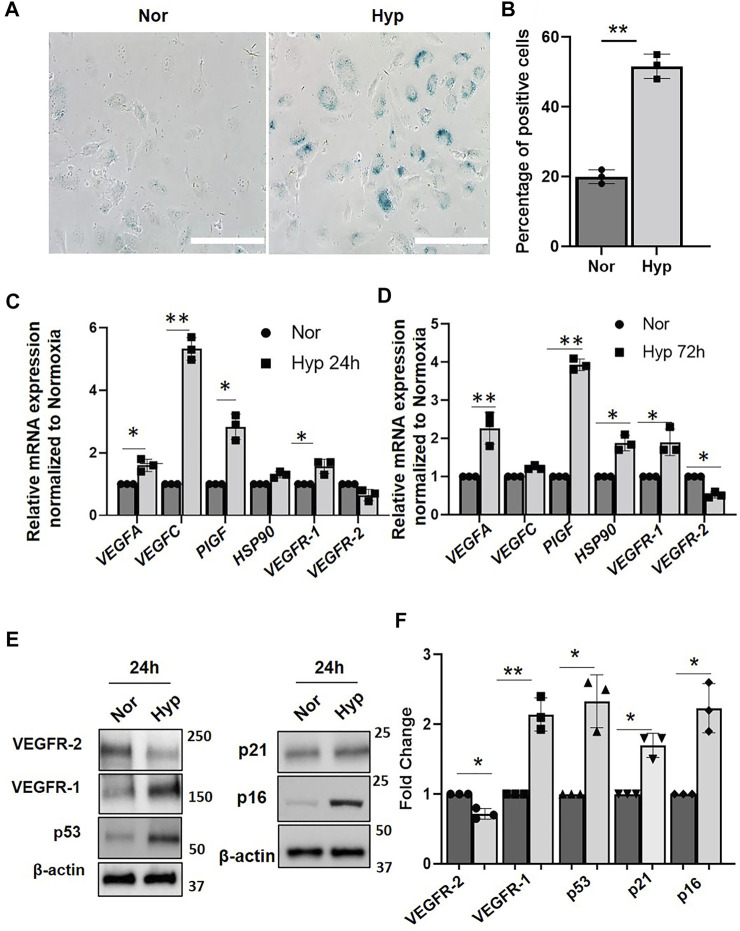
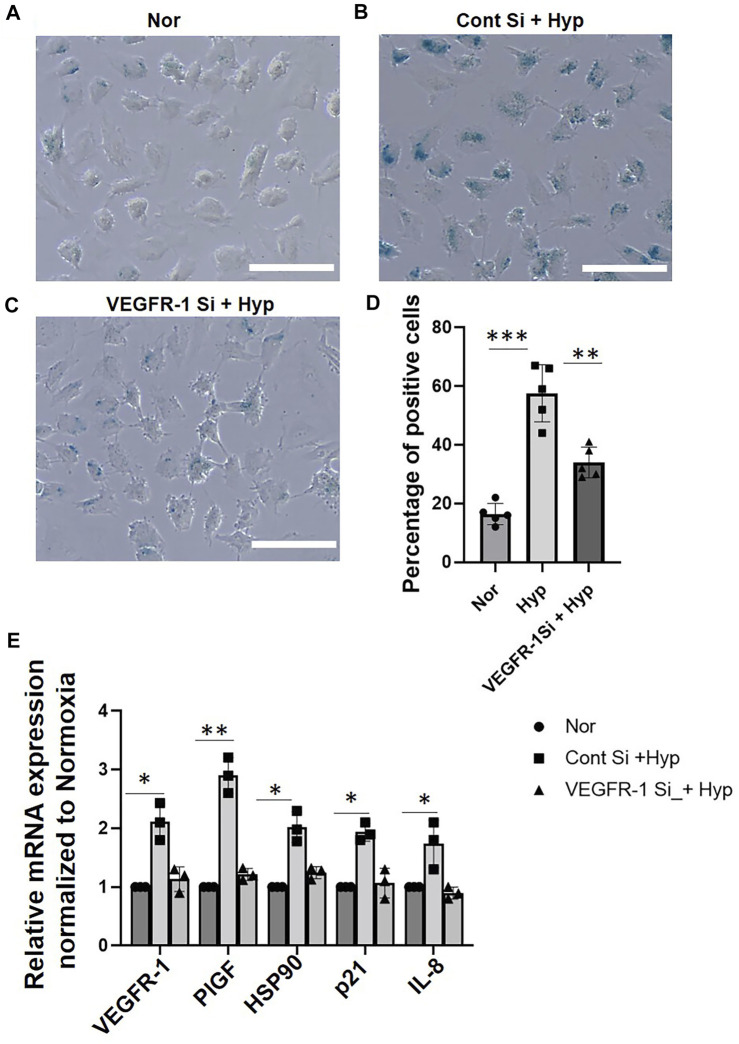
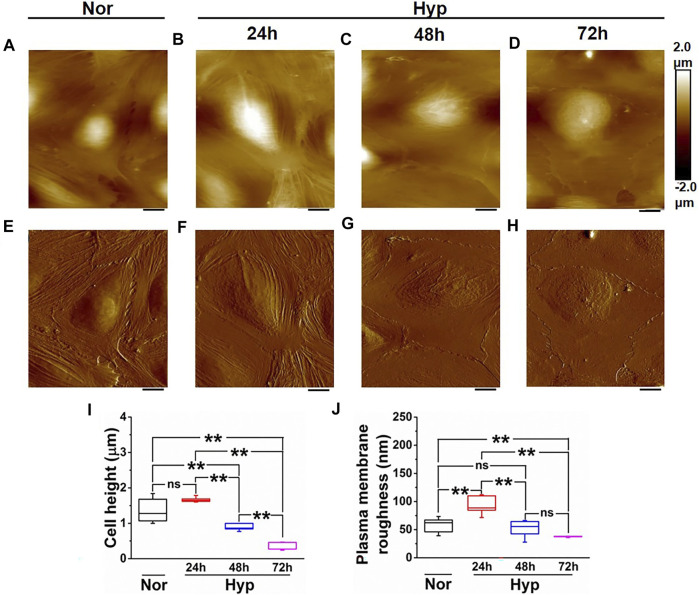
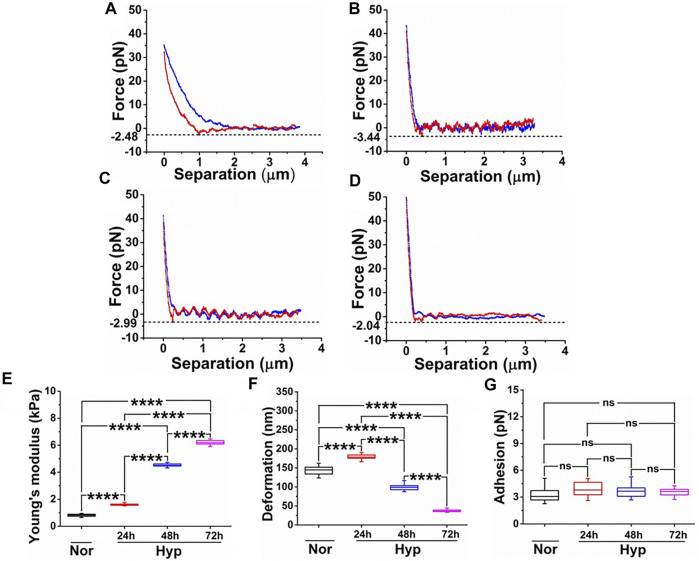
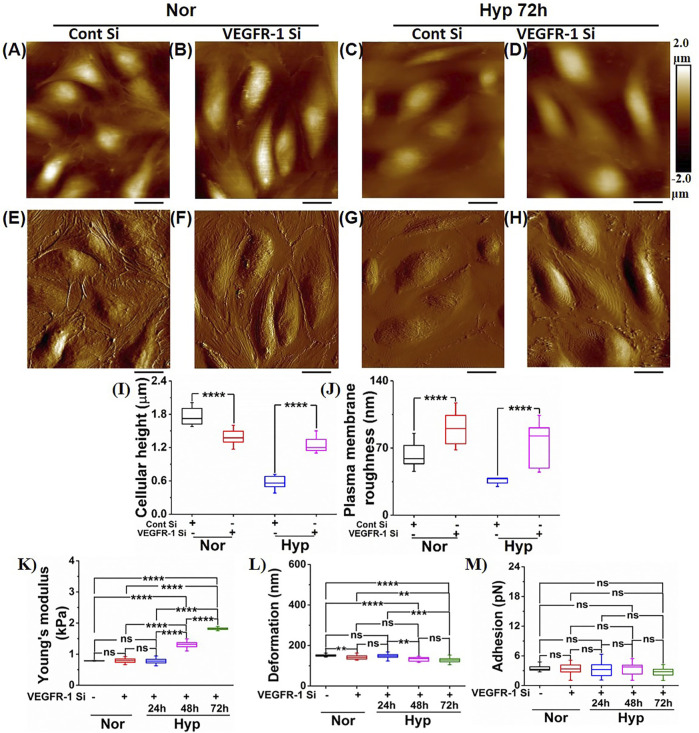
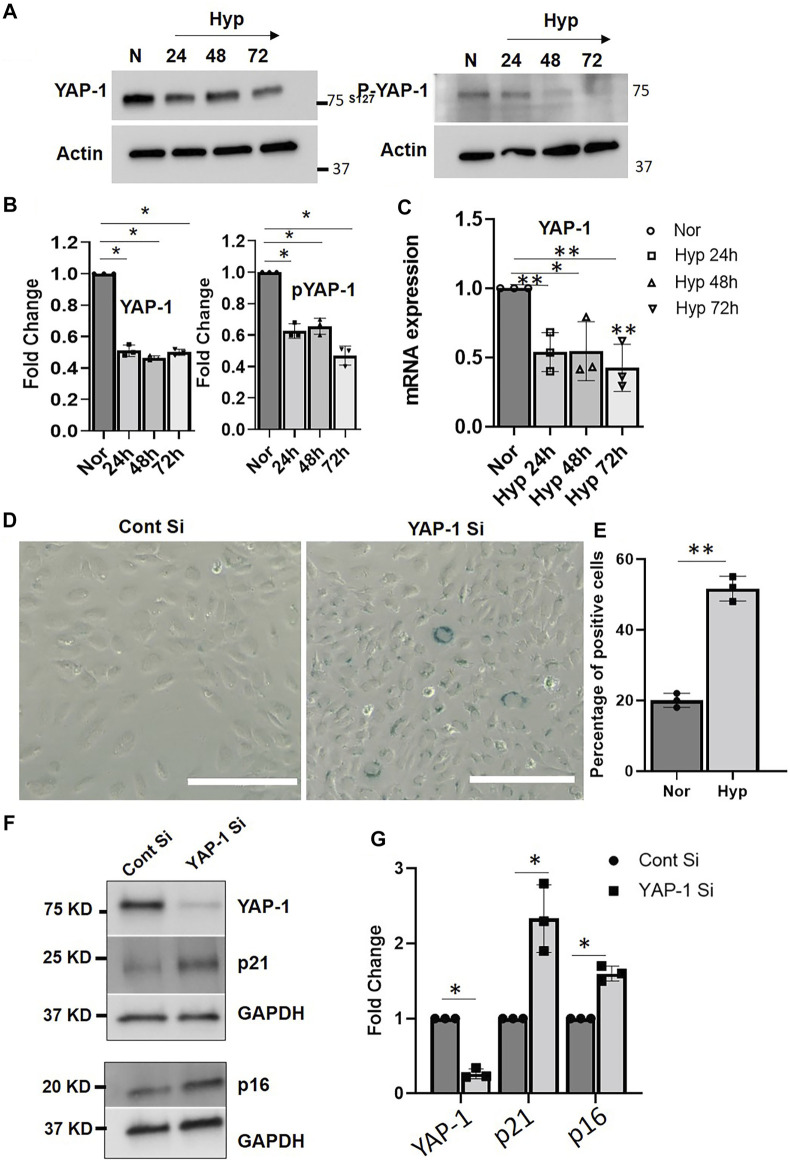
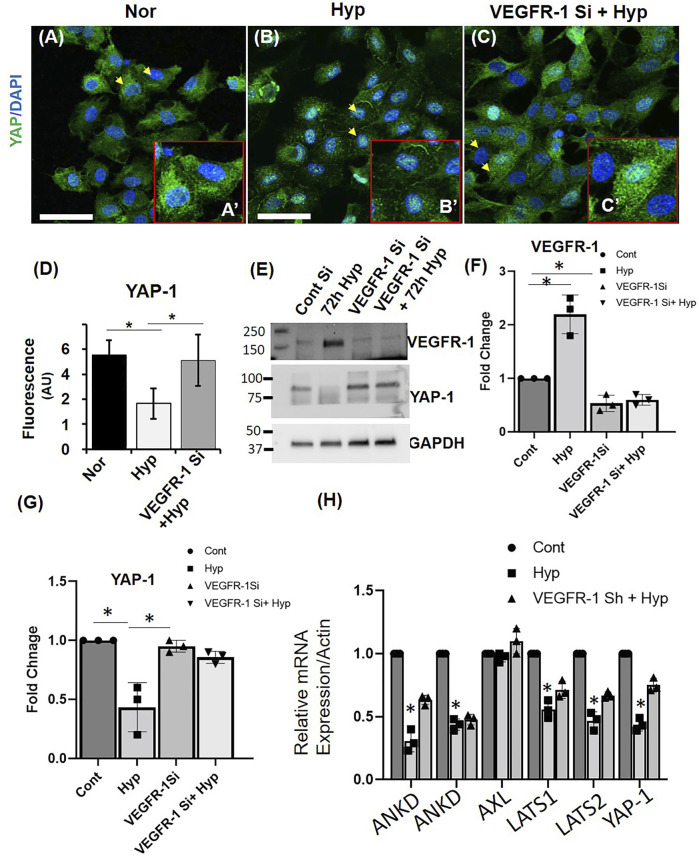
Hypoxia-induced endothelial cell (EC) dysfunction has been implicated as potential initiators of different pathogenesis, including Alzheimer's disease and vascular dementia. However, in-depth structural, mechanical, and molecular mechanisms leading to EC dysfunction and pathology need to be revealed. Here, we show that ECs exposed to hypoxic conditions readily enter a senescence phenotype. As expected, hypoxia upregulated the expression of vascular endothelial growth factor (VEGFs) and its receptors (VEGFRs) in the ECs. Interestingly, Knockdown of VEGFR-1 expression prior to hypoxia exposure prevented EC senescence, suggesting an important role of VEGFR-1 expression in the induction of EC senescence. Using atomic force microscopy, we showed that senescent ECs had a flattened cell morphology, decreased membrane ruffling, and increased membrane stiffness, demonstrating unique morphological and nanomechanical signatures. Furthermore, we show that hypoxia inhibited the Hippo pathway Yes-associated protein (YAP-1) expression and knockdown of YAP-1 induced senescence in the ECs, supporting a key role of YAP-1 expression in the induction of EC senescence. And importantly, VEGFR-1 Knockdown in the ECs modulated YAP-1 expression, suggesting a novel VEGFR-1-YAP-1 axis in the induction of hypoxia-mediated EC senescence. In conclusion, VEGFR-1 is overexpressed in ECs undergoing hypoxia-mediated senescence, and the knockdown of VEGFR-1 restores cellular structural and nanomechanical integrity by recovering YAP-1 expression.
Keywords: atomic force microscopy; endothelial cells; hippo pathway; hypoxia; nano mechanics; senescence.
Copyright © 2022 Angom, Kulkarni, Wang, Kumar Dutta, Bhattacharya, Das and Mukhopadhyay.
Conflict of interest statement
The authors declare that the research was conducted in the absence of any commercial or financial relationships that could be construed as a potential conflict of interest.
Figures
Similar articles
-
VEGF receptor-1 modulates amyloid β 1-42 oligomer-induced senescence in brain endothelial cells.FASEB J. 2019 Mar;33(3):4626-4637. doi: 10.1096/fj.201802003R. Epub 2018 Dec 21. FASEB J. 2019. PMID: 30576228 Free PMC article.
-
UFMylation maintains YAP stability to promote vascular endothelial cell senescence.iScience. 2025 Jan 21;28(2):111854. doi: 10.1016/j.isci.2025.111854. eCollection 2025 Feb 21. iScience. 2025. PMID: 39991547 Free PMC article.
-
Nanomechanical insights: Amyloid beta oligomer-induced senescent brain endothelial cells.Biochim Biophys Acta Biomembr. 2019 Dec 1;1861(12):183061. doi: 10.1016/j.bbamem.2019.183061. Epub 2019 Sep 9. Biochim Biophys Acta Biomembr. 2019. PMID: 31513781 Free PMC article.
-
Factors and Pathways Modulating Endothelial Cell Senescence in Vascular Aging.Int J Mol Sci. 2022 Sep 4;23(17):10135. doi: 10.3390/ijms231710135. Int J Mol Sci. 2022. PMID: 36077539 Free PMC article. Review.
-
New insights on the role of vascular endothelial growth factor in biliary pathophysiology.JHEP Rep. 2021 Feb 4;3(3):100251. doi: 10.1016/j.jhepr.2021.100251. eCollection 2021 Jun. JHEP Rep. 2021. PMID: 34151244 Free PMC article. Review.
Cited by
-
Surface Chemistry of Gold Nanoparticles Modulates Cytokines and Nanomechanical Properties in Pancreatic Cancer Cell Lines: A Correlative Study.Fortune J Health Sci. 2024;7(1):112-127. doi: 10.26502/fjhs.170. Epub 2024 Mar 13. Fortune J Health Sci. 2024. PMID: 38706513 Free PMC article.
-
Rac1 GTPase Regulates the βTrCP-Mediated Proteolysis of YAP Independently of the LATS1/2 Kinases.Cancers (Basel). 2024 Oct 25;16(21):3605. doi: 10.3390/cancers16213605. Cancers (Basel). 2024. PMID: 39518045 Free PMC article.
-
Recent Insights into the Neurobiology of Alzheimer's Disease and Advanced Treatment Strategies.Mol Neurobiol. 2025 Feb;62(2):2314-2332. doi: 10.1007/s12035-024-04384-1. Epub 2024 Aug 5. Mol Neurobiol. 2025. PMID: 39102108 Review.
-
The Bidirectional Role of Hypoxia-Inducible Factor 1 Alpha in Vascular Dementia Caused by Chronic Cerebral Hypoperfusion.Mol Neurobiol. 2025 Aug;62(8):10398-10413. doi: 10.1007/s12035-025-04914-5. Epub 2025 Apr 9. Mol Neurobiol. 2025. PMID: 40205304 Review.
-
Primary human neutrophils and monocytes migrate along endothelial cell boundaries to optimize search efficiency under static in vitro conditions.Biol Open. 2025 May 15;14(5):bio061704. doi: 10.1242/bio.061704. Epub 2025 May 13. Biol Open. 2025. PMID: 40357751 Free PMC article.
References
-
- Barbee K. A., Davies P. F., Lal R. (1994). Shear Stress-Induced Reorganization of the Surface Topography of Living Endothelial Cells Imaged By Atomic Force Microscopy. Circulation res. 74 (1), 163–171. - PubMed
-
- Barinda A. J., Ikeda K., Nugroho D. B., Wardhana D. A., Sasaki N., Honda S., et al. (2020). Endothelial Progeria Induces Adipose Tissue Senescence and Impairs Insulin Sensitivity through Senescence Associated Secretory Phenotype. Nat. Commun. 11 (1), 1–13. 10.1038/s41467-020-14387-w - DOI - PMC - PubMed
LinkOut - more resources
Full Text Sources
Research Materials