. 2022 Jun 29:10:918760.
doi: 10.3389/fcell.2022.918760. eCollection 2022.

Role of Nuclear Lamin A/C in the Regulation of Nav1.5 Channel and Microtubules: Lesson From the Pathogenic Lamin A/C Variant Q517X

Affiliations

Role of Nuclear Lamin A/C in the Regulation of Nav1.5 Channel and Microtubules: Lesson From the Pathogenic Lamin A/C Variant Q517X

Roberta De Zio et al. Front Cell Dev Biol. .

Abstract

In this work, we studied an lmna nonsense mutation encoding for the C-terminally truncated Lamin A/C (LMNA) variant Q517X, which was described in patients affected by a severe arrhythmogenic cardiomyopathy with history of sudden death. We found that LMNA Q517X stably expressed in HL-1 cardiomyocytes abnormally aggregates at the nuclear envelope and within the nucleoplasm. Whole-cell patch clamp experiments showed that LMNA Q517X-expressing cardiomyocytes generated action potentials with reduced amplitude, overshoot, upstroke velocity and diastolic potential compared with LMNA WT-expressing cardiomyocytes. Moreover, the unique features of these cardiomyocytes were 1) hyper-polymerized tubulin network, 2) upregulated acetylated α-tubulin, and 3) cell surface Nav1.5 downregulation. These findings pointed the light on the role of tubulin and Nav1.5 channel in the abnormal electrical properties of LMNA Q517X-expressing cardiomyocytes. When expressed in HEK293 with Nav1.5 and its β1 subunit, LMNA Q517X reduced the peak Na+ current (INa) up to 63% with a shift toward positive potentials in the activation curve of the channel. Of note, both AP properties in cardiomyocytes and Nav1.5 kinetics in HEK293 cells were rescued in LMNA Q517X-expressing cells upon treatment with colchicine, an FDA-approved inhibitor of tubulin assembly. In conclusion, LMNA Q517X expression is associated with hyper-polymerization and hyper-acetylation of tubulin network with concomitant downregulation of Nav1.5 cell expression and activity, thus revealing 1) new mechanisms by which LMNA may regulate channels at the cell surface in cardiomyocytes and 2) new pathomechanisms and therapeutic targets in cardiac laminopathies.

Keywords: arrhythmias; electrophysiology; lamin A/C; sodium channel; tubulin.


Conflict of interest statement

The authors declare that the research was conducted in the absence of any commercial or financial relationships that could be construed as a potential conflict of interest.

Figures
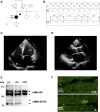
FIGURE 1
FIGURE 1
(A) Pedigree of the family carrying the LMNA Q517X pathogenic variant. The filled symbols indicate clinically affected individuals, the diagonal slashes indicate deceased individuals; +/− indicate positive/negative for the mutation; the arrow indicates the index patient. (B) ECG data from index patient showing sinus rhythm, first-degree atrioventricular block (upper trace), and type 1 second-degree atrioventricular block (lower trace) recorded during a 24-h ECG monitoring. (C) Apical 4C views of echocardiographic imaging from index patient showing a spherical, severely dilated, and markedly hypocontractile left ventricle. (D) In the PLAX view of echocardiographic imaging from index patient, showing a highly dilated left atrium. (E) Western blot analysis of whole lysate of left atrium (PA) and (PV) ventricular myocardial tissue from the mutant carrier (black arrow in A) and control (CTR) heart biopsies. (F) Representative confocal immunofluorescence images of LMNA in heart biopsies from a control patient (CTR) and from the index patient (IP). ECG, electrocardiogram; PLAX view, parasternal long-axis view.
FIGURE 2
FIGURE 2
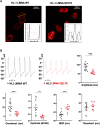
(A) Representative confocal immunofluorescence images of LMNA WT and Q517X in stably transfected HL-1 cardiomyocytes. The insets report the fluorescence distribution along the line (yellow line) crossing nuclei in each cell line. (B) Representative AP recordings by whole-cell patch clamp in the current clamp configuration in LMNA WT (black trace) and LMNA Q517X-expressing HL-1 cells (red trace) and scatter plots for the analysis of AP parameters in LMNA WT (black dots, N = 12) and LMNA Q517X-expressing HL-1 cells (red squares, N = 9); ***p < 0.001; **p < 0.01; Student’s t-test for unpaired data.
FIGURE 3
FIGURE 3
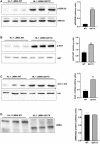
(A) Left panel: representative western blot of p-ERK1/2 and ERK1/2 in lysates from LMNA WT and LMNA Q517X-expressing HL-1 cells; right panel: normalized densitometric analysis of p-ERK1/2 immunoreactive bands in LMNA WT and Q517X-expressing HL-1 cells. (B) Left panel: representative western blot of p-AKT and AKT in lysates from LMNA WT and LMNA Q517X-expressing HL-1 cells; right panel: normalized densitometric analysis of p-AKT immunoreactive bands in LMNA WT and Q517X-expressing HL-1 cells. (C) Left panel: representative western blot of acetylated α-tubulin (acet α-tub) and α-tubulin (tub) in lysates from LMNA WT and LMNA Q517X-expressing HL-1 cells; right panel: normalized densitometric analysis of acetylated α-tubulin immunoreactive bands in LMNA WT and Q517X-expressing HL-1 cells. (D) Left panel: representative western blot of mCherry-tagged LMNA in lysates from LMNA WT and LMNA Q517X-expressing HL-1 cells; right panel: normalized densitometric analysis of m-Cherry tagged LMNA immunoreactive bands. The data are means of 3 independent experiments. ****p < 0.0001 ***p< =0.001; **p < 0.01; Student’s t test for unpaired data.
FIGURE 4
FIGURE 4
(A) Left panel: representative confocal laser immunofluorescence images in LMNA WT and LMNA Q517X-expressing HL-1 cells (in red LMNA, in green β-tubulin); right panel: region of interest (ROI) for tubulin fluorescence quantification in LMNA WT and Q517X-expressing HL-1 cells. N = 15 for each experimental condition. (B) Left panel: representative western blots of Nav1.5 α subunit in cell surface biotinylated proteins (biot-Nav1.5) and in cell lysates (Nav1.5) from LMNA WT and Q517X-expressing HL-1 cells; right panel: normalized densitometric analysis of biot-Nav 1.5 immunoreactive bands in LMNA WT and Q517X-expressing HL-1 cells. The data are means of 3 independent experiments. ****p < 0.0001; **p < 0.01; Student’s t test for unpaired data.
FIGURE 5
FIGURE 5
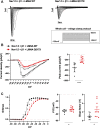
(A) Representative traces of inward Na+ currents evoked in HEK293 cells expressing either LMNA WT or LMNA Q517X, under 20s depolarizing steps from −90mV to +60 mV (with 5-mV increments) starting from an holding potential of −120 mV. (B) Left panel: current density (pA/pF)–voltage relationships (I–V curve) of the Na+ currents recorded for LMNA WT (black trace, N = 9), and LMNA Q517X-expressing HEK293 cells (red trace, N = 10); p < 0,0001 from −50 mV to −20 mV; p-value< 0.001 at F02D15 mV an −10 mV; p-value < 0,01 at −5 mV and p-value < 0,05 at 0 mV and 5 mV, two-way Anova. Right panel: scatter plot of the maximum peak sodium currents (pA/pF) for LMNA WT (black dots) and LMNA Q517X-expressing HEK293 cells (red squares); ***p < 0.001, Student’s t test for unpaired data). (C) Left panel: conductance voltage (G/Gmax) relationships of Na+ currents (G–V curve) obtained for LMNA WT (black trace, N = 9) and LMNA Q517X-expressing HEK293 cells (red trace, N = 10); p-value < 0,0001 at −50 mV and −45 mV; < 0.001 at −40 mV, two-way Anova. Right panel: scatter plots of the half-maximal conductance (V1⁄2) and the slope factors (K) in LMNA WT (black dots) or LMNA Q517X-expressing HEK293 cells (red squares), respectively; *p < 0.01 Student’s t test for unpaired data.
FIGURE 6
FIGURE 6
(A) Representative immunofluorescence confocal images of HL-1 cells expressing either LMNA WT or LMNA Q517X, the latter treated or not with colchicine (+colchi). (B) Left panel: representative western blot of acetylated α tubulin (acet α-tub) and total α tubulin (tub) in the absence (–) or the presence (+) of colchicine (colchi) in LMNA WT and LMNA Q517X-expressing HL-1 cells; right panel: normalized densitometric analysis of acetylated α-tubulin immunoreactive bands in all the experimental conditions shown in the left panel. (C) Left panel: representative western blot of cells surface biotinylated Nav1.5 (biot-Nav1.5) and Nav1.5 in cell lysates (Nav1.5) in the absence (–) or presence (+) of colchicine (colchi) in LMNA WT and LMNA Q517X-expressing HL-1 cells; right panel: normalized densitometric analysis of biot-Nav1.5 immunoreactive bands in all the experimental conditions shown in the left panel. The data are means of 3 independent experiments *p < 0.01, **p < 0.001, one-way Anova.
FIGURE 7
FIGURE 7
Representative AP recordings by whole-cell patch clamp in current clamp configuration in untreated (red traces) and colchicine-treated LMNA Q517X-expressing HL-1 cells (gray traces) and scatter plots for the analysis of AP parameters in untreated (red squares, N = 9) and colchicine-treated LMNA Q517X-expressing HL-1 cells (gray squares, N = 5). *p < 0.01, **p < 0.001, Student’s t test for unpaired data.
FIGURE 8
FIGURE 8
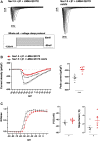
(A) Representative traces of inward Na+ currents evoked in untreated (Nav1.5 + β1 + LMNA Q517X) or colchicine-treated LMNA Q517X-expressing HEK293 cells (Nav1.5 + β1 + LMNA Q517X colchi). (B) Left panel: current density (pA/pF)–voltage relationships (I–V curve) of the Na+ currents recorded in untreated (red trace, N = 6), and colchicine-treated LMNA Q517X-expressing HEK293 cells (gray trace, N = 6); p-value < 0,0001 from −50 mV to −10 mV; p-value< 0.001 at −5 mV and at 0 mV; p-value < 0.01 at 5 mV and p-value < 0,05 at 10 mV and 15 mV, two-way Anova. Right panel: scatter plot of the maximum peak sodium currents (pA/pF) in untreated (red squares) and in colchicine-treated LMNA Q517X-expressing HEK293 cells (gray squares). (C) Left panel: conductance voltage (G/Gmax) relationships of Na+ currents (G–V curve) obtained for untreated (red trace, N = 6), and colchicine-treated LMNA Q517X-expressing HEK293 cells (gray trace, N = 6); p-value < 0.001 at −50 mV and at −45 mV, two-way Anova. Right panel: scatter plot of the half-maximal conductance (V1⁄2) and slope factors (K) in untreated (red squares) and in colchicine-treated LMNA Q517X-expressing HEK293 cells (gray squares); *p < 0.01; **p < 0.001, Student’s t test for unpaired data.

Similar articles

Cited by

References

    1. Arbustini E., Pilotto A., Repetto A., Grasso M., Negri A., Diegoli M., et al. (2002). Autosomal Dominant Dilated Cardiomyopathy with Atrioventricular Block: A Lamin A/C Defect-Related Disease. J. Am. Coll. Cardiol. 39, 981–990. 10.1016/s0735-1097(02)01724-2 - DOI - PubMed
    1. Borin D., Peña B., Chen S. N., Long C. S., Taylor M. R. G., Mestroni L., et al. (2020). Altered Microtubule Structure, Hemichannel Localization and Beating Activity in Cardiomyocytes Expressing Pathologic Nuclear Lamin A/C. Heliyon 6, e03175. 10.1016/j.heliyon.2020.e03175 - DOI - PMC - PubMed
    1. Carmosino M., Giménez I., Caplan M., Forbush B. (2008). Exon Loss Accounts for Differential Sorting of Na-K-Cl Cotransporters in Polarized Epithelial Cells. MBoC 19, 4341–4351. 10.1091/mbc.e08-05-0478 - DOI - PMC - PubMed
    1. Carmosino M., Torretta S., Procino G., Gerbino A., Forleo C., Favale S., et al. (2014). Role of Nuclear Lamin A/C in Cardiomyocyte Functions. Biol. Cell 106, 346–358. 10.1111/boc.201400033 - DOI - PubMed
    1. Carmosino M., Gerbino A., Schena G., Procino G., Miglionico R., Forleo C., et al. (2016). The Expression of Lamin A Mutant R321X Leads to Endoplasmic Reticulum Stress with Aberrant Ca2+ Handling. J. Cell. Mol. Med. 20, 2194–2207. 10.1111/jcmm.12926 - DOI - PMC - PubMed