. 2022 Jun 30:13:782033.
doi: 10.3389/fpsyg.2022.782033. eCollection 2022.

Can a Brief Interaction With Online, Digital Art Improve Wellbeing? A Comparative Study of the Impact of Online Art and Culture Presentations on Mood, State-Anxiety, Subjective Wellbeing, and Loneliness

Affiliations

Can a Brief Interaction With Online, Digital Art Improve Wellbeing? A Comparative Study of the Impact of Online Art and Culture Presentations on Mood, State-Anxiety, Subjective Wellbeing, and Loneliness

MacKenzie D Trupp et al. Front Psychol. .

Abstract

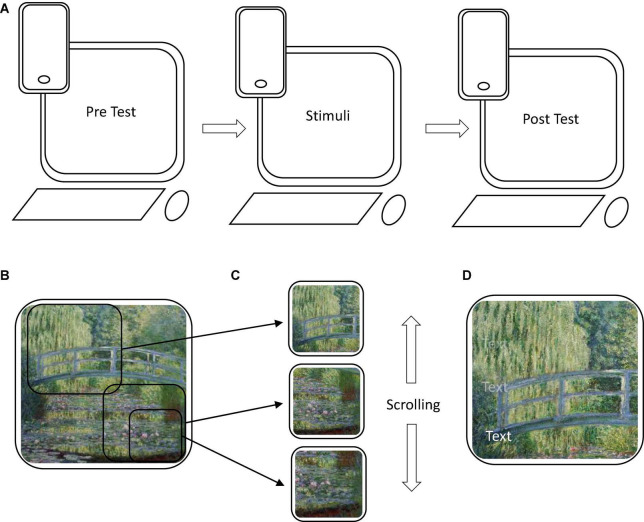
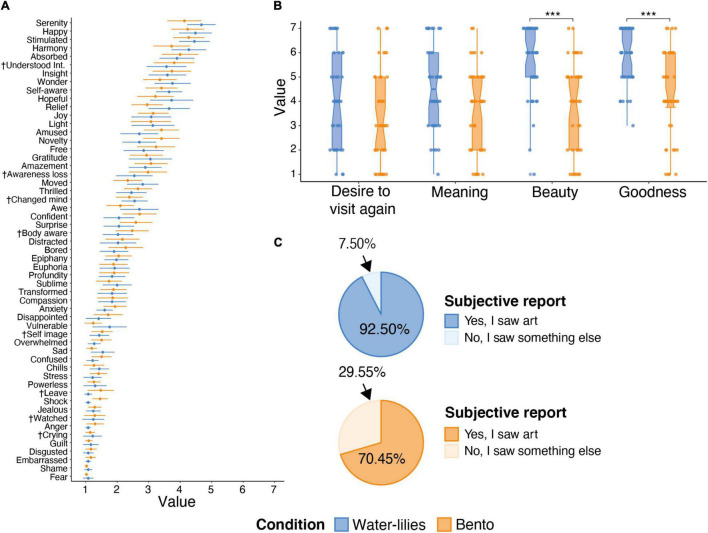
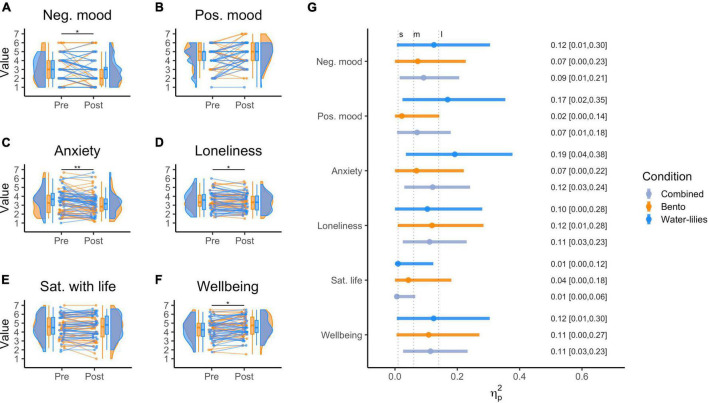
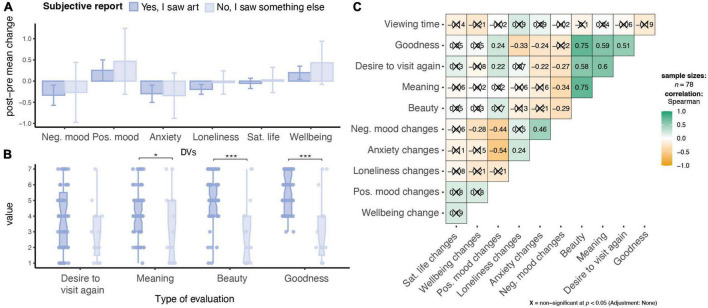
When experienced in-person, engagement with art has been associated-in a growing body of evidence-with positive outcomes in wellbeing and mental health. This represents an exciting new field for psychology, curation, and health interventions, suggesting a widely-accessible, cost-effective, and non-pharmaceutical means of regulating factors such as mood or anxiety. However, can similar impacts be found with online presentations? If so, this would open up positive outcomes to an even-wider population-a trend accelerating due to the current COVID-19 pandemic. Despite its promise, this question, and the underlying mechanisms of art interventions and impacts, has largely not been explored. Participants (N = 84) were asked to engage with one of two online exhibitions from Google Arts and Culture (a Monet painting or a similarly-formatted display of Japanese culinary traditions). With just 1-2 min exposure, both improved negative mood, state-anxiety, loneliness, and wellbeing. Stepdown analysis suggested the changes can be explained primarily via negative mood, while improvements in mood correlated with aesthetic appraisals and cognitive-emotional experience of the exhibition. However, no difference was found between exhibitions. We discuss the findings in terms of applications and targets for future research.

Keywords: art viewing; cultural engagement; digital art; mental health; receptive art engagement; wellbeing.


Conflict of interest statement

The authors declare that the research was conducted in the absence of any commercial or financial relationships that could be construed as a potential conflict of interest.

Figures

FIGURE 1
FIGURE 1
Study design, stimuli composition. (A) The procedure was a pre-post design which could be taken on both personal computers and smartphones. (B) Demonstration of stimuli showing “Waterlilies condition” as an example depicting Claude Monet, The Water-Lily Pond, 1899. (Oil on canvas, 88.3 × 93.1 cm. public domain image, Wikimedia commons). Stimuli from Google Arts and Culture were interactive, where smaller compositions of one main image (B) could be scrolled through (C) with accompanying text that faded away when scrolling down (D). Available from: https://commons.wikimedia.org/wiki/File:Water-Lilies-and-Japanese-Bridge-(1897-1899)-Monet.jpg.
FIGURE 2
FIGURE 2
(A) Shows means and 95% CI intervals for participants ratings of cognitive-emotional states during the online cultural engagements for the Water-lilies (light blue) and Bento (light orange) conditions. shorthand labels, see Supplementary Material for the complete labels. (B) Box plots showing the ratings for aesthetic evaluation for the Water-lilies and Bento conditions, showing that in general Water-lilies condition was rated more highly. (C) Pie chart showing percentages of participants who reported to see art or something else while engaging online with the Water-lilies and Bento conditions.
FIGURE 3
FIGURE 3
(A–F) Raincloud plots showing the distributions of rating pre and post online cultural experience grouped by condition. The boxplots display the median (horizontal line middle of box), the data within the 25th and the 75th percentile (inside box), and the data within the 10th to the 25th and the 75th to the 90th percentile (vertical line); Dots represent individual ratings; Slopes represent changes between pre and post. Images were computed following Langen’s tutorial (Allen et al., 2021; see https://github.com/jorvlan/raincloudplots); (G) forest plot of the effect sizes (partial eta square) of the online experience on the six DVs. Vertical dashed lines are used to indicate intervals to interpret the strength of the effect. S, M, L indicate small, medium, and large effect size intervals.
FIGURE 4
FIGURE 4
Subjective experience of participants, including (A) DV changes grouped by perception of if participants considered they say art or not, bar plots showing the breakdown of changes in Wellbeing DVs. Error bars represent 95% CI. (B) Box plots showing the breakdown of the aesthetic ratings grouped by subjective reports (i.e., seeing art), Error bars represent SD. *p < 0.05, ***p < 0.001. p-values uncorrected. (B) Appraisals shown broken down by I saw art or not. (C) Correlations between viewing time, appraisals and changes in Wellbeing DVs. Correlation plot was computed using ggstatplot (Patil, 2021).

References

    1. About Google Cultural Institute (2020). Bringing the World’s Art and Culture Online for Everyone. Available online at: https://about.artsandculture.google.com/ (accessed April 15, 2020).
    1. Adair J. G. (1984). The Hawthorne effect: a reconsideration of the methodological artifact. J. Appl. Psychol. 69 334–345. 10.1037/0021-9010.69.2.334 - DOI
    1. Alelis G., Bobrowicz A., Ang C. S. (2015). Comparison of engagement and emotional responses of older and younger adults interacting with 3D cultural heritage artefacts on personal devices. Behav. Inf. Technol. 34 1064–1078. 10.1080/0144929X.2015.1056548 - DOI
    1. Allen M., Poggiali D., Whitaker K., Marshall T. R., van Langen J., Kievit R. A. (2021). Raincloud plots: a multi-platform tool for robust data visualization. Wellc. Open Res. 4:63. 10.12688/wellcomeopenres.15191.2 - DOI - PMC - PubMed
    1. Ander E., Thomson L., Blair K., Noble G., Menon U., Lanceley A., et al. (2013). Using museum objects to improve wellbeing in mental health service users and neurological rehabilitation clients. Br. J. Occup. Ther. 76 208–216. 10.4276/030802213X13679275042645 - DOI - PubMed

LinkOut - more resources