. 2022 Jun 30:12:904606.
doi: 10.3389/fcimb.2022.904606. eCollection 2022.

Development of Bovine Gastric Organoids as a Novel In Vitro Model to Study Host-Parasite Interactions in Gastrointestinal Nematode Infections

Affiliations

Development of Bovine Gastric Organoids as a Novel In Vitro Model to Study Host-Parasite Interactions in Gastrointestinal Nematode Infections

Marc N Faber et al. Front Cell Infect Microbiol. .

Abstract

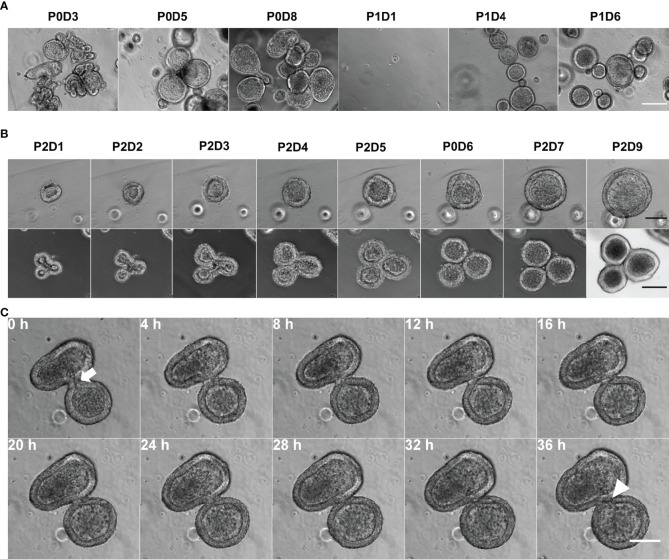
Gastro-intestinal nematode (GIN) parasites are a major cause of production losses in grazing cattle, primarily through reduced growth rates in young animals. Control of these parasites relies heavily on anthelmintic drugs; however, with growing reports of resistance to currently available anthelmintics, alternative methods of control are required. A major hurdle in this work has been the lack of physiologically relevant in vitro infection models that has made studying precise interactions between the host and the GINs difficult. Such mechanistic insights into the infection process will be valuable for the development of novel targets for drugs, vaccines, or other interventions. Here we created bovine gastric epithelial organoids from abomasal gastric tissue and studied their application as in vitro models for understanding host invasion by GIN parasites. Transcriptomic analysis of gastric organoids across multiple passages and the corresponding abomasal tissue showed conserved expression of tissue-specific genes across samples, demonstrating that the organoids are representative of bovine gastric tissue from which they were derived. We also show that self-renewing and self-organising three-dimensional organoids can also be serially passaged, cryopreserved, and resuscitated. Using Ostertagia ostertagi, the most pathogenic gastric parasite in cattle in temperate regions, we show that cattle gastric organoids are biologically relevant models for studying GIN invasion in the bovine abomasum. Within 24 h of exposure, exsheathed larvae rapidly and repeatedly infiltrated the lumen of the organoids. Prior to invasion by the parasites, the abomasal organoids rapidly expanded, developing a 'ballooning' phenotype. Ballooning of the organoids could also be induced in response to exposure to parasite excretory/secretory products. In summary, we demonstrate the power of using abomasal organoids as a physiologically relevant in vitro model system to study interactions of O. ostertagi and other GIN with bovine gastrointestinal epithelium.

Keywords: Ostertagia ostertagi; gastrointestinal; host-pathogen interactions; nematodes; three-dimensional (3D) organoids; tissue remodelling.


Conflict of interest statement

The authors declare that the research was conducted in the absence of any commercial or financial relationships that could be construed as a potential conflict of interest. This study received funding from Zoetis. The funder had the following involvement with the study: the decision to submit the manuscript for publication.

Figures

Figure 1
Figure 1
Establishment of in vitro bovine abomasum organoids. (A) Phase contrast images of bovine abomasum organoids during passage 0 and 1 (P0 and P1). Representative images were taken on indicated day DX of each passage. Scale bar = 200µm. (B) Growth of and development of representative passage 2 (P2) abomasal organoids from day 1 (D1) to day 9 (D9) following passage. Top panel shows phase contrast images and bottom panel shows differential interference contrast images of representative organoids. Scale bar = 100 µm. (C) Phase contrast time lapse of a budding organoid over 36h, with the shared luminal space (white arrow) closing off (white arrowhead). Scale bar = 100 µm.
Figure 2
Figure 2
Immunofluorescence and histological characterisation of passage 2 (P2) bovine abomasum at day 7 to day 9 (D7 – D9) of in vitro culture. (A) Representative immunofluorescence images of abomasum organoids stained with either the epithelial cell markers pan-cytokeratin (green) and EpCAM (green) or the cell proliferation marker Ki67 (green), in addition to F-actin (red) and Hoechst (blue). Final panel shows merge of green, red and blue channels. Images for each antibody staining were taken at a different focal plane. Scale bars = 50 µm. (B) Histological images of organoid sections stained with haematoxylin or eosin (HE) and Periodic Acid–Schiff (PAS). Organoid sections show the spherical structure of the bovine abomasum organoids with a central lumen. Example polarised columnar epithelial cells with the apical surface facing the organoid lumen are highlighted (black arrows) indicating the presence of the glycocalyx and/or mucus layer (white arrow). Some cells show epithelial cell layer, having larger nuclei and brighter cytoplasm (black arrowheads) or over smaller cell sizes (white arrowhead) indicating the presence of different cell types. Scale bars = 50 µm.
Figure 3
Figure 3
(A) Principal component analysis (PCA) of RNA-seq expression of the top 500 most variant genes in bovine abomasum tissue and abomasum organoids from three animals. Abomasum tissue and organoids we derived from Calf 1 (Aberdeen Angus; C1, purple), Calf 2 (Holstein-Friesian; C2, green), Calf 3 (Holstein-Friesian; C3, orange). Sample type, either tissue or organoid, and organoid passage number (passage 0 – 4; P0 – P4) are indicated in the figure. Ellipses indicate 95% confidence intervals for each cluster. (B) Heat map showing expression of representative genes (TMBIM6 and RPS9) in abomasum tissue and derived abomasum organoids over serial passage. Colours indicate level of expression from high (red) to low (blue). The read count data for (A) and (B) was normalised using the median of ratios method from the DESeq2 package.
Figure 4
Figure 4
Heat map showing expression level of top 50 most variant genes from bovine abomasum and ileum tissue, abomasum organoids. Abomasum tissue and organoids we derived from Calf 1 (Aberdeen Angus; C1) and Calf 2,3 (Holstein-Friesian; C2, C3). Organoids are from serial passage number (passage 0 – 4; P0 – P4) as indicated in the figure. Colours indicate level of expression from high (red) to low (blue). The read count data was normalised using the median of ratios method from the DESeq2 package. The dendrograms indicate similarity between samples and gene expression profiles. Details of genes included in the heat map, are shown in Supplemental File 1 .
Figure 5
Figure 5
Heat map showing the expression of genes associated with gastrointestinal epithelia. RNA-seq analysis was performed to compare gene expression in abomasal and intestinal tissue and respective organoids across multiple passages. For abomasum samples, expression data is grouped by animal (calf 1 – 3, C1 – C3) and includes abomasum tissue (A) and abomasum organoids over serial passage (passage 0 – 4; P0 – P4). For ileum samples, expression data is from ileum tissue (I) and organoids from passage 0 (P0) and passage 4 (P4). The data was normalised by log2 transformation of transcripts per million reads. Details of genes included in the heat map are shown in Supplemental File 1 .
Figure 6
Figure 6
Heat map showing the expression of gastric cell specific markers from abomasum, ileum tissue and derived organoids. RNA-seq analysis was performed to compare gene expression in abomasal and intestinal tissue and respective organoids across multiple passages. For abomasum samples, expression data is grouped by animal (calf 1 – 3, C1 – C3) and includes abomasum tissue (A) and abomasum organoids over serial passage (passage 0 – 4; P0 – P4). For ileum samples, expression data is from ileum tissue (I) and organoids from passage 0 (P0) and passage 4 (P4). The data was normalised by log2 transformation of transcripts per million reads. Details of genes included in the heat map are shown in Supplemental File 1 .
Figure 7
Figure 7
Ostertagia ostertagi invasion of bovine abomasal epithelial tissue and abomasum organoids after 24 h. (A) Hematoxylin and eosin (HE) stained section of a bovine abomasal gland infected with the parasitic nematode O. ostertagi at 21 days post infection. White arrowhead indicates the apical side of the gland epithelium, scale bar = 25 µm. (B) HE stained section of an exsheathed O. ostertagi exL3 inside the lumen of a passage 7 bovine abomasum organoid at 24 h post infection. White arrowhead indicates the apical side of the organoid epithelia, scale bar = 25 µm. (C) Z-stack of a bovine abomasum organoid infected with a single exsheathed O. ostertagi exL3 worm. Fluorescent labelling: O. ostertagi exL3 (red), F-actin (green) and Hoechst (blue). Scale bar = 50 µm. (D) Quantification of comparative invasion of exsheathed O. ostertagi L3 into naïve Matrigel™ domes and Matrigel™ domes containing bovine organoids after 72 h. Bar graph (grey) shows percentage of total worms successfully invaded into Matrigel™ dome without organoids (CTRL Dome) and Matrigel™ dome containing bovine abomasum organoids (Organoid Dome). Results are normalised to 100% of total worms added to each well, n=16, **p<0.01, Mann Whitney test). Bar graph (blue) shows the percentage of worms that enter the Matrigel™ dome that are found within the lumen of the bovine abomasum organoid.
Figure 8
Figure 8
Ostertagia ostertagi exL3 exiting a bovine abomasal abomasum organoid. (A) Composite and individual channels of a Z-stack of O. ostertagi penetrating the apical surface of the organoid epithelium. (B) Magnified Z-stack series of the nematode pushing aside epithelial cells during exiting the organoid, Z-stack increments are listed represent depth within the Z-stack. Fluorescent labelling: O. ostertagi exL3 (red), F-actin (green) and nuclear marker (blue). Panel (A), scale bar = 50 µm. Panel (B), scale bar = 10 µm.
Figure 9
Figure 9
Characterisation of a ballooning phenotype in bovine abomasum organoids upon exposure to Ostertagia ostertagi exL3 larvae and associated excretory-secretory products (ESP). (A) Light microscopy analysis of day 7 bovine abomasal organoids exposed to O. ostertagi L3 larvae over 23 h. Representative examples of organoids at the indicated time points are shown. Scale bar = 100 µm. (B) Representative experiment of day 7 bovine abomasal organoid expansion upon treatment with O. ostertagi L3 larvae over time. Normalised organoid surface area is shown relative to t = 0 (pre-worm exposure) and at 1 h intervals over 23 h following worm exposure. Control organoids (CTRL) were grown in parallel and not exposed to O. ostertagi exL3. Surface areas are expressed as percentages relative to that at t = 0 (100%). Data shows one experiment with n = 25 randomly selected organoids for both control (CTRL) and worm exposed organoids, with each data point showing mean ± standard error of the mean (SEM). (C) Representative images of control (top row) and exL3 exposed (bottom row) organoids fluorescently labelled for F-actin (red) and Hoechst (blue). Enlarged images show the stretching and reduced width of organoid epithelial layer (brackets). Scale bar: Left column = 50 µm, right column = 25 µm. (D) Representative light microscopy images of day 14 bovine abomasal organoids exposed to O. ostertagi exL3 larvae, larval products (ESP) or heat inactivated products (Hi-ES). Representative examples at the indicated time points are shown. Scale bar = 100 µm. (E) Representative experiment of day 14 bovine abomasal organoid expansion upon treatment with O. ostertagi L3 larvae and ES products over time. Normalised organoid surface area is shown relative to t = 0 (pre-worm exposure) and at one-hour intervals over 10 h following worm exposure to O. ostertagi exL3 (L3), ESPs and Hi-ES. Control organoids (CTRL) were grown in parallel and not exposed to O. ostertagi exL3. Surface areas are expressed as percentages relative to that at t = 0 (100%). Data shows one experiment with n = 25 randomly selected organoids replicate organoids for CTRL, L3, ESP and Hi-ESP exposed organoids, with each data point representing mean ± SEM. Surface areas, expressed as percentages relative to that at t = 0 (100%).

Similar articles

Cited by

References

    1. Albuquerque A. C. A., Bassetto C. C., Almeida F. A., Hildersley K. A., McNeilly T. N., Britton C., et al. . (2019). Differences in Immune Responses to Haemonchus Contortus Infection in the Susceptible Ile De France and the Resistant Santa Ines Sheep Under Different Anthelmintic Treatments Regimens. Vet. Res. 50, 104. doi: 10.1186/s13567-019-0722-3 - DOI - PMC - PubMed
    1. Barker N., Huch M., Kujala P., van de Wetering M., Snippert H. J., van Es J. H., et al. . (2010). Lgr5(+ve) Stem Cells Drive Self-Renewal in the Stomach and Build Long-Lived Gastric Units In Vitro . Cell Stem Cell 6, 25–36. doi: 10.1016/j.stem.2009.11.013 - DOI - PubMed
    1. Bartley D. J., Jewell N. J., Andrews L. M., Mitchell S., Morrison A. A. (2021). Molecular and Phenotypic Characterisation of Fenbendazole Resistance in a Field-Derived Isolate of Ostertagia Ostertagi. Vet. Parasitol. 289, 109319. doi: 10.1016/j.vetpar.2020.109319 - DOI - PubMed
    1. Beaumont M., Blanc F., Cherbuy C., Egidy G., Giuffra E., Lacroix-Lamandé S., et al. . (2021). Intestinal Organoids in Farm Animals. Veterinary Res. 52, 33. doi: 10.1186/s13567-021-00909-x - DOI - PMC - PubMed
    1. Borten M. A., Bajikar S. S., Sasaki N., Clevers H., Janes K. A. (2018). Automated Brightfield Morphometry of 3D Organoid Populations by OrganoSeg. Sci. Rep. 8, 5319. doi: 10.1038/s41598-017-18815-8 - DOI - PMC - PubMed

Publication types