. 2022 Jul 10:15:11786469221111116.
doi: 10.1177/11786469221111116. eCollection 2022.

Learning Deficits Induced by High-Calorie Feeding in the Rat are Associated With Impaired Brain Kynurenine Pathway Metabolism

Affiliations

Learning Deficits Induced by High-Calorie Feeding in the Rat are Associated With Impaired Brain Kynurenine Pathway Metabolism

Carla Elena Mezo-González et al. Int J Tryptophan Res. .

Abstract

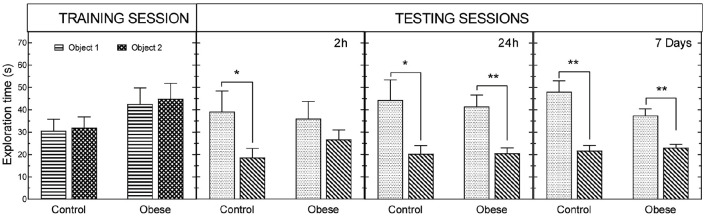
In addition to be a primary risk factor for type 2 diabetes and cardiovascular disease, obesity is associated with learning disabilities. Here we examined whether a dysregulation of the kynurenine pathway (KP) of tryptophan (Trp) metabolism might underlie the learning deficits exhibited by obese individuals. The KP is initiated by the enzymatic conversion of Trp into kynurenine (KYN) by indoleamine 2,3-dioxygenase (IDO). KYN is further converted to several signaling molecules including quinolinic acid (QA) which has a negative impact on learning. Wistar rats were fed either standard chow or made obese by exposure to a free choice high-fat high-sugar (fcHFHS) diet. Their learning capacities were evaluated using a combination of the novel object recognition and the novel object location tasks, and the concentrations of Trp and KYN-derived metabolites in several brain regions determined by ultra-performance liquid chromatography-tandem mass spectrometry. Male, but not female, obese rats exhibited reduced learning capacity characterized by impaired encoding along with increased hippocampal concentrations of QA, Xanthurenic acid (XA), Nicotinamide (Nam), and oxidized Nicotinamide Adenine Dinucleotide (NAD+). In contrast, no differences were detected in the serum levels of Trp or KP metabolites. Moreover, obesity enhanced the expression in the hippocampus and frontal cortex of kynurenine monooxygenase (KMO), an enzyme involved in the production of QA from kynurenine. QA stimulates the glutamatergic system and its increased production leads to cognitive impairment. These results suggest that the deleterious effects of obesity on cognition are sex dependent and that altered KP metabolism might contribute to obesity-associated learning disabilities.

Keywords: Tryptophan; brain; kynurenine; learning; memory; obesity.


Conflict of interest statement

Declaration of Conflicting Interests: The author(s) declared no potential conflicts of interest with respect to the research, authorship, and/or publication of this article.

Figures

Figure 1.
Figure 1.
Impact of obesity on the cognitive skills of 6-month-old male (A) and female (B) rats. The learning capacity of the animals was tested using the standard NOR test. Bars correspond to the exploration time of each of the objects during a 7-minute period. No difference in object exploration time was observed between the different groups during the training session. In contrast, obese male animals were unable to distinguish the novel object from the familiar one as shown by the almost identical exploration time of the 2 objects. Learning tests were performed at the beginning of the dark phase of the animal’s dark-light cycle with a total number of 8 to 12 animals per experimental group. **P < .01; ***P < .001 (Student’s t-test). §§§P < .001 (2-way ANOVA).
Figure 2.
Figure 2.
Body weight (A), adiposity index (B), and serum levels of leptin (C), insulin (D), triglycerides (E) and glucose (F) exhibited by 105-day-old control and obese male rats. Animals were made obese by exposure to a FcHFHS diet from weaning. Data represent the mean ± SEM from a total number of 8 animals per experimental group. *P < .05; **P < .01; ***P < .001 as determined by Student’s t-test.
Figure 3.
Figure 3.
Brain expression levels of mRNAs encoding for genes involved in inflammatory responses. Male rats were fed standard chow or rendered obese by exposure to a fcHFHS diet. Variations in gene expression were calculated by the 2-∆∆CT method using the expression of control animals as a calibrator. Data represent the mean ± SEM from a total number of 8 animals per experimental group. * P < .05; ** P < .01 (Student’s t-test).
Figure 4.
Figure 4.
Evaluation of the impact of obesity on the different components of the memory process. The learning capacity of 105-day-old male rats, was tested using a combination of the novel object recognition and novel object location tests. Bars represent the capacity of the animals to encode (2 hours), consolidate (24 hours), and retrieve (7 days), new information. Learning tests were performed at the beginning of the dark phase of the animal’s dark-light cycle. Data represent the mean ±SEM of the data from a total number of 9 to 12 animals per experimental group. *P < .05 as determined by Student’s t-test.
Figure 5.
Figure 5.
Concentration of several metabolites derived from the metabolism of tryptophan through the kynurenine pathway in the hippocampus (A), brain stem (B) and frontal cortex (C) of 105-day-old control (white bars), and obese (grey bars), male rats. The concentration of the different metabolites was determined by liquid chromatography–tandem mass spectrometry using brain samples from 7 to 8 animals per group. Data are expressed in percentage of values in adult animals fed a standard diet. Absolute values in pmol/g of tissue of xanthurenic (XA) and quinolinic (QA) acids as well as of kynurenine (KYN) and NAD+, for control animals in the different brain regions are indicated in the corresponding white bars. *P < .05; **P < .01, ***P < .001 as determined by Student’s t-test.
Figure 6.
Figure 6.
Expression levels of mRNAs encoding for key enzymes of tryptophan metabolism through the kynurenine pathway in the brain of control and obese 105-day-old male rats. The expression of TPH2, IDO1, KMO, and KAT, was determined by real-time quantitative PCR. Variations in gene expression were calculated by the 2-∆∆CT method using the expression of control animals as a calibrator. Data represent the mean ±SEM from a total of 8 animals per experimental group. White bars, control group; Grey bars, obese group. *P < .05. **P < .01. ***P < .001 (Student’s t-test).
Figure 7.
Figure 7.
Concentration of quinolinic acid in serum (A) and gene expression levels of IDO2 (B), TDO2 (C) and HAAO (D) mRNAs in liver of control and obese 105-day-old rats. The concentration of QA was determined by liquid chromatography–tandem mass spectrometry whereas the expression of IDO2, TDO2, and HAAO mRNAs was determined by real-time quantitative PCR. Variations in gene expression were calculated by the 2-∆∆CT method using the expression of control animals as a calibrator. Data correspond to the mean ± SEM from a total number of 7 to 8 animals per experimental group *P < .05. **P < .01 (Student’s t-test).

Similar articles

References

    1. Blüher M. Obesity: global epidemiology and pathogenesis. Nat Rev Endocrinol. 2019;15:288-298. - PubMed
    1. Dye L, Boyle NB, Champ C, Lawton C. The relationship between obesity and cognitive health and decline. Proc Nutr Soc. 2017;76:443-454. - PubMed
    1. Cournot M, Marquié JC, Ansiau D, et al.. Relation between body mass index and cognitive function in healthy middle-aged men and women. Neurology. 2006;67:1208-1214. - PubMed
    1. Dahl A, Hassing LB, Fransson E, et al.. Being overweight in midlife is associated with lower cognitive ability and steeper cognitive decline in late life. J Gerontol A Biol Sci Med Sci. 2010;65:57-62. - PMC - PubMed
    1. Pignatti R, Bertella L, Albani G, Mauro A, Molinari E, Semenza C. Decision-making in obesity: a study using the gambling task. Eat Weight Disord. 2006;11:126-132. - PubMed