A Computational Framework to Characterize the Cancer Drug Induced Effect on Aging Using Transcriptomic Data
- PMID: 35847024
- PMCID: PMC9277350
- DOI: 10.3389/fphar.2022.906429
A Computational Framework to Characterize the Cancer Drug Induced Effect on Aging Using Transcriptomic Data
Abstract
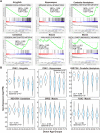
Cancer treatments such as chemotherapies may change or accelerate aging trajectories in cancer patients. Emerging evidence has shown that "omics" data can be used to study molecular changes of the aging process. Here, we integrated the drug-induced and normal aging transcriptomic data to computationally characterize the potential cancer drug-induced aging process in patients. Our analyses demonstrated that the aging-associated gene expression in the GTEx dataset can recapitulate the well-established aging hallmarks. We next characterized the drug-induced transcriptomic changes of 28 FDA approved cancer drugs in brain, kidney, muscle, and adipose tissues. Further drug-aging interaction analysis identified 34 potential drug regulated aging events. Those events include aging accelerating effects of vandetanib (Caprelsa®) and dasatinib (Sprycel®) in brain and muscle, respectively. Our result also demonstrated aging protective effect of vorinostat (Zolinza®), everolimus (Afinitor®), and bosutinib (Bosulif®) in brain.
Keywords: aging; cancer drug; drug-aging interaction; pharmacogenomics; transcriptomics.
Copyright © 2022 Zhao, Wang, Yang, Suh and Zhang.
Conflict of interest statement
The authors declare that the research was conducted in the absence of any commercial or financial relationships that could be construed as a potential conflict of interest.
Figures


Similar articles
-
Drug Repositioning for Noonan and LEOPARD Syndromes by Integrating Transcriptomics With a Structure-Based Approach.Front Pharmacol. 2020 Jun 26;11:927. doi: 10.3389/fphar.2020.00927. eCollection 2020. Front Pharmacol. 2020. PMID: 32676024 Free PMC article.
-
A human tissue-specific transcriptomic analysis reveals a complex relationship between aging, cancer, and cellular senescence.Aging Cell. 2019 Dec;18(6):e13041. doi: 10.1111/acel.13041. Epub 2019 Sep 27. Aging Cell. 2019. PMID: 31560156 Free PMC article.
-
Integrative omics analyses broaden treatment targets in human cancer.Genome Med. 2018 Jul 27;10(1):60. doi: 10.1186/s13073-018-0564-z. Genome Med. 2018. PMID: 30053901 Free PMC article.
-
[Four new drugs on the market: abiraterone, belatacept, vandetanib and fidaxomycine].Ann Pharm Fr. 2013 Mar;71(2):95-103. doi: 10.1016/j.pharma.2013.01.004. Epub 2013 Mar 8. Ann Pharm Fr. 2013. PMID: 23537410 Review. French.
-
Nitrogen-Containing Heterocycles as Anticancer Agents: An Overview.Anticancer Agents Med Chem. 2020;20(18):2150-2168. doi: 10.2174/1871520620666200705214917. Anticancer Agents Med Chem. 2020. PMID: 32628593 Review.
Cited by
-
A computational framework to in silico screen for drug-induced hepatocellular toxicity.Toxicol Sci. 2024 Sep 1;201(1):14-25. doi: 10.1093/toxsci/kfae078. Toxicol Sci. 2024. PMID: 38902949 Free PMC article.
-
Systematic investigation of chemo-immunotherapy synergism to shift anti-PD-1 resistance in cancer.Nat Commun. 2024 Apr 12;15(1):3178. doi: 10.1038/s41467-024-47433-y. Nat Commun. 2024. PMID: 38609378 Free PMC article.
References
-
- Albiges L., Antoun S., Martin L., Merad M., Loriot Y., Baracos V., et al. (2011). Effect of Everolimus Therapy on Skeletal Muscle Wasting in Patients with Metastatic Renal Cell Carcinoma (mRCC): Results from a Placebo-Controlled Study. J. Clin. Oncol. 29 (7_Suppl. l), 319. 10.1200/jco.2011.29.7_suppl.319 - DOI
-
- Alfano C. M., Peng J., Andridge R. R., Lindgren M. E., Povoski S. P., Lipari A. M., et al. (2017). Inflammatory Cytokines and Comorbidity Development in Breast Cancer Survivors Versus Noncancer Controls: Evidence for Accelerated Aging? J. Clin. Oncol. 35 (2), 149–156. 10.1200/JCO.2016.67.1883 - DOI - PMC - PubMed
LinkOut - more resources
Full Text Sources

