. 2022 Jun 30:13:866089.
doi: 10.3389/fmicb.2022.866089. eCollection 2022.

Dynamics of Mismatch and Alternative Excision-Dependent Repair in Replicating Bacillus subtilis DNA Examined Under Conditions of Neutral Selection

Affiliations

Dynamics of Mismatch and Alternative Excision-Dependent Repair in Replicating Bacillus subtilis DNA Examined Under Conditions of Neutral Selection

Adriana G Patlán-Vázquez et al. Front Microbiol. .

Abstract

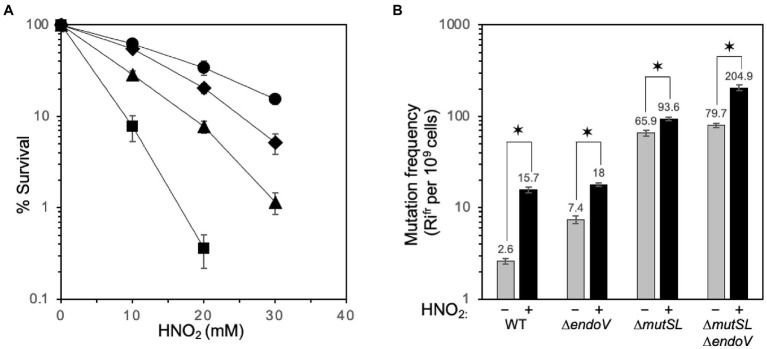
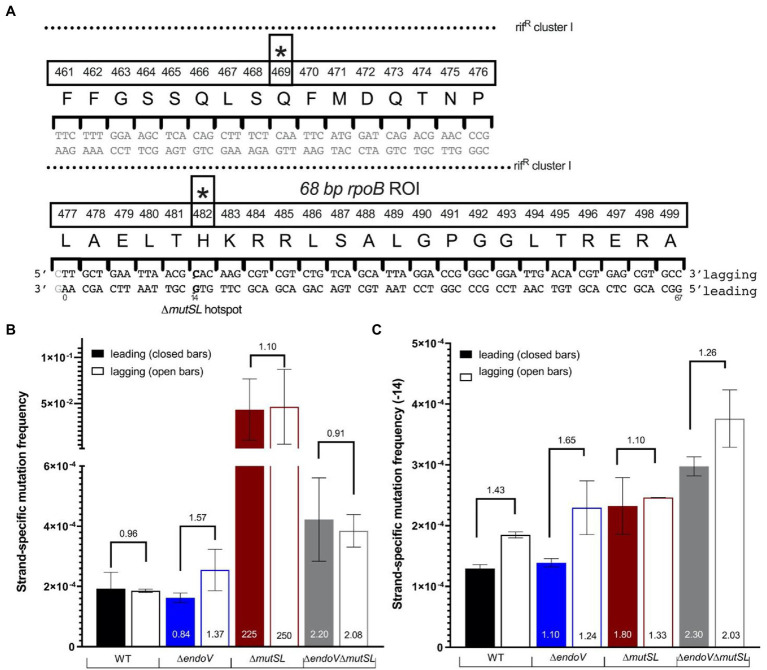
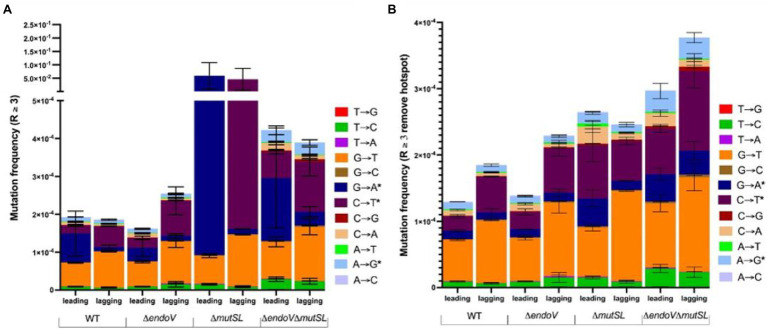
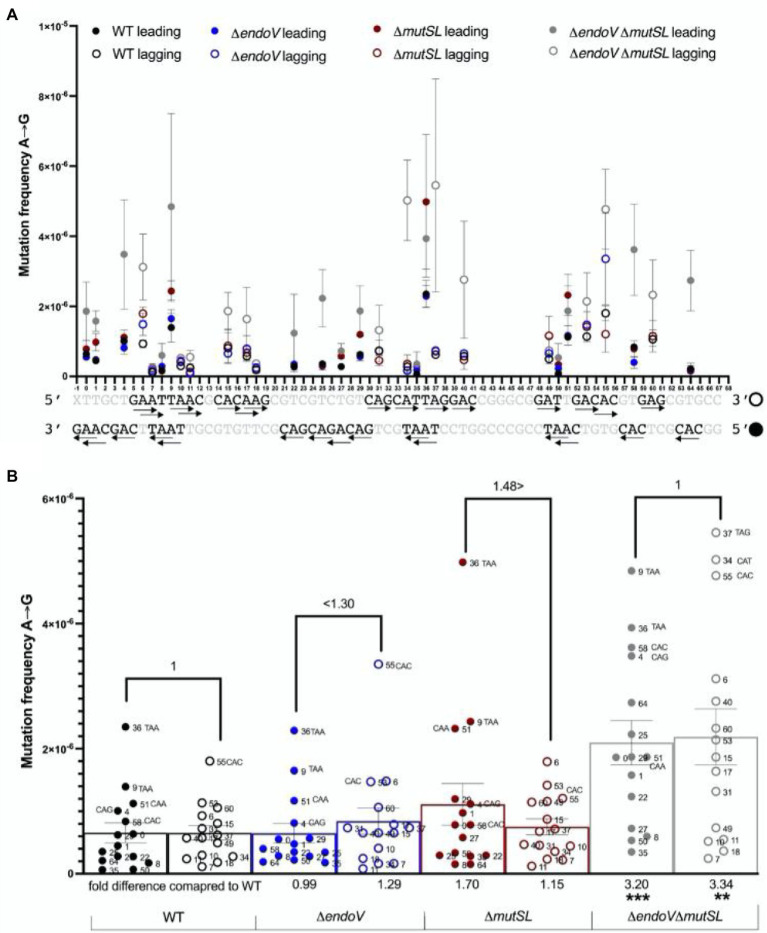
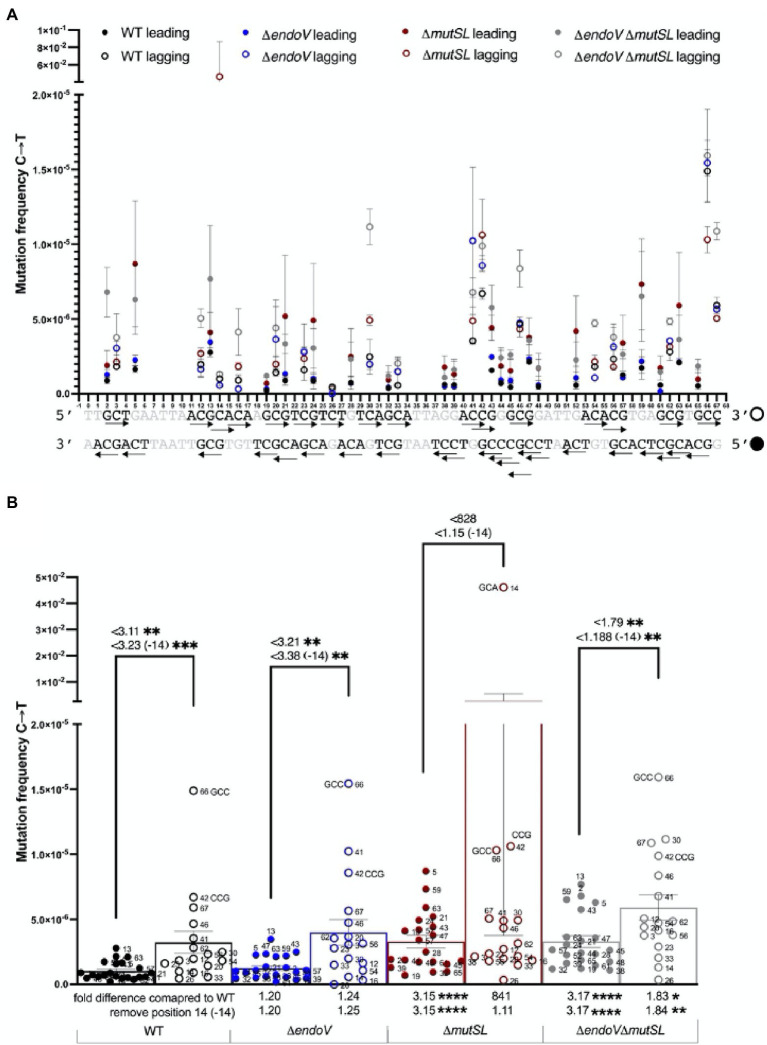
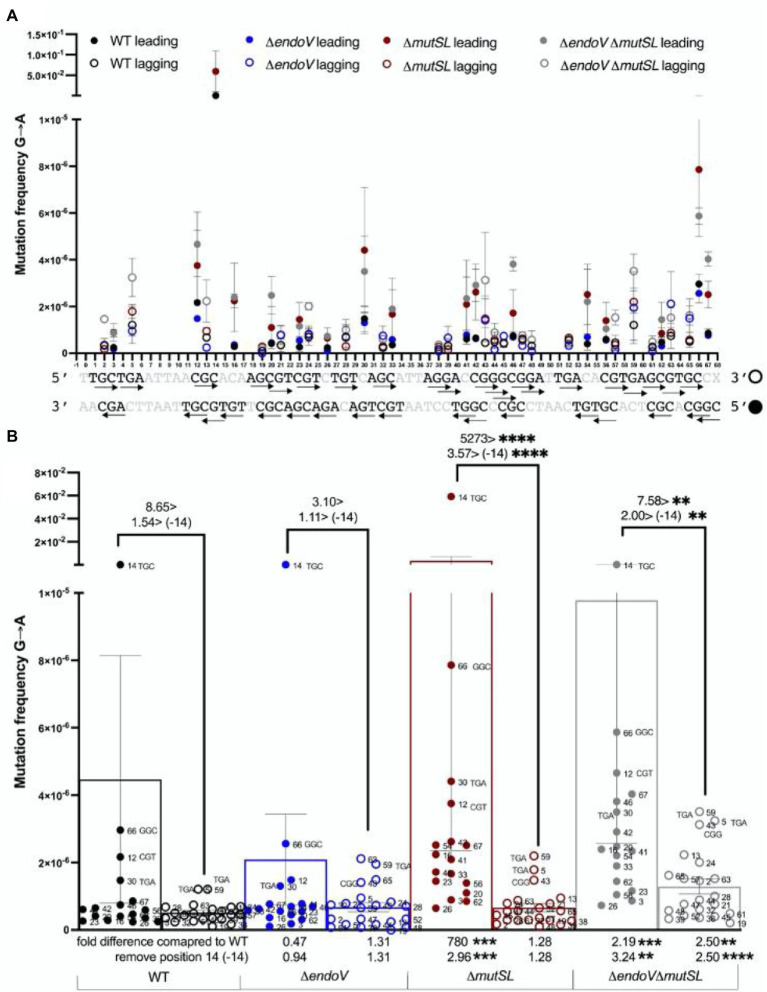
Spontaneous DNA deamination is a potential source of transition mutations. In Bacillus subtilis, EndoV, a component of the alternative excision repair pathway (AER), counteracts the mutagenicity of base deamination-induced mispairs. Here, we report that the mismatch repair (MMR) system, MutSL, prevents the harmful effects of HNO2, a deaminating agent of Cytosine (C), Adenine (A), and Guanine (G). Using Maximum Depth Sequencing (MDS), which measures mutagenesis under conditions of neutral selection, in B. subtilis strains proficient or deficient in MutSL and/or EndoV, revealed asymmetric and heterogeneous patterns of mutations in both DNA template strands. While the lagging template strand showed a higher frequency of C → T substitutions; G → A mutations, occurred more frequently in the leading template strand in different genetic backgrounds. In summary, our results unveiled a role for MutSL in preventing the deleterious effects of base deamination and uncovered differential patterns of base deamination processing by the AER and MMR systems that are influenced by the sequence context and the replicating DNA strand.

Keywords: AER repair; DNA mispairs; base deamination; maximum depth sequencing; mismatch repair.


Conflict of interest statement

The authors declare that the research was conducted in the absence of any commercial or financial relationships that could be construed as a potential conflict of interest.

Figures

Figure 1
Figure 1
Contribution of MutSL and EndoV in protecting Bacillus subtilis from the cytotoxic and mutagenic effects of spontaneous and HNO2-promoted base deamination. (A) Susceptibility of different strains of B. subtilis to nitrous acid. B. subtilis WT (●), mutSL (♦), endo V (▲), and mutSL endoV (■) strains were grown in A3 medium to a OD600nm of 0.5 and then treated with different doses of nitrous acid (HNO2). The results are expressed as averages ± SD of at least three independent experiments per triplicate. (B) Spontaneous and HNO2-induced mutation frequencies of strains with distinct genotypes. The strains indicated were grown at 37°C in A3 medium to an OD600 of 0.5 and then divided into two Erlenmeyer flasks; one of the flasks was left as an untreated control (gray bars), and the other was supplemented with an LD50 of HNO2 (black bars). The cultures were shaken for 1 h and after eliminating the deaminating agent from the amended cultures, all the flasks were shaken for an additional period of 12 h at 37°C. Finally, all the cultures were processed to calculate the frequencies of mutation to Rifr, as described in Materials and Methods. Each bar represents the mean of data collected from three independent experiments, each performed in sextuplicate, and the error bars represent SEMs. The asterisks indicate values that were significantly different (*, p < 0.05).
Figure 2
Figure 2
Maximum Depth Sequencing (MDS) of B. subtilis strains with distinct genotypes. (A) Schematic and sequence of the 68-bp rpoB ROI selected for MDS. The diagram depicts the overlap with the RifR cluster I (dotted lines), amino acid position, and the stars denote the two characterized mutagenic hotspots that confer RifR in B. subtilis. (B) Strand-specific mutation frequencies for the strains indicated. (C) Strand-specific mutation frequencies excluding position 14 corresponding to the first position of codon 482. The bars represent the average strand-specific frequency of two biological replicates. Each strand-specific frequency for each replicate was calculated by taking the total of all the changes in the ROI/important nodes. Error bars are SEM. Numbers on top of the graph denote the fold change increase or decrease of the lagging strand compared to the leading (example ΔendoV lagging/ΔendoV leading) while the numbers at the bottom represent the fold change increase or decrease of each strand compared to the WT (example ΔendoV leading/WT leading).
Figure 3
Figure 3
(A) Mutation frequencies for the strains indicated, depicting the contribution of base substitutions produced from base deamination (*) and from other types of base damages. (B) Mutation frequencies as shown in A but excluding position 14 corresponding to the first position of codon 482. Each section of the bars represents the mean frequency of two biological replicates. The frequency of each replicate was calculated using the sum of the specific change in the 68-bp ROI divided by the number of important/nodes or families. Error bars are SEM.
Figure 4
Figure 4
Maximum Depth Sequencing of A→G substitutions in the leading and lagging strands of the B. subtilis strains indicated. (A) A→G Mutation frequency of every A position in each strand of the 68-bp ROI. The arrow → follows 5′ → 3′ polarity. Closed circles represent the leading strand, while open circles represent the lagging strand. (B) The bars represent the average frequency across the ROI considering the frequency of every A position (dots). Each dot represents the average frequency of two biological replicates. Error bars are SEM. Values, and symbols >; <, above connecting lines indicate fold differences of mutation frequencies between the leading and lagging strands of each strain. Values in X axis, compare fold differences of mutation frequencies between the leading and lagging strands of the mutant strains with those from the WT. **, p < 0.0097; ***, p < 0.0002 (by the Mann–Whitney test).
Figure 5
Figure 5
Maximum Depth Sequencing of C→T substitutions in the leading and lagging strands of the B. subtilis strains indicated. (A) C→T Mutation frequency of every A position in each strand of the 68-bp ROI. The arrow → follows 5′ → 3′ polarity. Closed circles represent the leading strand, while open circles represent the lagging strand. (B) The bars represent the average frequency across the ROI considering the frequency of every C position (dots). Each dot represents the average frequency of two biological replicates. Error bars are SEM. Values (considering or not the contribution of the hot-spot 14), and symbol <, above connecting lines indicate times differences of mutation frequencies between the lagging and leading strand of each strain. Values in X axis, compare times differences of mutation frequencies (considering or not the contribution of the hot-spot 14) between the leading and lagging strands of the mutant strains with those from the WT. *, p < 0.01; **, p < 0.0097; ***, p < 0.001; ****, p < 0.0001 (by the Mann–Whitney test).
Figure 6
Figure 6
Maximum Depth Sequencing of G→A substitutions in the leading and lagging strands of the B. subtilis strains indicated. (A) G→A Mutation frequency of every G position in each strand of the 68-bp ROI. The arrow → follows 5′ → 3′ polarity. Closed circles represent the leading strand, while open circles represent the lagging strand. (B) The bars represent the average frequency across the ROI considering the frequency of every G position (dots). Each dot represents the average frequency of two biological replicates. Error bars are SEM. Values (considering or not the contribution of the hot-spot 14), and symbol >, above connecting lines indicate times differences of mutation frequencies between the leading and lagging strand of each strain. Values in X axis, compare times differences of mutation frequencies (considering or not the contribution of the hot-spot 14) between the leading and lagging strands of the mutant strains with those from the WT. **, p < 0.0014 (above) and p < 0.0014 (below); ***, p < 0.0002; ****, p < 0.0001 (by the Mann–Whitney test).
Figure 7
Figure 7
Spectrum of C→T and A→G transitions leading to silent (A) and aminoacidic changes (B,C) identified by MDS in the rpoB ROI. Each scheme (A–C) shows the WT codons and position of the encoded amino acids in the rpoB ROI analyzed. The base substitutions are shown underlined in the mutated codon below the WT codons. The amino acid changes (in the single letter format) are shown in bold type, below the mutated codons. Silent mutations (A) derived from G→A and C→T substitutions are shown in blue and red bold type, respectively. Aminoacidic changes derived from C→T mutations (B) are shown in purple bold type letter below each mutated codon. Aminoacidic changes derived from G→A transitions (C) are shown in green bold type letter below each mutated codon.
Figure 8
Figure 8
Frequency of predicted silent (black bars), non-conserved (dark grey bars) and conserved (light grey bars) amino acid changes promoted by C→T (A) and A→G (B) transitions in the leading (Ld) and lagging (Lg) strands of the rpoB ROI analyzed. The bars represent the average frequency of each type of silent and amino acid mutations in the leading and lagging strands across the rpoB ROI considering the frequency of every C→T and A→G mutation. The frequency values, in the four strains, disregard the contribution of the hot spot 14 (H482) in the rpoB ROI. Values represent the average frequency of two biological replicates. Error bars are SEM.

Similar articles

Cited by

References

    1. Ayala-García V. M., Valenzuela-García L. I., Setlow P., Pedraza-Reyes M. (2016). Aag hypoxanthine-DNA glycosylase is synthesized in the forespore compartment and involved in counteracting the genotoxic and mutagenic effects of hypoxanthine and alkylated bases in DNA during Bacillus subtilis sporulation. J. Bacteriol. 198, 3345–3354. doi: 10.1128/jb.00625-16, PMID: - DOI - PMC - PubMed
    1. Bhagwat A. S., Hao W., Townes J. P., Lee H., Tang H., Foster P. L. (2016). Strand-biased cytosine deamination at the replication fork causes cytosine to thymine mutations in Escherichia coli. Proc. Natl. Acad. Sci. U. S. A. 113, 2176–2181. doi: 10.1073/pnas.1522325113, PMID: - DOI - PMC - PubMed
    1. Campbell E. A., Korzheva N., Mustaev A., Murakami K., Nair S., Goldfarb A., et al. . (2001). Structural mechanism for rifampicin inhibition of bacterial RNA polymerase. Cell 104, 901–912. doi: 10.1016/s0092-8674(01)00286-0, PMID: - DOI - PubMed
    1. Castañeda-García A., Martín-Blecua I., Cebrián-Sastre E., Chiner-Oms A., Torres-Puente M., Comas I., et al. . (2020). Specificity and mutagenesis bias of the mycobacterial alternative mismatch repair analyzed by mutation accumulation studies. Sci. Adv. 6:eaay4453. doi: 10.1126/sciadv.aay4453, PMID: - DOI - PMC - PubMed
    1. Chatterjee N., Walker G. C. (2017). Mechanisms of DNA damage, repair and mutagenesis. Environ. Mol. Mutagen. 58, 235–263. doi: 10.1002/em.22087, PMID: - DOI - PMC - PubMed

LinkOut - more resources