

Characterising the Gut Microbiomes in Wild and Captive Short-Beaked Echidnas Reveals Diet-Associated Changes
- PMID: 35847103
- PMCID: PMC9279566
- DOI: 10.3389/fmicb.2022.687115
Characterising the Gut Microbiomes in Wild and Captive Short-Beaked Echidnas Reveals Diet-Associated Changes
Abstract
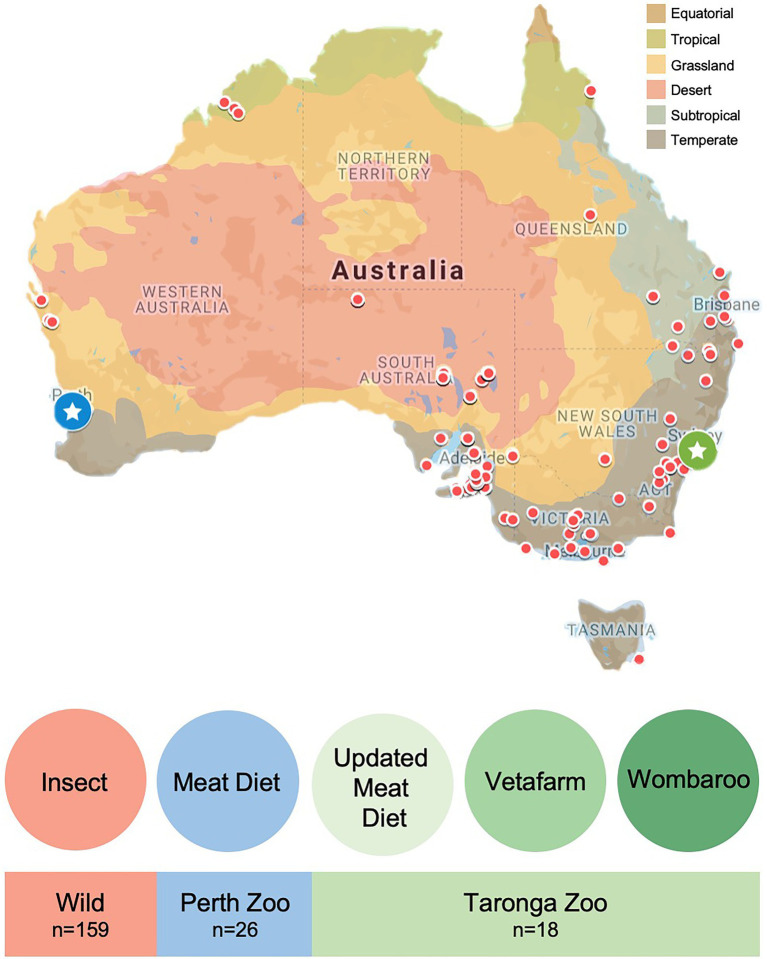
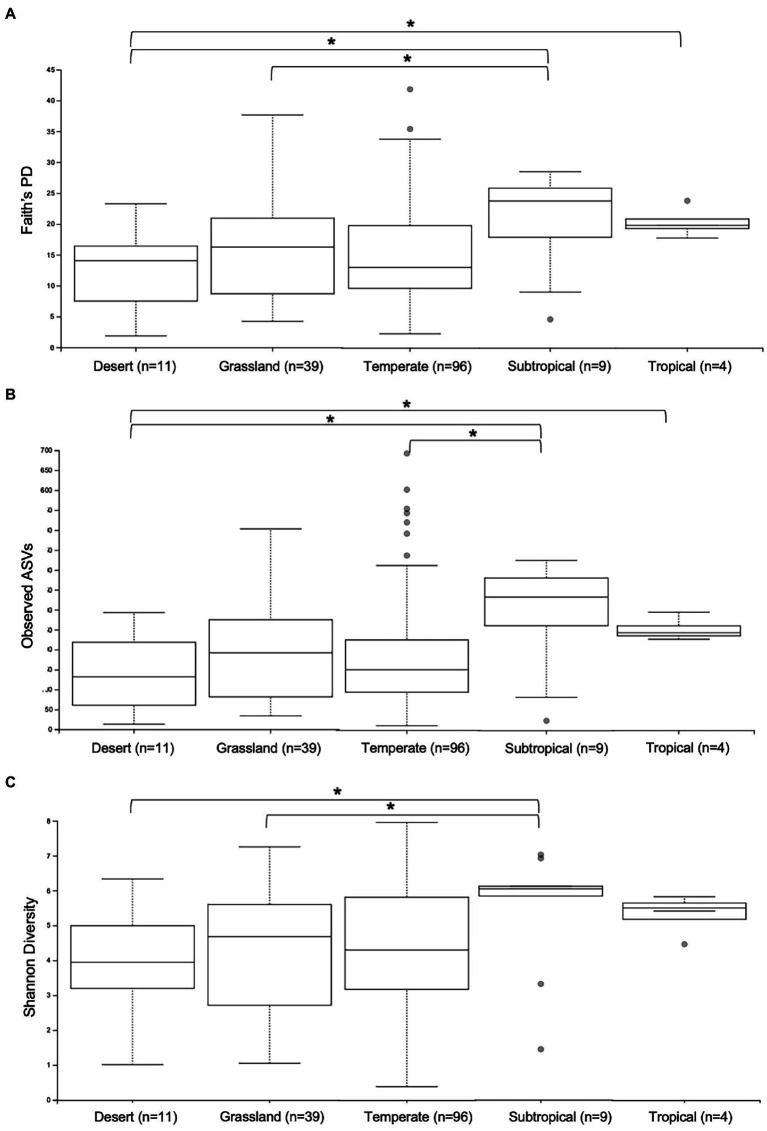
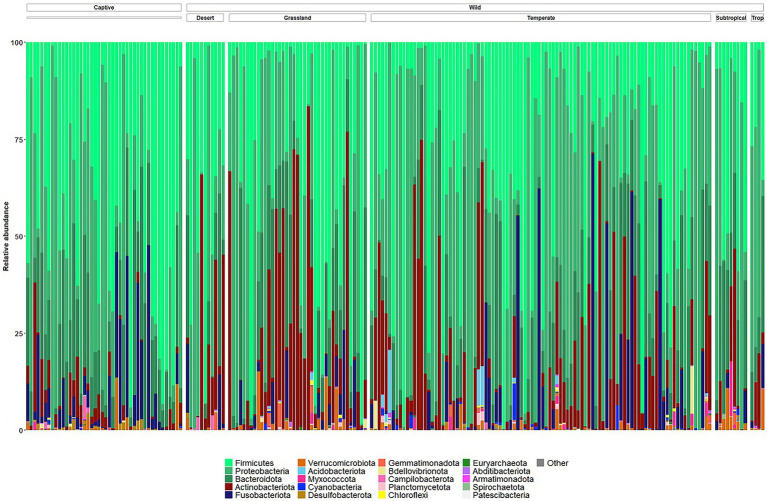
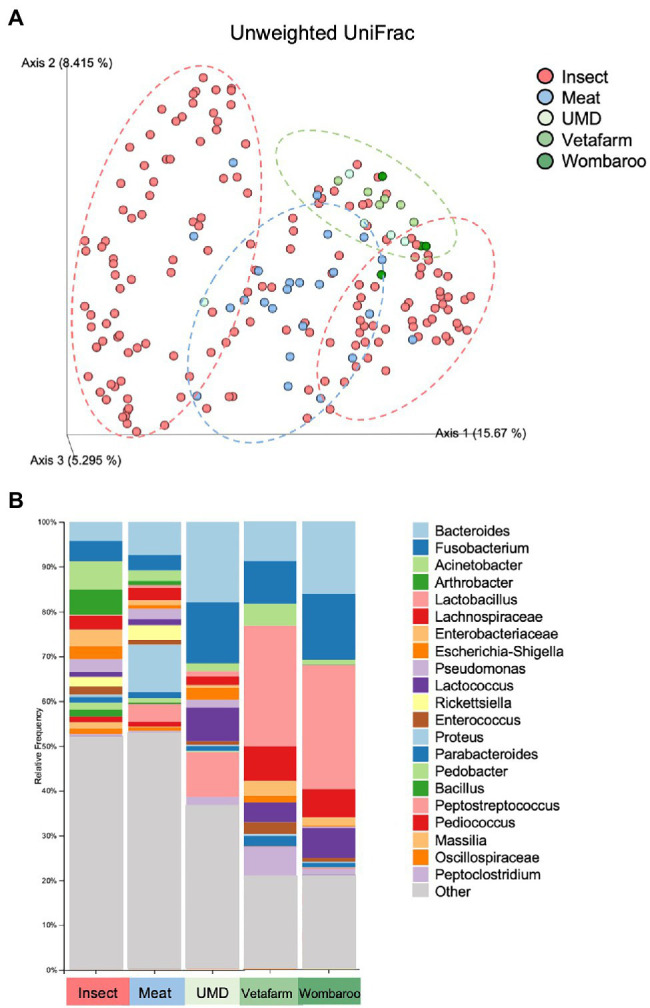
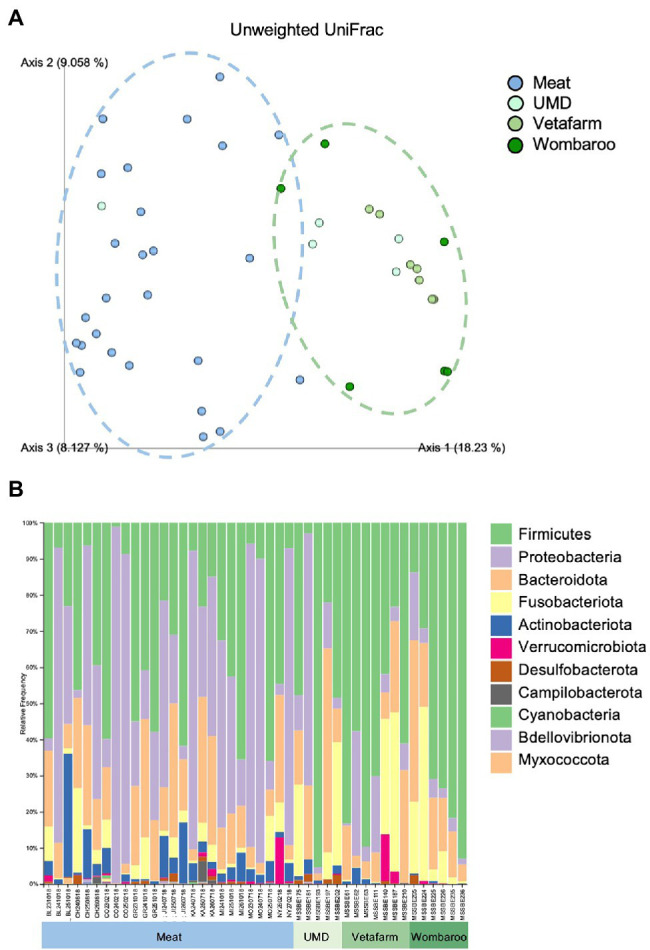
The gut microbiome plays a vital role in health and wellbeing of animals, and an increasing number of studies are investigating microbiome changes in wild and managed populations to improve conservation and welfare. The short-beaked echidna (Tachyglossus aculeatus) is an iconic Australian species, the most widespread native mammal, and commonly held in zoos. Echidnas are cryptic animals, and much is still unknown about many aspects of their biology. Furthermore, some wild echidna populations are under threat, while echidnas held in captivity can have severe gastric health problems. Here, we used citizen science and zoos to collect echidna scats from across Australia to perform the largest gut microbiome study on any native Australian animal. Using 16S rRNA gene metabarcoding of scat samples, we characterised and compared the gut microbiomes of echidnas in wild (n = 159) and managed (n = 44) populations, which were fed four different diets. Wild echidna samples were highly variable, yet commonly dominated by soil and plant-fermenting bacteria, while echidnas in captivity were dominated by gut commensals and plant-fermenting bacteria, suggesting plant matter may play a significant role in echidna diet. This work demonstrates significant differences between zoo held and wild echidnas, as well as managed animals on different diets, revealing that diet is important in shaping the gut microbiomes in echidnas. This first analysis of echidna gut microbiome highlights extensive microbial diversity in wild echidnas and changes in microbiome composition in managed populations. This is a first step towards using microbiome analysis to better understand diet, gastrointestinal biology, and improve management in these iconic animals.
Keywords: Australia; EchidnaCSI; captive; digestive physiology; herbivore; insects; nutrition.
Copyright © 2022 Perry, West, Eisenhofer, Stenhouse, Wilson, Laming, Rismiller, Shaw and Grützner.
Conflict of interest statement
The authors declare that the research was conducted in the absence of any commercial or financial relationships that could be construed as a potential conflict of interest.
Figures
Similar articles
-
EchidnaCSI: Engaging the public in research and conservation of the short-beaked echidna.Proc Natl Acad Sci U S A. 2022 Feb 1;119(5):e2108826119. doi: 10.1073/pnas.2108826119. Proc Natl Acad Sci U S A. 2022. PMID: 35074871 Free PMC article.
-
Digestibility of a new diet for captive short-beaked echidnas (Tachyglossus aculeatus).Zoo Biol. 2017 Jan;36(1):56-61. doi: 10.1002/zoo.21347. Epub 2017 Jan 23. Zoo Biol. 2017. PMID: 28111821
-
Year-long presence of Eimeria echidnae and absence of Eimeria tachyglossi in captive short-beaked echidnas ( Tachyglossus aculeatus ).J Parasitol. 2012 Jun;98(3):543-9. doi: 10.1645/GE-2982.1. Epub 2012 Jan 11. J Parasitol. 2012. PMID: 22236183
-
Energy Homeostasis in Monotremes.Front Neurosci. 2017 Apr 21;11:195. doi: 10.3389/fnins.2017.00195. eCollection 2017. Front Neurosci. 2017. PMID: 28484364 Free PMC article. Review.
-
Global landscape of gut microbiome diversity and antibiotic resistomes across vertebrates.Sci Total Environ. 2022 Sep 10;838(Pt 2):156178. doi: 10.1016/j.scitotenv.2022.156178. Epub 2022 May 23. Sci Total Environ. 2022. PMID: 35618126 Review.
Cited by
-
Comparative Analysis of Gut Microbiome Community Structures in Different Populations of Asian Elephants in China and Their Correlation with Diet.Genes (Basel). 2025 Apr 25;16(5):483. doi: 10.3390/genes16050483. Genes (Basel). 2025. PMID: 40428305 Free PMC article.
-
Microbiota changes in lactation in the short-beaked echidna (Tachyglossus aculeatus).FEMS Microbiol Ecol. 2025 Apr 14;101(5):fiaf036. doi: 10.1093/femsec/fiaf036. FEMS Microbiol Ecol. 2025. PMID: 40194944 Free PMC article.
-
Community science draws on the power of the crowd.Nature. 2022 Sep;609(7927):641-643. doi: 10.1038/d41586-022-02921-3. Nature. 2022. PMID: 36097058 No abstract available.
-
Comparative gut microbiome research through the lens of ecology: theoretical considerations and best practices.Biol Rev Camb Philos Soc. 2025 Apr;100(2):748-763. doi: 10.1111/brv.13161. Epub 2024 Nov 12. Biol Rev Camb Philos Soc. 2025. PMID: 39530277 Free PMC article. Review.
-
Gut microbiota in the short-beaked echidna (Tachyglossus Aculeatus) shows stability across gestation.Microbiologyopen. 2023 Dec;12(6):e1392. doi: 10.1002/mbo3.1392. Microbiologyopen. 2023. PMID: 38129978 Free PMC article.
References
-
- Abensperg-Traun M. (1991). A study of home-range movements and shelter use in adult and juvenile echidnas, Tachyglossus aculeatus (Monotrema: Taychglossidae) in Western Australian-wheatbelt reserves. Aust. Mammal. 14, 13–21. doi: 10.1071/AM91002 - DOI
-
- Acer Ö., Güven K., Poli A., Di Donato P., Leone L., Buono L., et al. . (2020). Acinetobacter mesopotamicus sp. nov., petroleum-degrading bacterium, isolated from petroleum-contaminated soil in Diyarbakir, in the southeast of Turkey. Curr. Microbiol. 77, 3192–3200. doi: 10.1007/s00284-020-02134-9, PMID: - DOI - PubMed
-
- Archer M. (1983). Mammals in Australia. Sydney, New South Wales, Australia: Australian Museum.
-
- Augee M. L., Gooden B., Musser A. (2006). Echidna: Extraordinary Egg-Laying Mammal. Collingwood, Victoria, Australia: Csiro Publishing.
LinkOut - more resources
Full Text Sources