

Dual Detection of Hemagglutinin Proteins of H5N1 and H1N1 Influenza Viruses Based on FRET Combined With DNase I
- PMID: 35847124
- PMCID: PMC9280266
- DOI: 10.3389/fmicb.2022.934475
Dual Detection of Hemagglutinin Proteins of H5N1 and H1N1 Influenza Viruses Based on FRET Combined With DNase I
Abstract
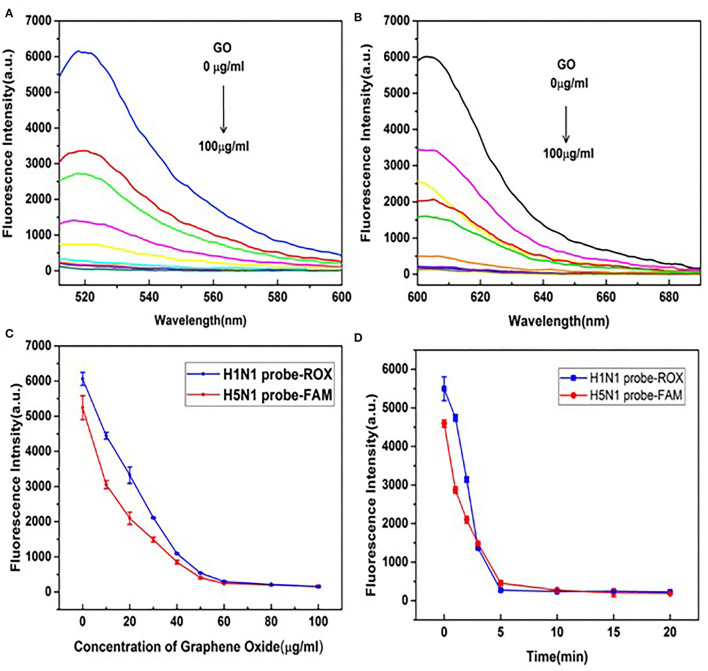
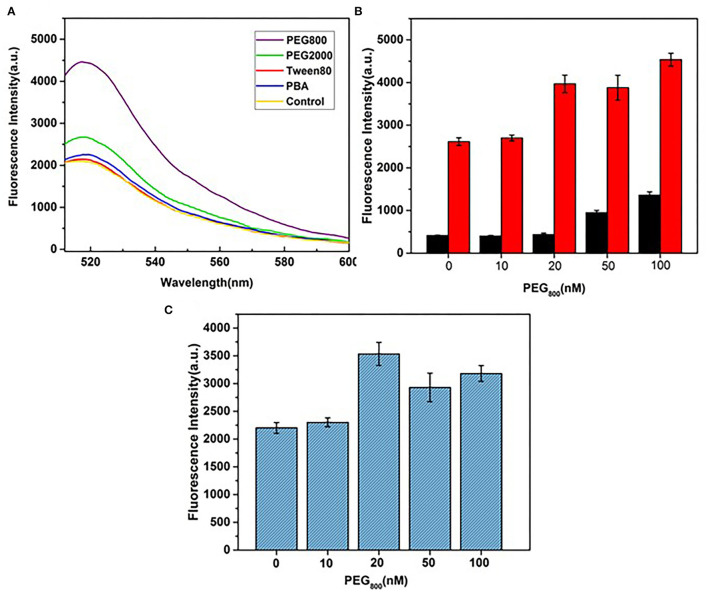
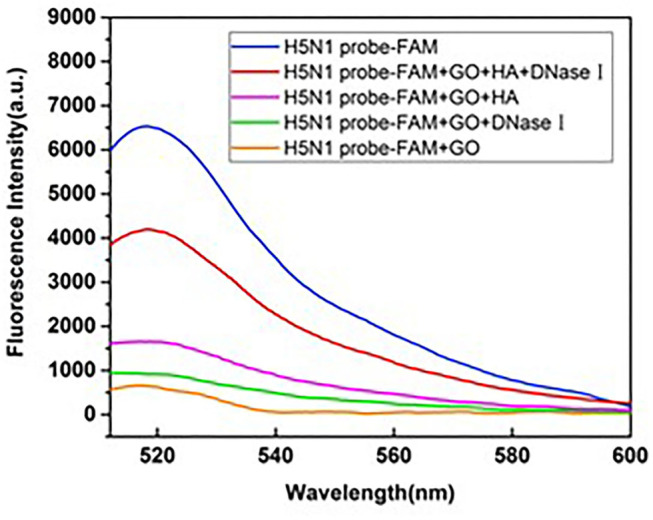
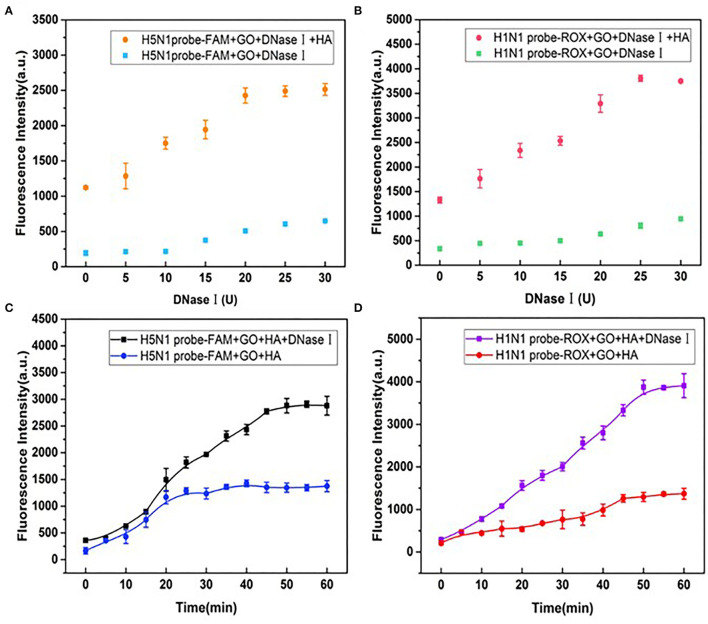
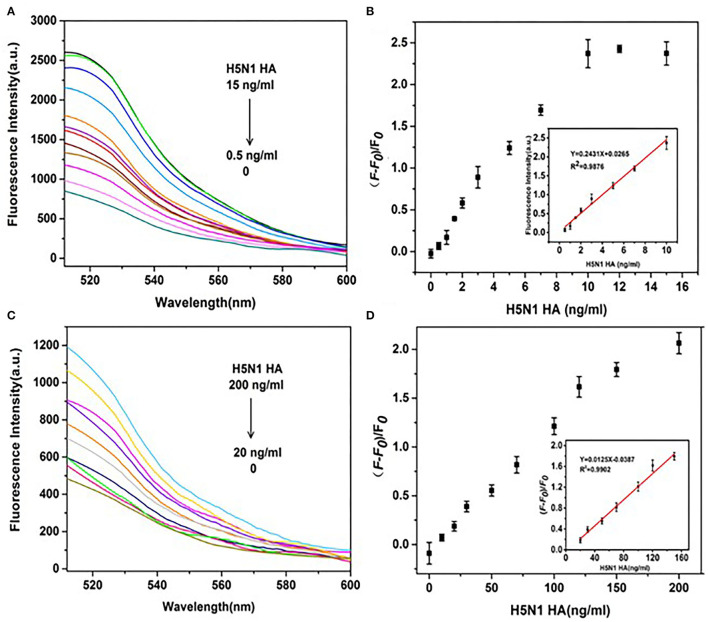
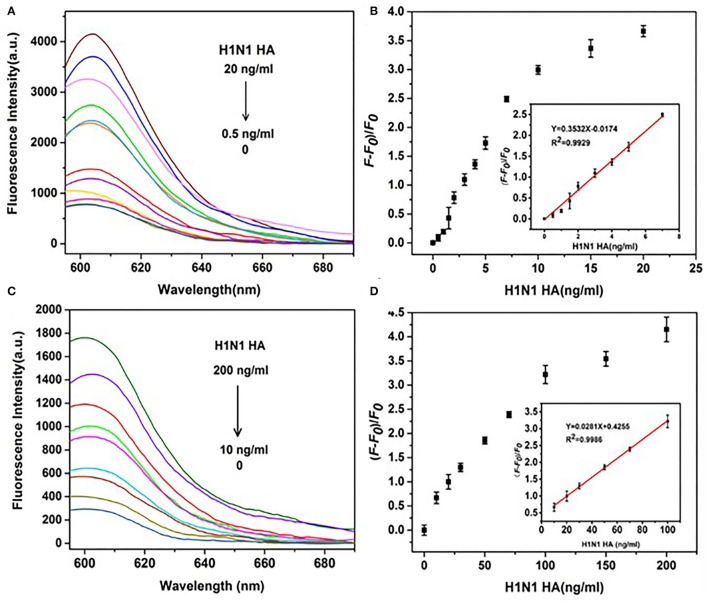
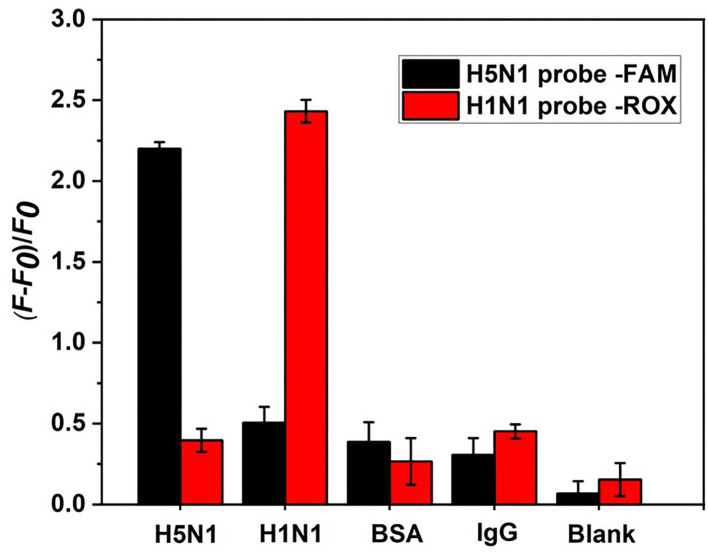
Influenza A viruses (IAV) are classified based on their surface proteins hemagglutinin (HA) and neuraminidase (NA). Both pandemic H1N1 (pH1N1) and highly pathogenic avian influenza (HPAI) H5N1 viruses pose a significant threat to public health. Effective methods to simultaneously distinguish H1N1 and H5N1 are thus of great clinical value. In this study, a protocol for detection of HA proteins of both H1N1 and H5N1 was established. Specifically, we designed an aptasensor for HA using fluorescence resonance energy transfer (FRET) strategy combined with DNase I-assisted cyclic enzymatic signal amplification. HA aptamers of H1N1 and H5N1 IAVs labeled with various fluorescent dyes were used as probes. Graphene oxide (GO) acted as a FRET acceptor for quenching the fluorescence signal and protected aptamers from DNase I cleavage. The fluorescence signal was recovered owing to aptamer release from GO with HA protein. DNase I-digested free aptamers and HA proteins were able to further interact with more fluorescent aptamer probes, resulting in increased signal amplification. The limits of detection (LOD) of H5N1 HA and H1N1 HA were 0.73 and 0.43 ng/ml, respectively, which were 19 and 27 times higher than LOD values obtained with the DNase I-free system. The recovery rate of HA protein in human serum samples ranged from 88.23 to 117.86%, supporting the accuracy and stability of this method in a complex detection environment. Our rapid, sensitive, and cost-effective novel approach could be expanded to other subtypes of IAVs other than H1N1 and H5N1.
Keywords: DNase I; FRET; H1N1; H5N1; hemagglutinin.
Copyright © 2022 Wang, Zhao, Huang, Duan, Li and Wang.
Conflict of interest statement
The authors declare that the research was conducted in the absence of any commercial or financial relationships that could be construed as a potential conflict of interest.
Figures


Similar articles
-
A novel pathogenic mechanism of highly pathogenic avian influenza H5N1 viruses involves hemagglutinin mediated resistance to serum innate inhibitors.PLoS One. 2012;7(5):e36318. doi: 10.1371/journal.pone.0036318. Epub 2012 May 1. PLoS One. 2012. PMID: 22563489 Free PMC article.
-
Upconversion Fluorescence Resonance Energy Transfer Aptasensors for H5N1 Influenza Virus Detection.ACS Omega. 2021 Jun 4;6(23):15236-15245. doi: 10.1021/acsomega.1c01491. eCollection 2021 Jun 15. ACS Omega. 2021. PMID: 34151102 Free PMC article.
-
An aptamer that binds efficiently to the hemagglutinins of highly pathogenic avian influenza viruses (H5N1 and H7N7) and inhibits hemagglutinin-glycan interactions.Acta Biomater. 2014 Mar;10(3):1314-23. doi: 10.1016/j.actbio.2013.12.034. Epub 2013 Dec 25. Acta Biomater. 2014. PMID: 24374323
-
Unique Infectious Strategy of H5N1 Avian Influenza Virus Is Governed by the Acid-Destabilized Property of Hemagglutinin.Viral Immunol. 2017 Jul/Aug;30(6):398-407. doi: 10.1089/vim.2017.0020. Epub 2017 Jun 27. Viral Immunol. 2017. PMID: 28654310 Review.
-
Epidemiology, ecology and gene pool of influenza A virus in Egypt: will Egypt be the epicentre of the next influenza pandemic?Virulence. 2015;6(1):6-18. doi: 10.4161/21505594.2014.992662. Virulence. 2015. PMID: 25635701 Free PMC article. Review.
Cited by
-
Biosensing Systems Based on Graphene Oxide Fluorescence Quenching Effect.Micromachines (Basel). 2023 Jul 28;14(8):1522. doi: 10.3390/mi14081522. Micromachines (Basel). 2023. PMID: 37630058 Free PMC article. Review.
References
LinkOut - more resources
Full Text Sources