. 2022 Jun 30;7(27):23685-23694.
doi: 10.1021/acsomega.2c02316. eCollection 2022 Jul 12.

Synthesis of "Naked" TeO2 Nanoparticles for Biomedical Applications

Affiliations

Synthesis of "Naked" TeO2 Nanoparticles for Biomedical Applications

Tina Hesabizadeh et al. ACS Omega. .

Abstract

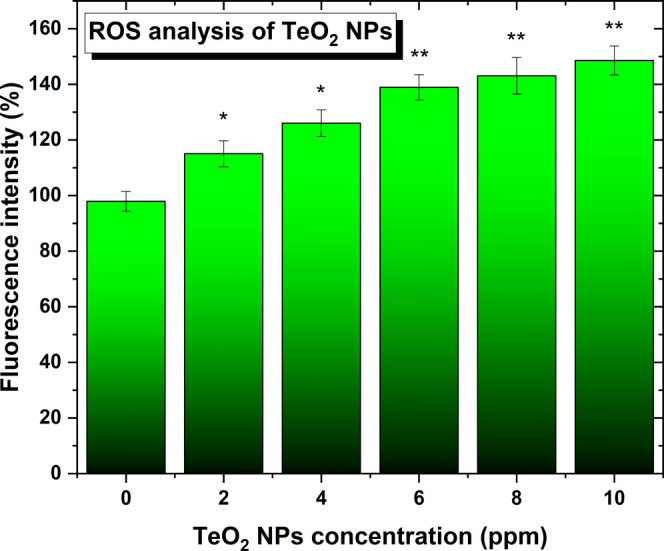
Chalcogenide nanoparticles have become a very active field of research for their optoelectronic and biological properties. This article shows the production of tellurium dioxide nanoparticles (TeO2 NPs) by pulsed laser ablation in liquids. The produced nanoparticles were spherical with a diameter of around 70 nm. The energy band gap of those nanoparticles was determined to be around 5.2 eV. Moreover, TeO2 NPs displayed a dose-dependent antibacterial effect against antibiotic-resistant bacteria such as multidrug-resistant Escherichia coli (MDR E. coli) and methicillin-resistant Staphylococcus aureus (MR S. aureus). The "naked" nature of the nanoparticle surface helped to eradicate the antibiotic-resistant bacteria at a very low concentration, with IC50 values of ∼4.3 ± 0.9 and 3.7 ± 0.2 ppm for MDR E. coli and MR S. aureus, respectively, after just 8 h of culture. Further, the IC50 values of the naked TeO2 NPs against melanoma (skin cancer) and healthy fibroblasts were 1.6 ± 0.7 and 5.5 ± 0.2 ppm, respectively, for up to 72 h. Finally, to understand these optimal antibacterial and anticancer properties of the TeO2 NPs, the reactive oxygen species generated by the nanoparticles were measured. In summary, the present in vitro results demonstrate much promise for the presently prepared TeO2 NPs and they should be studied for a wide range of safe antibacterial and anticancer applications.


Conflict of interest statement

The authors declare the following competing financial interest(s): The authors declare that the University of Arkansas at Little Rock has filled a provisional US patent on those tellurium dioxide nanoparticles.

Figures

Figure 1
Figure 1
(a) Sketch showing the PLAL synthesis protocol. (b) Tyndall effect observed on the colloid synthesized by PLAL at 1000 Hz. The left solution is the solvent, i.e., DI water, while the right solution is the colloid containing the TeO2 NPs. (c) Scanning electron microscopy (SEM) image of the TeO2 NPs contained in the colloid synthesized by PLAL at 1000 Hz. (d) Energy-dispersive X-ray (EDX) line scan through one TeO2 particle.
Figure 2
Figure 2
(a) XRD spectra. The peak positions of Te and α-TeO2 were obtained from the crystallography open database entries 1011098 and 1530871, respectively. (b) Raman spectra.
Figure 3
Figure 3
(a) XPS spectra focusing on the O 1s orbitals. (b) XPS spectra focusing on the Te 3d orbitals. For Te 3d spectrum fitting, the best fit Lorentzian–Gaussian ratio was 28.05% for TeO2 and 71.44% for the metallic Te.
Figure 4
Figure 4
(a) Differential scanning calorimetry curve. (b) SEM image showing TeO2 NPs and Te ablation debris from the target.
Figure 5
Figure 5
(a) Intensity size distribution as measured by DLS on the colloid synthesized at 1000 Hz. Inset: number size distribution measured by DLS on the colloid synthesized at 1000 Hz. The number size distribution is centered around ∼70 nm. (b) The ζ-potential was measured to be −8 ± 1 mV, meaning that the colloid was not stable with time.
Figure 6
Figure 6
(a) UV–visible spectra of the colloid shown in Figure 1b. (b) Tauc plot displaying an energy band gap of around ∼5.2 eV.
Figure 7
Figure 7
Colony counting assay of (a) MDR E. coli and (b) MR S. aureus for 8 h in the presence of different concentrations of TeO2 NPs. All values represent the mean ± standard deviation. *p < 0.05, **p < 0.01 (compared to controls).
Figure 8
Figure 8
(a) Human dermal fibroblast (HDF) cells and (b) human melanoma cells in the presence of different concentrations of the NPs. N = 3. Data are represented as mean ± SD; *p < 0.05, **p < 0.01 compared to the control.
Figure 9
Figure 9
(a) Representative electron microscopy image of human melanoma cells before their interaction with the TeO2 NPs. (b) Representative electron microscopy image of human melanoma cells after being exposed to a fixed concentration of 4 ppm of TeO2 NPs; image is taken after 24 h of contact.
Figure 10
Figure 10
Reactive oxygen species (ROS) induced by the NPs in human melanoma cell experiments. A trend of the release of the species with the increase in NP concentration for the same time frame is seen. N = 3. Data is represented as mean ± SD; *p < 0.05, **p < 0.01 (compared to 0 concentration).

References

    1. Ibers J. Tellurium in a twist. Nat. Chem. 2009, 1, 50810.1038/nchem.350. - DOI - PubMed
    1. Goldfarb R. J.Tellurium: Providing a Bright Future for Solar Energy, U. S. Geological Survey, Fact Sheet 2014-3077, 2015.
    1. Chivers T.; Laitinen R. S. Tellurium: a maverick among the chalcogens. Chem. Soc. Rev. 2015, 44, 1725–1739. 10.1039/C4CS00434E. - DOI - PubMed
    1. Geoffrion L. D.; Guisbiers G. Physico-chemical properties of selenium–tellurium alloys across the scales. Nanoscale Adv. 2021, 3, 4254–4270. 10.1039/D1NA00087J. - DOI - PMC - PubMed
    1. Anderson D. L.Theory of the Earth; Blackwell Scientific Publications, 1989.