Gene Expression Analysis Reveals Prognostic Biomarkers of the Tyrosine Metabolism Reprogramming Pathway for Prostate Cancer
- PMID: 35847355
- PMCID: PMC9279037
- DOI: 10.1155/2022/5504173
Gene Expression Analysis Reveals Prognostic Biomarkers of the Tyrosine Metabolism Reprogramming Pathway for Prostate Cancer
Abstract
Background: Tyrosine metabolism pathway-related genes were related to prostate cancer progression, which may be used as potential prognostic markers.
Aims: To dissect the dysregulation of tyrosine metabolism in prostate cancer and build a prognostic signature based on tyrosine metabolism-related genes for prostate cancer. Materials and Method. Cross-platform gene expression data of prostate cancer cohorts were collected from both The Cancer Genome Atlas (TCGA) and Gene Expression Omnibus (GEO). Based on the expression of tyrosine metabolism-related enzymes (TMREs), an unsupervised consensus clustering method was used to classify prostate cancer patients into different molecular subtypes. We employed the least absolute shrinkage and selection operator (LASSO) Cox regression analysis to evaluate prognostic characteristics based on TMREs to obtain a prognostic effect. The nomogram model was established and used to synthesize molecular subtypes, prognostic characteristics, and clinicopathological features. Kaplan-Meier plots and logrank analysis were used to clarify survival differences between subtypes.
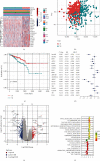
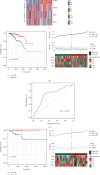
Results: Based on the hierarchical clustering method and the expression profiles of TMREs, prostate cancer samples were assigned into two subgroups (S1, subgroup 1; S2, subgroup 2), and the Kaplan-Meier plot and logrank analysis showed distinct survival outcomes between S1 and S2 subgroups. We further established a four-gene-based prognostic signature, and both in-group testing dataset and out-group testing dataset indicated the robustness of this model. By combining the four gene-based signatures and clinicopathological features, the nomogram model achieved better survival outcomes than any single classifier. Interestingly, we found that immune-related pathways were significantly concentrated on S1-upregulated genes, and the abundance of memory B cells, CD4+ resting memory T cells, M0 macrophages, resting dendritic cells, and resting mast cells were significantly different between S1 and S2 subgroups.
Conclusions: Our results indicate the prognostic value of genes related to tyrosine metabolism in prostate cancer and provide inspiration for treatment and prevention strategies.
Copyright © 2022 Wei Li et al.
Conflict of interest statement
The authors declare that they have no conflicts of interest.
Figures


Similar articles
-
Identification of a Nine-Gene Signature and Establishment of a Prognostic Nomogram Predicting Overall Survival of Pancreatic Cancer.Front Oncol. 2019 Sep 27;9:996. doi: 10.3389/fonc.2019.00996. eCollection 2019. Front Oncol. 2019. PMID: 31612115 Free PMC article.
-
Identification of Breast Cancer Subtypes by Integrating Genomic Analysis with the Immune Microenvironment.ACS Omega. 2023 Mar 21;8(13):12217-12231. doi: 10.1021/acsomega.2c08227. eCollection 2023 Apr 4. ACS Omega. 2023. PMID: 37033796 Free PMC article.
-
Clinical Significance and Immunometabolism Landscapes of a Novel Recurrence-Associated Lipid Metabolism Signature In Early-Stage Lung Adenocarcinoma: A Comprehensive Analysis.Front Immunol. 2022 Feb 10;13:783495. doi: 10.3389/fimmu.2022.783495. eCollection 2022. Front Immunol. 2022. PMID: 35222371 Free PMC article.
-
Development and validation of a novel lipid metabolism-related gene prognostic signature and candidate drugs for patients with bladder cancer.Lipids Health Dis. 2021 Oct 27;20(1):146. doi: 10.1186/s12944-021-01554-1. Lipids Health Dis. 2021. PMID: 34706720 Free PMC article.
-
Prognostic Implications of Metabolism Related Gene Signature in Cutaneous Melanoma.Front Oncol. 2020 Sep 9;10:1710. doi: 10.3389/fonc.2020.01710. eCollection 2020. Front Oncol. 2020. PMID: 33014847 Free PMC article.
Cited by
-
In Vitro and In Silico Evaluation of the Potential Anti-Prostate Cancer Activity of Rosmarinus officinalis L. Leaf Extracts.Int J Mol Sci. 2025 May 13;26(10):4650. doi: 10.3390/ijms26104650. Int J Mol Sci. 2025. PMID: 40429793 Free PMC article.
-
Prognosis and diagnosis of prostate cancer based on hypergraph regularization sparse least partial squares regression algorithm.Aging (Albany NY). 2024 May 31;16(11):9599-9624. doi: 10.18632/aging.205889. Epub 2024 May 31. Aging (Albany NY). 2024. PMID: 38829766 Free PMC article.
-
Transcriptome Data Reveal Geographic Heterogeneity in Gene Expression in Patients with Prostate Cancer.Rep Biochem Mol Biol. 2023 Apr;12(1):92-101. doi: 10.52547/rbmb.12.1.92. Rep Biochem Mol Biol. 2023. PMID: 37724140 Free PMC article.
References
-
- Lalonde E., Ishkanian A. S., Sykes J., et al. Tumour genomic and microenvironmental heterogeneity for integrated prediction of 5-year biochemical recurrence of prostate cancer: a retrospective cohort study. The Lancet Oncology . 2014;15(13):1521–1532. doi: 10.1016/s1470-2045(14)71021-6. - DOI - PubMed
LinkOut - more resources
Full Text Sources
Research Materials

