. 2022 Jul 1:16:100342.
doi: 10.1016/j.mtbio.2022.100342. eCollection 2022 Dec.

A 3D bioprinted nano-laponite hydrogel construct promotes osteogenesis by activating PI3K/AKT signaling pathway

Affiliations

A 3D bioprinted nano-laponite hydrogel construct promotes osteogenesis by activating PI3K/AKT signaling pathway

Sheng Miao et al. Mater Today Bio. .

Abstract

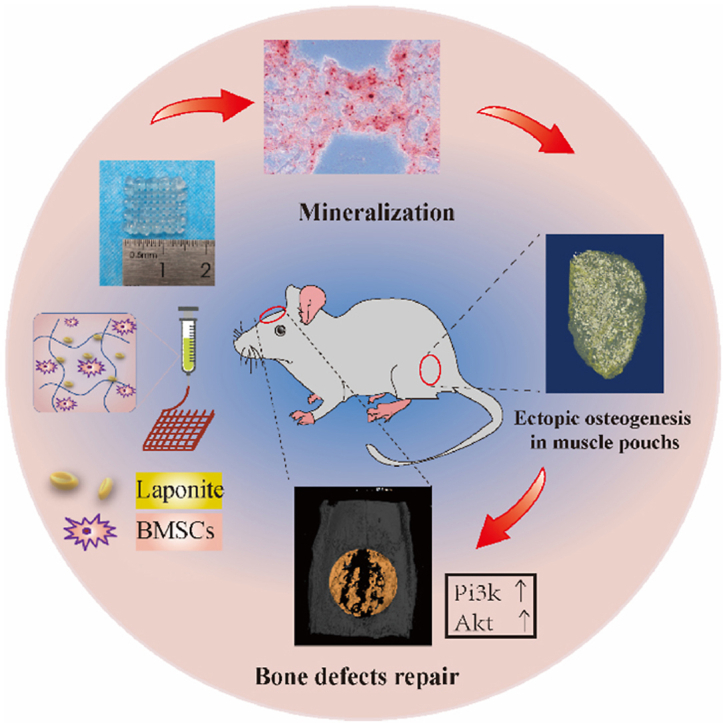
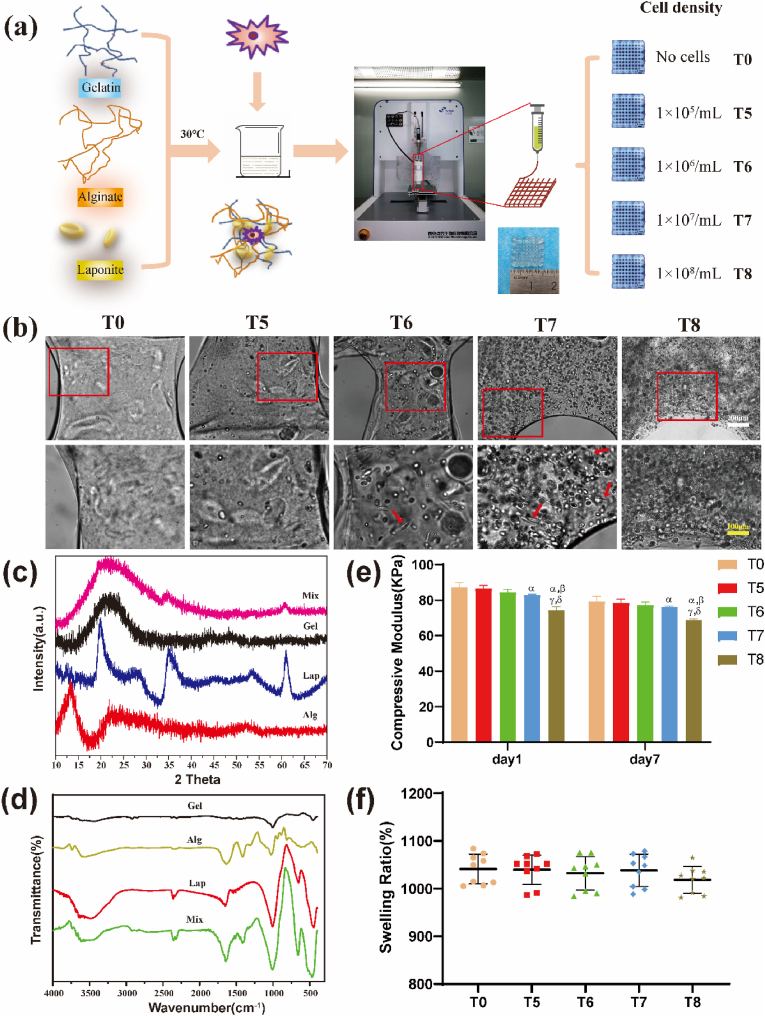
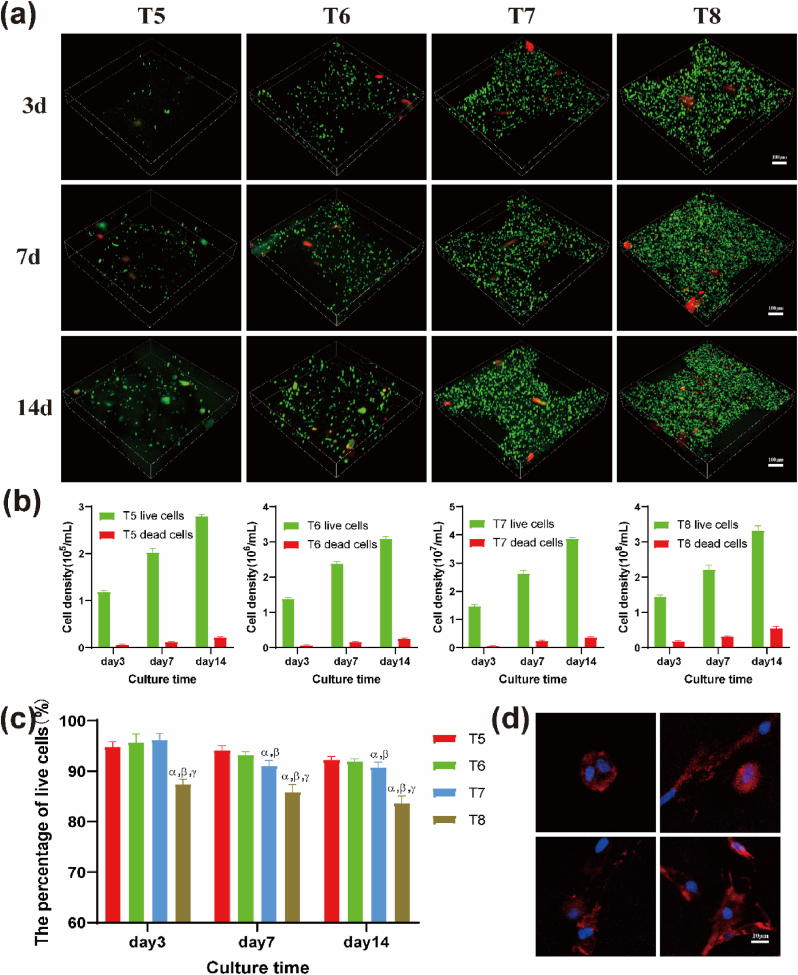
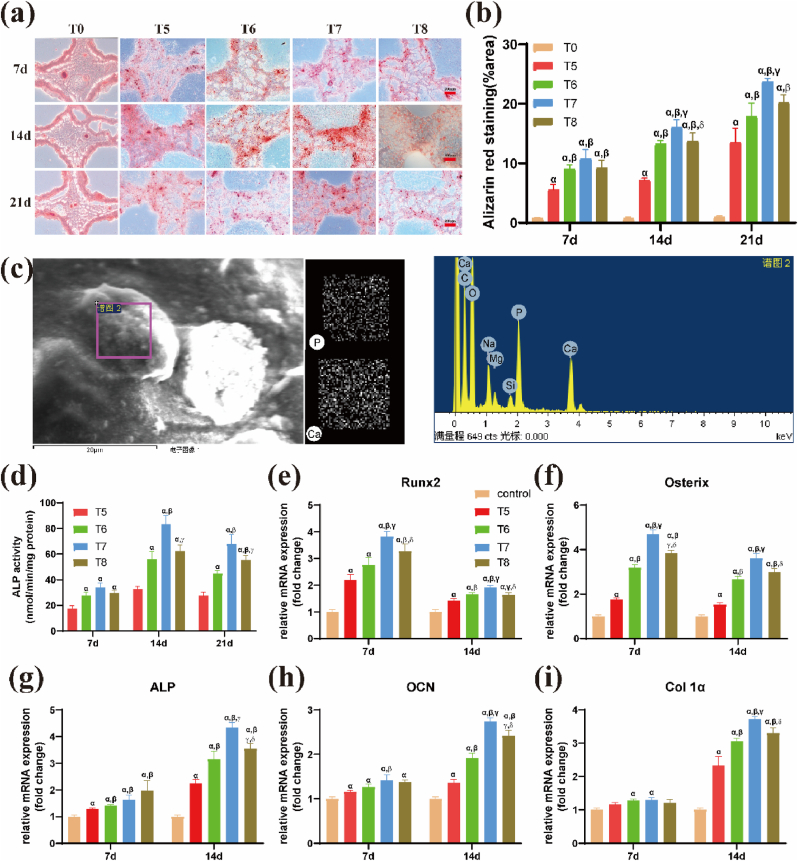
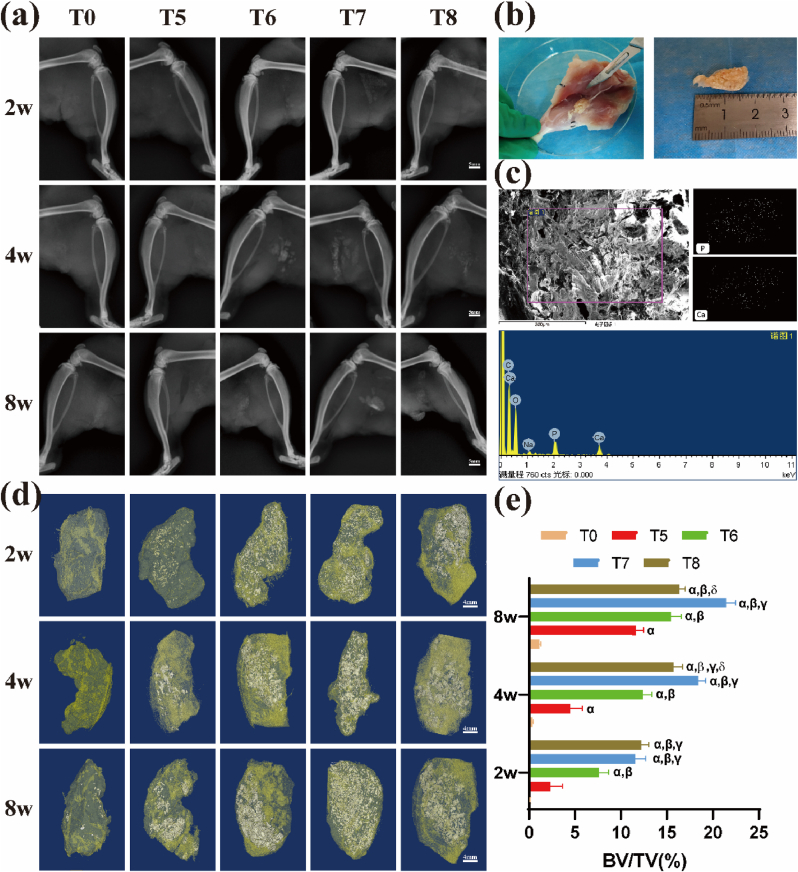
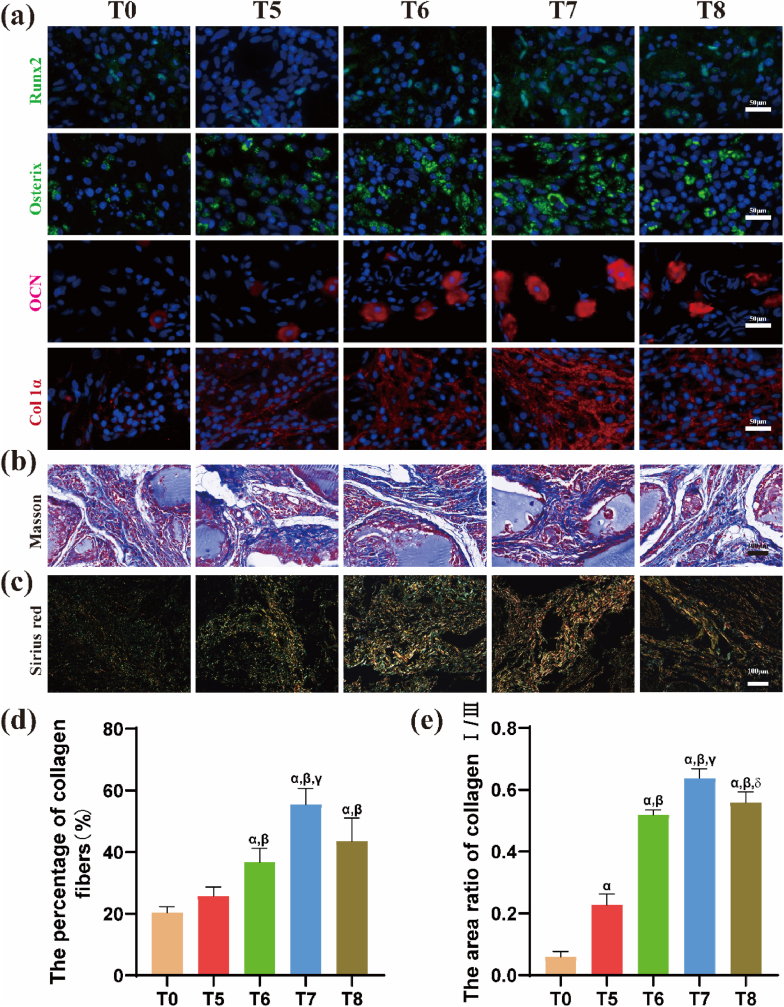
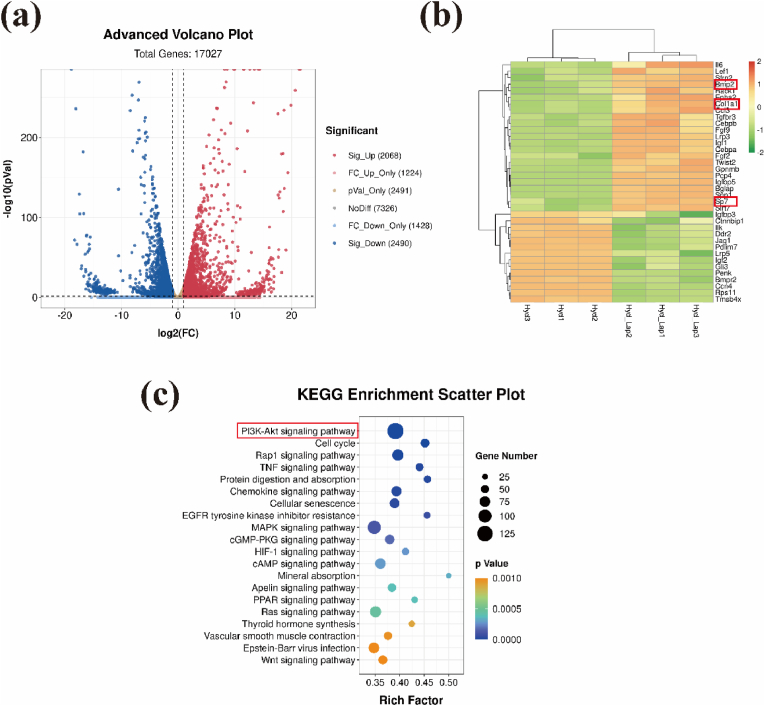
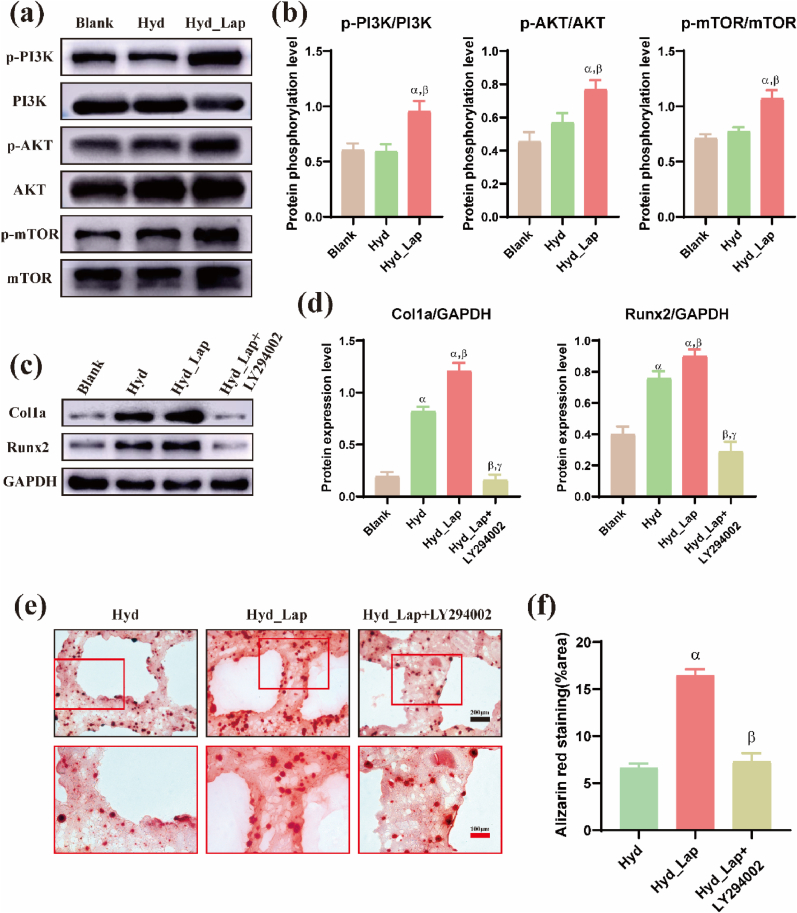
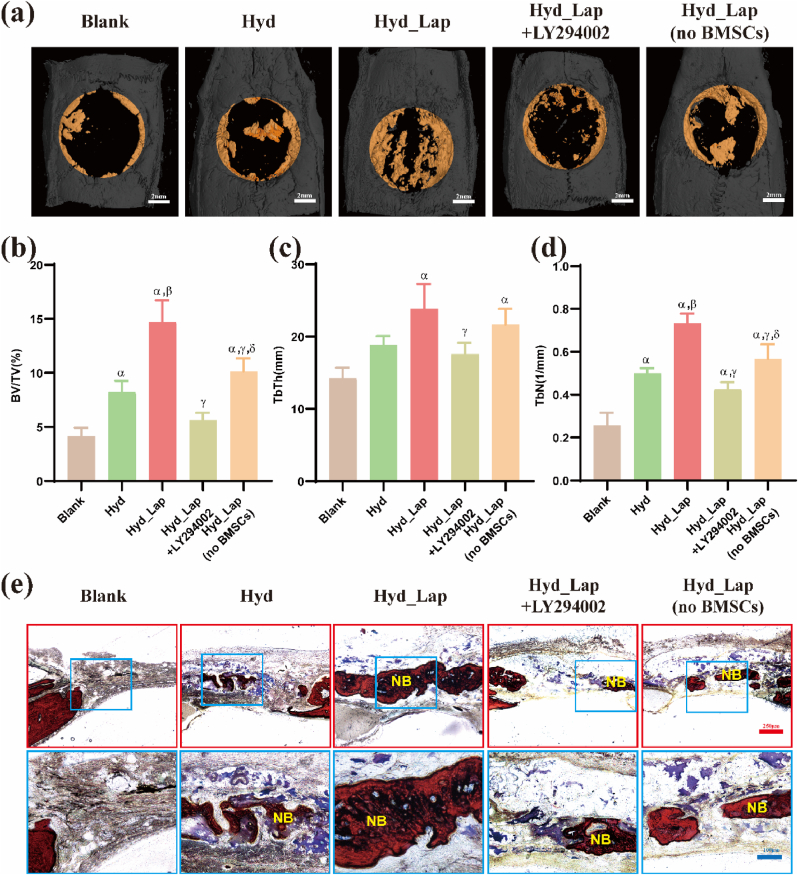
Development of nano-laponite as bioinks based on cell-loaded hydrogels has recently attracted significant attention for promoting bone defect repairs and regeneration. However, the underlying mechanisms of the positive function of laponite in hydrogel was not fully explored. In this study, the effect of 3D bioprinted nano-laponite hydrogel construct on bone regeneration and the potential mechanism was explored in vitro and in vivo. In vitro analyses showed that the 3D construct protected encapsulated cells from shear stresses during bioprinting, promoted cell growth and cell spreading, and BMSCs at a density of 107/mL exhibited an optimal osteogenesis potential. Osteogenic differentiation and ectopic bone formation of BMSCs encapsulated inside the 3D construct were explored by determination of calcium deposition and x-ray, micro-CT analysis, respectively. RNA sequencing revealed that activation of PI3K/AKT signaling pathway of BMSCs inside the laponite hydrogel significantly upregulated expression of osteogenic related proteins. Expression of osteogenic proteins was significantly downregulated when the PI3K/AKT pathway was inhibited. The 3D bioprinted nano-laponite hydrogel construct exhibited a superior ability for bone regeneration in rat bones with defects compared with groups without laponite as shown by micro-CT and histological examination, while the osteogenesis activity was weakened by applications of a PI3K inhibitor. In summary, the 3D bioprinted nano-laponite hydrogel construct promoted bone osteogenesis by promoting cell proliferation, differentiation through activation of the PI3K/AKT signaling pathway.

Keywords: Bioprinting; Cell density; Nano-laponite; Osteogenesis; Signal pathway.


Conflict of interest statement

The authors declare that they have no known competing financial interests or personal relationships that could have appeared to influence the work reported in this paper.

Figures

Image 1
Graphical abstract
Fig. 1
Fig. 1
Preparation and characterization of 3D printed composite hydrogel biological scaffolds. (a) 3D printing preparation process of the biological scaffolds. Hydrogels were assigned to five groups according to densities of loaded cells. (b) Cells were evenly distributed in the hydrogel scaffold, with some of the cells being stretched in a spindle shape (red arrows) as observed under an optical microscope. Scale bars: white 200 ​μm, yellow 100 ​μm. (c) XRD patterns and (d) FTIR spectra of Gel, Alg, Lap and the Mixture after bioprinting. (e) Compression modulus of cell-loaded hydrogels on the day 1 and day 7 after preparation. (f) Swelling ratios of each group indicated that cell density had no significant effect on hydration performance of the hydrogels with high water contents. αP<0.05 vs T0; βP<0.05 vs T5; γP<0.05 vs T6; δP<0.05 vs T7. (For interpretation of the references to colour in this figure legend, the reader is referred to the Web version of this article.)
Fig. 2
Fig. 2
Survival, proliferation rate and growth status of BMSCs 3D cultured in hydrogel scaffolds at different cell densities. (a) Live/dead stain images of BMSCs in 3D printed hydrogel scaffolds at different cell densities after 3, 7, and 14 days of culture in vitro (green represents live cells, red represents dead cells). Scale bar: 100 ​μm. Statistics of the proliferation (b) and survival rate (c) of BMSCs in each group of hydrogel scaffolds after culturing for 3, 7, and 14 days. (d) Images of F-actin staining of BMSCs cytoskeleton in the T7 group on the day 7 of culture showing cell division and contact with adjacent cells under a randomly selected field of view. Scale bar: 10 ​μm αp<0.05 vs T5; βp<0.05 vs T6; γp<0.05 vs T7. (For interpretation of the references to colour in this figure legend, the reader is referred to the Web version of this article.)
Fig. 3
Fig. 3
Effects of density of BMSCs on osteogenic differentiation and mineralization of 3D bio-printed hydrogel scaffolds. (a) Mineralization of hydrogel scaffolds with different densities of BMSCs in vitro for day 7, 14, and 21 as shown by alizarin red staining. (b) Quantitation of mineralization levels of hydrogels. Scale bar: 200 ​μm αp<0.05 vs T0; βp<0.05 vs T5; γp<0.05 vs T6; δp<0.05 vs T7. (c) Elemental composition of mineralized nodules as determined by Energy Dispersive X-ray Spectroscopy (EDS). Scanning electron micrograph of mineralized nodules, elemental distribution of P and Ca elements, and the spectrum of various elemental compositions are shown. (d) Quantitative assays of Alkaline phosphatase (ALP) activity of encapsulated BMSCs in hydrogel scaffolds after culturing for 7, 14, and 21 days. αp<0.05 vs T5; βp<0.05 vs T6; γp<0.05 vs T7. Relative gene expression levels of osteogenic markers (e) Runt-related transcription factor 2 (Runx2), (f) Osterix, (g) ALP, (h) osteocalcin (OCN) and (i) type I collagen (Col-1) of BMSCs after day 7 and day14 culture in the hydrogels. αp<0.05 vs control; βp<0.05 vs T5; γp<0.05 vs T6; δp<0.05 vs T7. (For interpretation of the references to colour in this figure legend, the reader is referred to the Web version of this article.)
Fig. 4
Fig. 4
Mineralized bone formation after ectopic implantation of 3D bio-printed hydrogel scaffolds with different densities of BMSCs. (a) X-ray images of rats' posterior gluteus muscle pouches implanted with biological scaffolds at week 2, 4 and 8. Scale bar: 5 ​mm. (b) A schematic illustration of isolation of mineralized biological scaffolds from rat posterior gluteal muscle pouches. (c) EDS energy spectrum analysis of mineralized scaffolds. Scanning electron micrographs of mineralized nodules, distribution of P and Ca elements, and spectrums of various elemental compositions are shown. (d) Micro-CT imaging of biological scaffolds with different densities of BMSCs implanted in rat muscle pouches after 2, 4, and 8 weeks (silver color represents mineralized bone, yellow represents fibrous soft tissue) and (e) the corresponding bone volume fraction. Scale bar: 4 ​mm αp<0.05 vs T0; βp<0.05 vs T5; γp<0.05 vs T6; δp<0.05 vs T7. (For interpretation of the references to colour in this figure legend, the reader is referred to the Web version of this article.)
Fig. 5
Fig. 5
Osteogenic differentiation after ectopic implantation of hydrogel scaffolds with different densities of BMSCs for 4 weeks. (a) Immunofluorescence staining images of osteogenic related proteins Runx2 (green), Osterix (green), OCN (red), and Col-1a (red). Cell nuclei stained in blue. Scale bar: 50 ​μm. (b) Masson staining of isolated tissues showing collagen deposition (blue), and (c) Collagen type I and Ⅲ (orange-yellow indicates type I collagen, blue-green indicates type III collagen) as observed after Sirius red staining. Scale bar: 100 ​μm. (d) Quantitative results of the area of collagen and (e) the ratio of type Ⅰ/Ⅲ collagen. αp<0.05 vs T0; βp<0.05 vs T5; γp<0.05 vs T6; δp<0.05 vs T7. (For interpretation of the references to colour in this figure legend, the reader is referred to the Web version of this article.)
Fig. 6
Fig. 6
Gene expression and analysis of biological activity of BMSCs cultured in Hyd_Lap and Hyd groups. (a) Volcano plots showing mRNA expression profiles of BMSCs cultured in the two groups (red represents upregulated genes, blue represents downregulated genes). (b) Heat map showing expression levels of osteogenesis-associated genes identified by GO enrichment analysis. (c) KEGG pathway gene enrichment analysis. The PI3K/AKT pathway, highlighted with a red box, was highly enriched. (For interpretation of the references to colour in this figure legend, the reader is referred to the Web version of this article.)
Fig. 7
Fig. 7
Laponite activates PI3K/AKT signal transduction pathway-related proteins (p-PI3K, p-AKT) of BMSCs in hydrogel scaffolds to promote osteogenic differentiation in vitro. Expression levels of target proteins as determined by western blotting (a) and phosphorylation levels of PI3K, AKT and mTOR proteins were significantly higher in Hyd_Lap group (b) compared with Blank and Hyd groups. αp<0.05 vs Blank; βp<0.05 vs Hyd. (c, d) Expression levels of Runx2 and Col 1α in Hyd_Lap group, Blank and Hyd groups. Protein levels of Runx2 and Col 1α were significantly suppressed in Hyd_Lap ​+ ​LY294002 group after treatment with LY294002. αp<0.05 vs Blank; βp<0.05 vs Hyd; γp<0.05 vs Hyd_Lap. (e, f) Mineralization nodules were higher in Hyd_Lap than in Hyd group, and treatment of LY294002 reduced mineralization nodules. Scale bars: black 200 ​μm; red 100 ​μm αp<0.05 vs Hyd; βp<0.05 vs Hyd_Lap. (For interpretation of the references to colour in this figure legend, the reader is referred to the Web version of this article.)
Fig. 8
Fig. 8
Bone repair effects of biological hydrogel scaffolds containing laponite using cranial defect rat models 8 weeks after implantation as determined by Micro-CT analysis and Van Gieson staining. (a) Micro-CT 3D reconstruction of new bone formation (yellow color indicates new bone). (b) New bone volume/tissue volume (BV/TV) ratio, (c) Trabecular bone thickness (TbTh) and (d) the number of trabecular bone (TbN) of the skull defect area in each group. αp<0.05 vs Blank; βp<0.05 vs Hyd; γp<0.05 vs Hyd_Lap. (e) Histological analysis of tissues by VG staining. NB: new bone. (For interpretation of the references to colour in this figure legend, the reader is referred to the Web version of this article.)

Similar articles

Cited by

References

    1. Baldwin P., Li D.J., Auston D.A., Mir H.S., Yoon R.S., Koval K.J. Autograft, allograft, and bone graft substitutes: clinical evidence and indications for use in the setting of orthopaedic trauma surgery. J. Orthop. Trauma. 2019;33(4):203. doi: 10.1097/BOT.0000000000001420. - DOI - PubMed
    1. Decante G., Costa J.B., Silva-Correia J., Collins M.N., Reis R.L., Oliveira J.M. Engineering bioinks for 3D bioprinting. Biofabrication. 2021;13(3) doi: 10.1088/1758-5090/abec2c. - DOI - PubMed
    1. Chen Y., Chen Y., Xiong X., Cui R., Zhang G., Wang C., Xiao D., Qu S., Weng J. Hybridizing gellan/alginate and thixotropic magnesium phosphate-based hydrogel scaffolds for enhanced osteochondral repair. Mater Today Bio. 2022;14 doi: 10.1016/j.mtbio.2022.100261. - DOI - PMC - PubMed
    1. Heinrich M.A., Liu W., Jimenez A., Yang J., Akpek A., Liu X., Pi Q., Mu X., Hu N., Schiffelers R.M., Prakash J., Xie J., Zhang Y.S. 3D bioprinting: from benches to translational applications. Small. 2019;15(23) doi: 10.1002/smll.201805510. - DOI - PMC - PubMed
    1. Sun W., Starly B., Daly A.C., Burdick J.A., Groll J., Skeldon G., Shu W., Sakai Y., Shinohara M., Nishikawa M., Jang J., Cho D.W., Nie M., Takeuchi S., Ostrovidov S., Khademhosseini A., Kamm R.D., Mironov V., Moroni L., Ozbolat I.T. The bioprinting roadmap. Biofabrication. 2020;12(2) doi: 10.1088/1758-5090/ab5158. - DOI - PubMed

LinkOut - more resources