. 2022 Apr;12(4):1840-1855.
doi: 10.1016/j.apsb.2021.10.016. Epub 2021 Oct 22.

Prmt1 upregulated by Hdc deficiency aggravates acute myocardial infarction via NETosis

Affiliations

Prmt1 upregulated by Hdc deficiency aggravates acute myocardial infarction via NETosis

Zhiwei Zhang et al. Acta Pharm Sin B. 2022 Apr.

Abstract

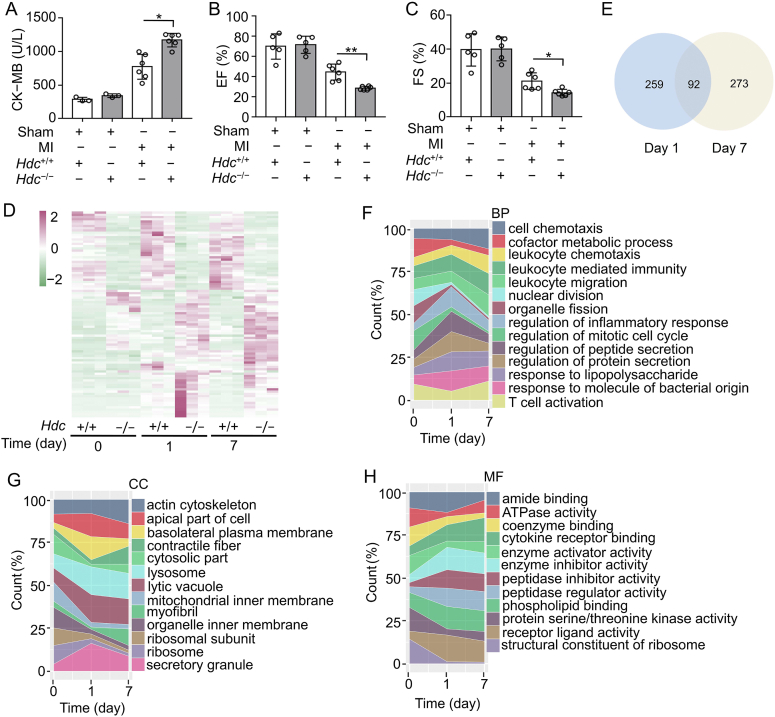
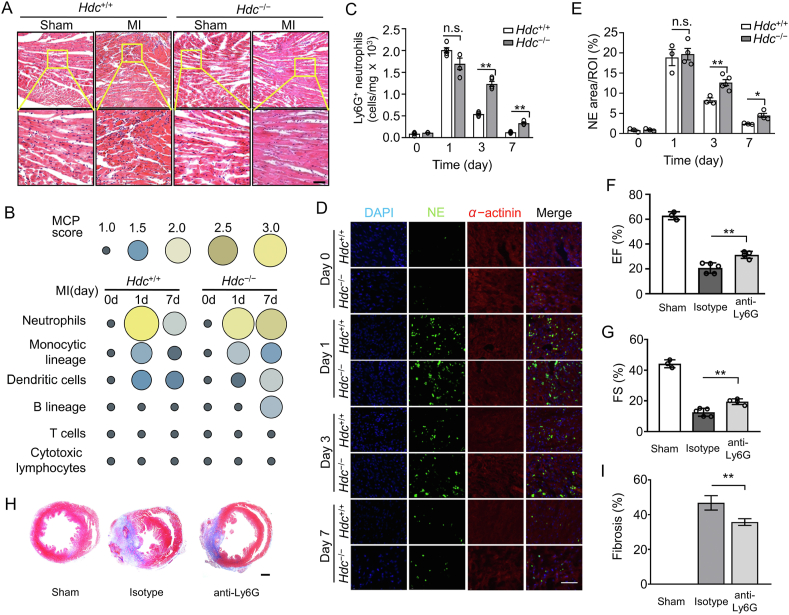
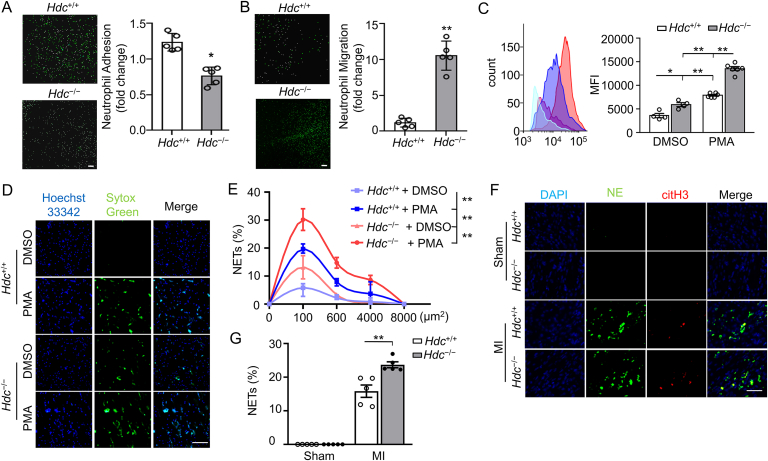
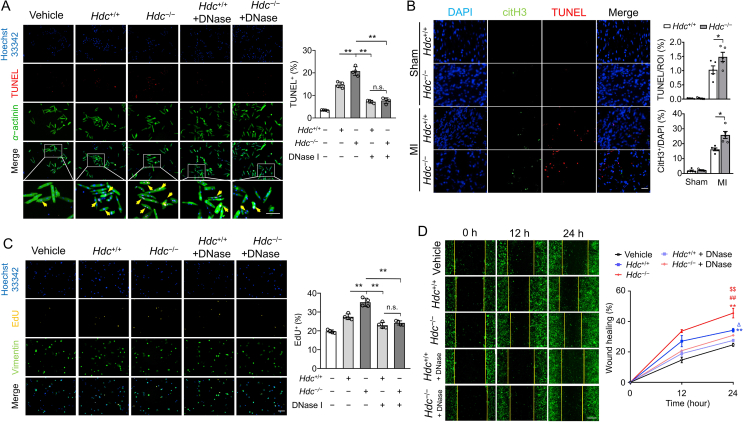
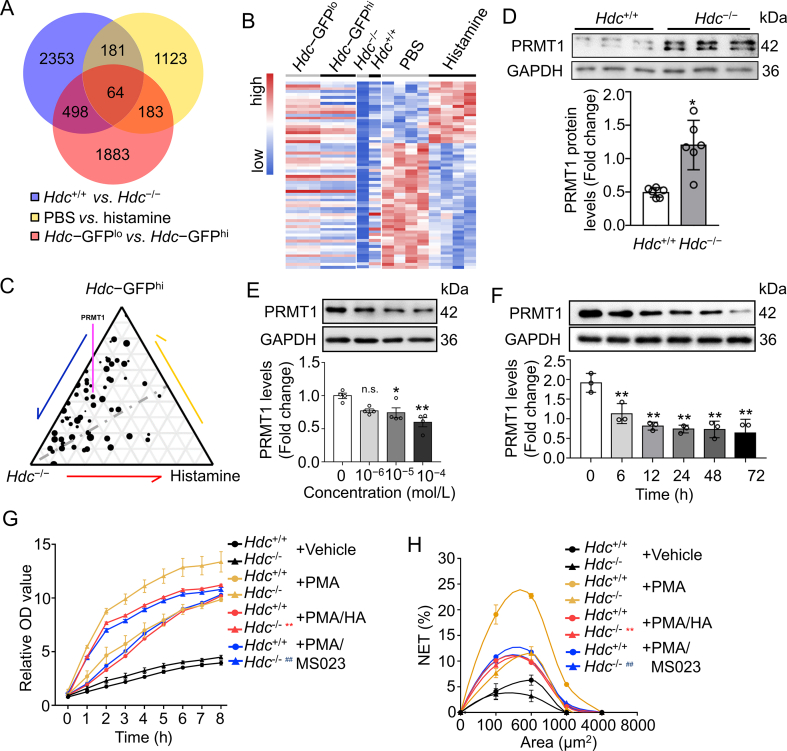
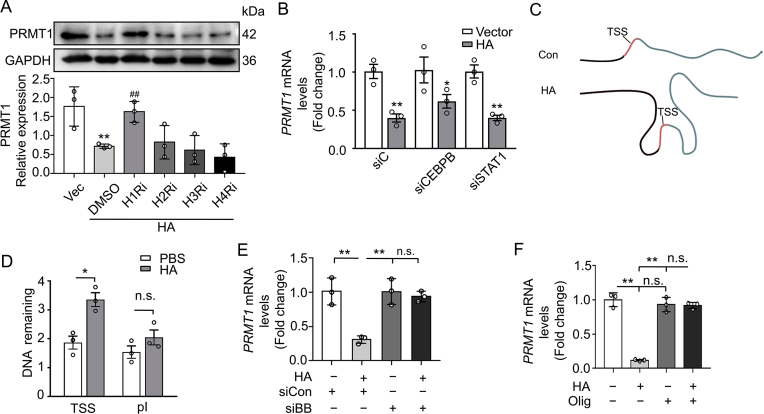
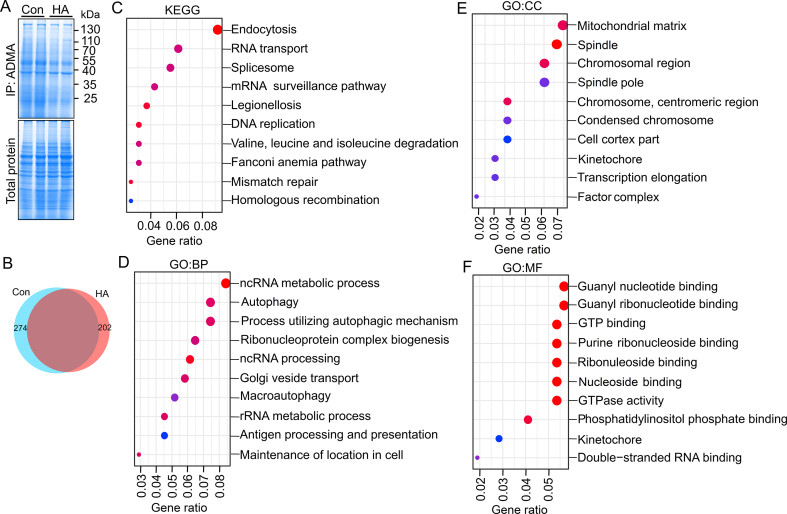
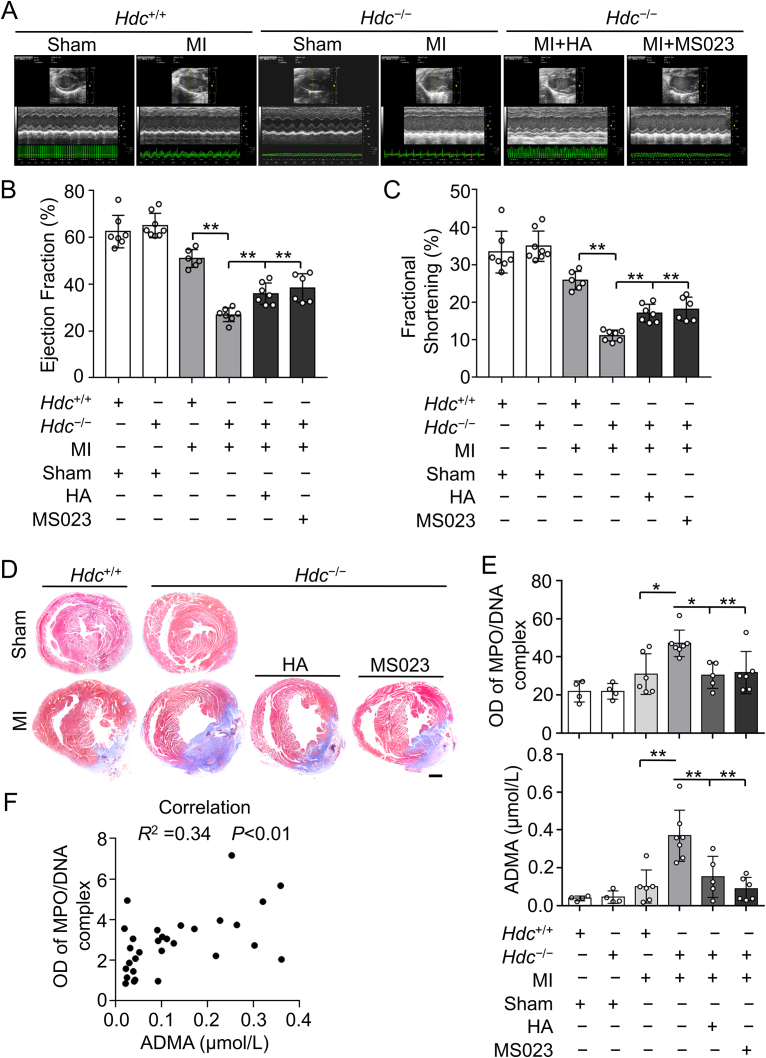
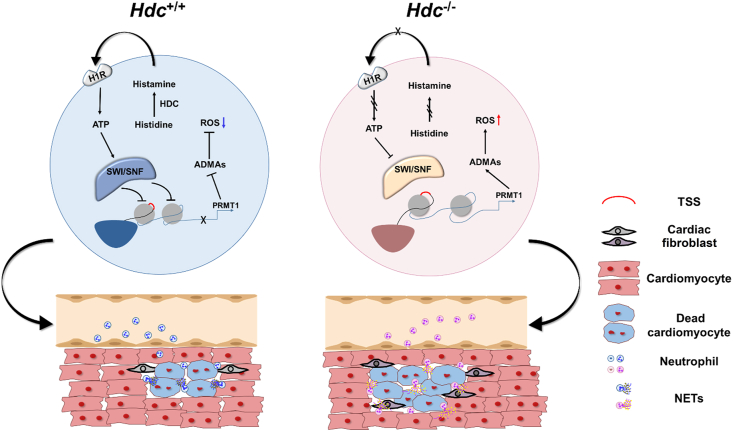
Neutrophils are mobilized and recruited to the injured heart after myocardial infarction, and neutrophil count has been clinically implicated to be associated with coronary disease severity. Histidine decarboxylase (HDC) has been implicated in regulating reactive oxidative species (ROS) and the differentiation of myeloid cells. However, the effect of HDC on neutrophils after myocardial infarction remains unclear. Here, we found that neutrophils were disorderly recruited into the ischemic injured area of the myocardium of Hdc deficiency (Hdc -/-) mice. Moreover, Hdc deficiency led to attenuated adhesion but enhanced migration and augmented ROS/neutrophil extracellular traps (NETs) production in neutrophils. Hdc -/- mouse-derived NETs promoted cardiomyocyte death and cardiac fibroblast proliferation/migration. Furthermore, protein arginine methyltransferase 1 (PRMT1) was increased in Hdc -/- mouse-derived neutrophils but decreased with exogenous histamine treatment. Its expression could be rescued by blocking histamine receptor 1 (H1R), inhibiting ATP synthesis or reducing SWItch/sucrose non fermentable (SWI/SNF) chromatin remodeling complex. Accordingly, histamine or MS023 treatment could decrease ROS and NETs ex vivo, and ameliorated cardiac function and fibrosis, along with the reduced NETs in plasma in vivo. Together, our findings unveil the role of HDC in NETosis by histamine-H1R-ATP-SWI/SNF-PRMT1-ROS signaling and provide new biomarkers and targets for identifying and tuning the detrimental immune state in cardiovascular disease.

Keywords: Asymmetric demethylation arginine; HDC; Myocardial infarction; Neutrophil extracellular trap; PRMT1; Transcriptomics.


Figures

Image 1
Graphical abstract
Figure 1
Figure 1
Hdc deficiency aggravates infarct injury and alters the cardiac transcriptome after MI. (A) Plasma levels of CK-MB from Hdc−/− and Hdc+/+ mice on Day 1 after ligation were determined by ELISA according to the manual instructions. (B and C) Quantitation of left ventricle ejection fraction (EF) and fractional shortening (FS) of Hdc−/− and Hdc+/+ mice on the 7th day after infarction. Data are shown as mean ± SEM (n = 6–8 mice in each group). P < 0.05, ∗∗P < 0.01. (D and E) Gene expression profiling of hearts from Hdc+/+ and Hdc−/− mice on Days 0, 1, and 7 after MI respectively. The heatmaps depicts up/down-regulated differentially expressed genes (DEGs) at the indicated time point (D). The number of DEGs and the overlap genes consistently differentially expressed on Days 1 and 7 after MI were shown in Venn diagram (E). n = 3 per group. (F–H) gene ontology (GO) analysis of DEGs between Hdc−/− and Hdc+/+ mice. The top 15 GO terms of biological process (BP, F), cellular component (CC, G) and molecular function (MF, H) at the indicated time points were shown.
Figure 2
Figure 2
Hdc deficiency changed the pattern of the infiltrated immune cells in particular of neutrophil in infarcted zone after MI. (A) Representative pictures of H&E staining of hearts from Hdc+/+ and Hdc−/− mice on Day 1 after MI surgery. (B) The size and the color indicate the MCP count score of the indicated immunocytes infiltrating into hearts on Days 1 and 7 after MI (n = 4–5). (C) Flow cytometry analysis of the numbers of Ly6G+ neutrophils in the hearts of Hdc−/− and Hdc+/+ mice on Days 1 and 7 after MI or sham operation. (D) Representative images of immunofluorescence staining of neutrophil elastase (NE) and α-actinin in the infarct border zone on Days 1 and 7 after MI or sham operation. (E) Quantification of NE positive neutrophils in the infarct border zone. n = 3–5 per group. (F) Quantitation of left ventricle ejection fraction (LVEF) and FS of Hdc−/− mice injected with anti-Ly6G antibody or its isotype after infarction. n = 3–5 mice in each group. (G) Representative images and quantitation of Masson staining of hearts from Hdc−/− mice injected with anti-Ly6G antibody or its isotype on Day 7 after infarction. n = 3–5 mice in each group. Data are shown as mean ± SEM. P < 0.05, ∗∗P < 0.001. n.s., no significant. Scale bar, 50 μm.
Figure 3
Figure 3
Hdc deficiency dysregulates the characteristic cellular activities of neutrophils. (A) Calcein-AM-labeled neutrophils isolated from the bone marrow of Hdc−/− and Hdc+/+ mice were incubated with HUVECs. The percentage values of Calcein-AM+ adherent cells were measured after washing (n = 4). (B) Calcein-AM-labeled neutrophils isolated from the bone marrow of Hdc−/− and Hdc+/+ mice were cultured in Transwell plate to assess migration capacity. Green fluorescence showed the migrated cells across Transwell (n = 4). (C) FACS analysis of the generation of ROS in Hdc−/− and Hdc+/+ mice derived neutrophils before and after PMA treatment (n = 4–6). (D) Representative pictures of immunofluorescence staining of Hdc−/− and Hdc+/+ neutrophils after exposure to PMA for 18 h with Sytox green and Hoechst 33342 (blue). (E) The areas of Sytox green+ NETs derived from Hdc−/− and Hdc+/+ neutrophils were quantified (n = 4). (F) Representative images of immunofluorescence co-staining of NE (green), citH3 (red), and DAPI (blue) in cardiac slices of Hdc−/− and Hdc+/+ mouse on Days 1 and 7 after MI or shame operation (n = 4–5). (G) Percentage values of neutrophils with evidence of NET formation (NE+/citH3+) in the cardiac slices of Hdc−/− and Hdc+/+ mice were analyzed (n = 5). Data are shown as mean ± SEM. P < 0.05, ∗∗P < 0.01. Scale bar: 50 μm.
Figure 4
Figure 4
Hdc deficiency in neutrophils augments cardiomyocytes death and cardiac fibroblasts proliferation/migration through NETosis. (A) Representative images of TUNEL assay of cardiomyocytes treated with NETs from Hdc−/− and Hdc+/+ neutrophils under hypoxia condition. DNase I was employed to interrupt the structure of NET. TUNEL positive cells are shown in red. α-Actinin positive cardiomyocytes are displayed as green. Nucleus is stained with Hoechst 33342, in blue. Percentage values of TUNEL+ cells were calculated and are shown as mean ± SEM (n = 4–5). ∗∗P < 0.01; n.s., no significant. (B) Representative images of immunofluorescence co-staining of citH3 (green), TUNEL (red) and DAPI (blue) in cardiac slices of Hdc−/− and Hdc+/+ mice on Day 1 after MI or sham operation. The percentage values of citH3+ NETs and TUNEL+ cells were quantified and are shown as mean ± SEM (n = 5). P < 0.05. (C) Representative images of EdU (red), Vimentin (green), DAPI (blue) co-staining for fibroblasts treated with NETs from Hdc−/− and Hdc+/+ neutrophils. DNase I was employed to interrupt the formation of NETs. The percentage values of EdU + cells were calculated and are shown as mean ± SEM (n = 4–5). ∗∗P < 0.01; n.s., no significant. (D) Representative images of fibroblast migration assay. A confluent monolayer of fibroblasts was scraped with 200 μL pipette tip and co-cultured with NETs from Hdc−/− and Hdc+/+ neutrophils for 24 h. DNase I was employed to interrupt the formation of NETs. The ratios of wound healing were quantified and are shown as mean ± SEM (n = 3). ∗∗P < 0.01 vs. vehicle group; ΔP < 0.05 vs. Hdc+/+ + DNase; ##P < 0.01 vs. Hdc+/+ group; $$P < 0.01 vs. Hdc−/− group. Scale bar: 50 μm.
Figure 5
Figure 5
PRMT1 is negatively regulated by histamine in myeloid cells. (A) The Venn diagram shows the numbers of significantly DEGs in the paired groups of Hdc−/−vs. Hdc+/+ myeloid cells (blue), with vs. without histamine treated myeloid cells (yellow), Hdc high expressed (Hdc-GFPhi) vs. following Hdc low expressed (Hdc-GFPlo) myeloid cells (red). 64 DEGs were identified in all three paired groups. (B) The heatmaps of the shared 64 DEGs from the above three paired groups. (C) Triangle plot shows the increased/decreased expression of the 64 DEGs in the indicated groups. (D) The representative images of Western blots of the protein levels of PRMT1 in neutrophils isolated from the bone marrow of Hdc−/− and Hdc+/+ mice (n = 6). Data are shown as mean ± SEM. P < 0.05 vs. vehicle group. (E) The representative images of Western blots of the protein levels of PRMT1 in HL60 cells treated with the indicated doses of histamine for 24 h (n = 3). Data are shown as mean ± SEM. P < 0.05, ∗∗P < 0.01 vs. vehicle group; n.s. no significant. (F) The representative images of Western blots of the protein levels of PRMT1 in HL60 cells treated with 10−4 mol/L histamine for the indicated time (n = 3). Data are shown as mean ± SEM. ∗∗P < 0.01 vs. vehicle group. (G) The relative ROS levels produced in neutrophils from Hdc−/− and Hdc+/+ mice were determined after the treatment of PMA along with histamine (HA) or PRMT1 inhibitor (MS023). ∗∗P < 0.01, Hdc−/− + PMA vs. Hdc−/− + PMA/HA; ##P < 0.01, Hdc−/− + PMA vs. Hdc−/− + PMA/MS023. Data are shown as mean ± SEM (n = 4). (H) The areas of NETs formed by neutrophils isolated from Hdc−/− and Hdc+/+ mice were calculated after the treatment of PMA along with HA or MS023. ∗∗P < 0.01, Hdc−/− + PMA vs. Hdc−/− + PMA/HA; ##P < 0.01, Hdc−/− + PMA vs. Hdc−/− + PMA/MS023. Data are shown as mean ± SEM (n = 4).
Figure 6
Figure 6
Histamine repressed the transcription of PRMT1 through restricting DNA accessibility of the TSS region of PRMT1. (A) HL60 cells were stimulated with histamine (100 μmol/L) for 12 h in the presence of specific antagonists for H1 receptor (pyrilamine, 10 μmol/L), H2 receptor (cimetidine, 10 μmol/L), H3 receptor (thioperamide, 10 μmol/L), or H4 receptor (JNJ-7777120, 10 μmol/L). HA, histamine. Data are shown as mean ± SEM (n = 4). ∗∗P < 0.01 vs. vector group; ##P < 0.01 vs. HA treated group. (B) HL60 cells were transfected with siRNA of scramble control (siC or siCon), CEBPB (siCEBPB), or STAT1 (siSTAT1), along with HA treatment. The mRNA levels of PRMT1 were analyzed by qRT-PCR (n = 3). Data are shown as mean ± SEM. P < 0.05, ∗∗P < 0.01 vs. vector group. (C) Schematic of the PRMT1 locus containing transcription start site (TSS, red) and the later part (blue). Con, control. (D) HL60 cells were treated with or without 10−4 mol/L HA for 12 h. DNase sensitivity assay was performed on the TSS and the intron of prior locus (pl) of PRMT1. The statistical results are shown as mean ± SEM (n = 3). P < 0.05. (E) The mRNA levels of PRMT1 in HL60 treated with HA and/or oligomycin were determined by qRT-PCR. n = 3. ∗∗P < 0.01. (F) HL60 cells were transfected with siC, BRG1/BRM (siBB), along with HA treatment. The mRNA levels of PRMT1 were analyzed by qRT-PCR (n = 3). ∗∗P < 0.01; n.s., no significant.
Figure 7
Figure 7
The asymmetric dimethylated arginine (ADMA) profiling of PRMT1 targets were regulated by HA. (A) Coomasie blue staining of proteins with ADMA from HL60 cells with/without HA treatment. (B) The Venn diagram shows the proteins with ADMA in control and HA treated groups. 274 proteins were detected uniquely in the control group and 202 proteins uniquely in the HA treated group. (C) KEGG pathway enrichment analysis for the differentially expressed proteins uniquely detected in control and HA treated groups. The Rich ratio of x-axis refers to the ratio of selected gene numbers annotated in this pathway terms to all gene numbers annotated in this pathway term. The calculating formula is Rich ratio = term candidate gene number/term gene number. The size and color of the bubbles represent the number of differentially expressed proteins enriched in the pathway and enrichment significance, respectively. (D–F) GO of BP (D), CC (E), and MF (F). Enrichment analysis of histamine regulated proteins with ADMA modification were shown. The size and color of the bubbles represent the number of differentially expressed proteins enriched in the pathway and enrichment significance, respectively.
Figure 8
Figure 8
Inhibiting the activity of PRMT1 can rescue the aggravation of myocardial injury caused by Hdc deficiency after MI. (A) Representative echocardiographic images of Hdc−/− and Hdc+/+ mice on Day 7 after ligation. Hdc−/− and Hdc+/+ mice were intravenous injected with HA or MS023 prior to surgery. (B and C) Quantitation of LVEF and FS of Hdc−/− and Hdc+/+ mice 7 days after infarction. n = 6–8 mice in each group. Data are shown as mean ± SEM. ∗∗P < 0.01. (D) Representative images of Masson staining of hearts from Hdc−/− and Hdc+/+ mice. Hdc−/− and Hdc+/+ mice were intravenous injected with HA or MS023 prior to surgery. Scale bar, 50 μm. (E) MPO/DNA and ADMA levels in plasma from Hdc−/− and Hdc+/+ mice on Day 7 after ligation were determined by ELISA according to the manual instructions. Hdc−/− and Hdc+/+ mice were intravenous injected with HA or MS023 prior to surgery. Data are shown as mean ± SEM. P < 0.05, ∗∗P < 0.01, n = 6–8 mice in each group. (F) Correlation of MPO/DNA and ADMA levels in plasma from Hdc−/− and Hdc+/+ mice on Day 7 after ligation. Hdc−/− and Hdc+/+ mice were intravenous injected with HA or MS023 prior to surgery. R2 = 0.34, P < 0.01. Data are shown as mean ± SEM, n = 30.
Figure 9
Figure 9
Schematic illustration of the effect of HDC on neutrophils after MI. In neutrophils, autocrine, paracrine, or exogenous of histamine, by activating histamine H1 receptor, repress PRMT1 expression, ADMA production, and ROS generation by ATP–SWI/SNF dependent chromatin remodeling. After MI, the deletion of Hdc, without endogenous or exogenous histamine, aggravates cardiomyocyte death and fibrosis, by enhanced neutrophil infiltration and ROS dependent NETosis.

Similar articles

Cited by

References

    1. Ding S., Abudupataer M., Zhou Z., Chen J., Li H., Xu L., et al. Histamine deficiency aggravates cardiac injury through miR-206/216b-Atg13 axis-mediated autophagic-dependant apoptosis. Cell Death Dis. 2018;9:694. - PMC - PubMed
    1. Opie L.H., Commerford P.J., Gersh B.J., Pfeffer M.A. Controversies in ventricular remodelling. Lancet. 2006;367:356–367. - PubMed
    1. Frantz S., Bauersachs J., Ertl G. Post-infarct remodelling: contribution of wound healing and inflammation. Cardiovasc Res. 2009;81:474–481. - PMC - PubMed
    1. Silvestre-Roig C., Braster Q., Ortega-Gomez A., Soehnlein O. Neutrophils as regulators of cardiovascular inflammation. Nat Rev Cardiol. 2020;17:327–340. - PubMed
    1. Leoni G., Soehnlein O. (Re) solving repair after myocardial infarction. Front Pharmacol. 2018;9:1342. - PMC - PubMed

LinkOut - more resources