. 2022 Apr;12(4):1899-1912.
doi: 10.1016/j.apsb.2021.10.001. Epub 2021 Oct 14.

Disruption of adipocyte HIF-1 α improves atherosclerosis through the inhibition of ceramide generation

Affiliations

Disruption of adipocyte HIF-1 α improves atherosclerosis through the inhibition of ceramide generation

Pengcheng Wang et al. Acta Pharm Sin B. 2022 Apr.

Abstract

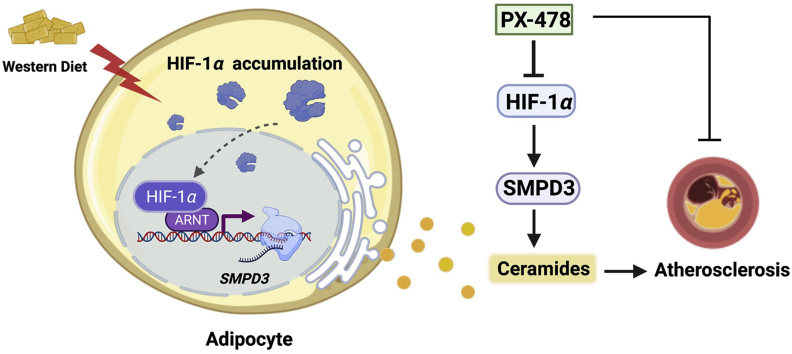
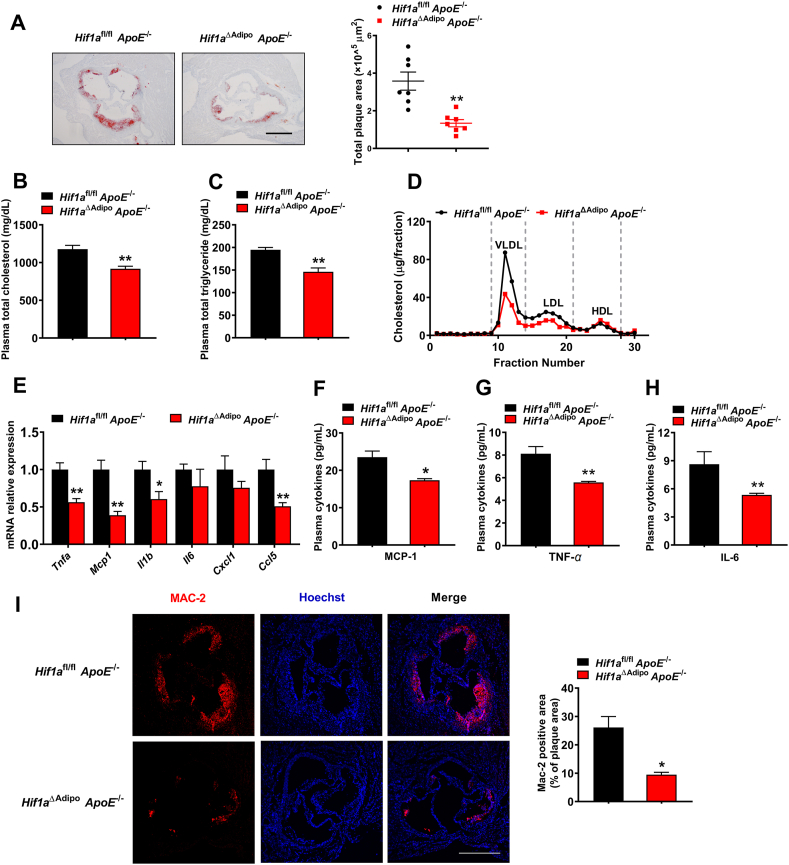
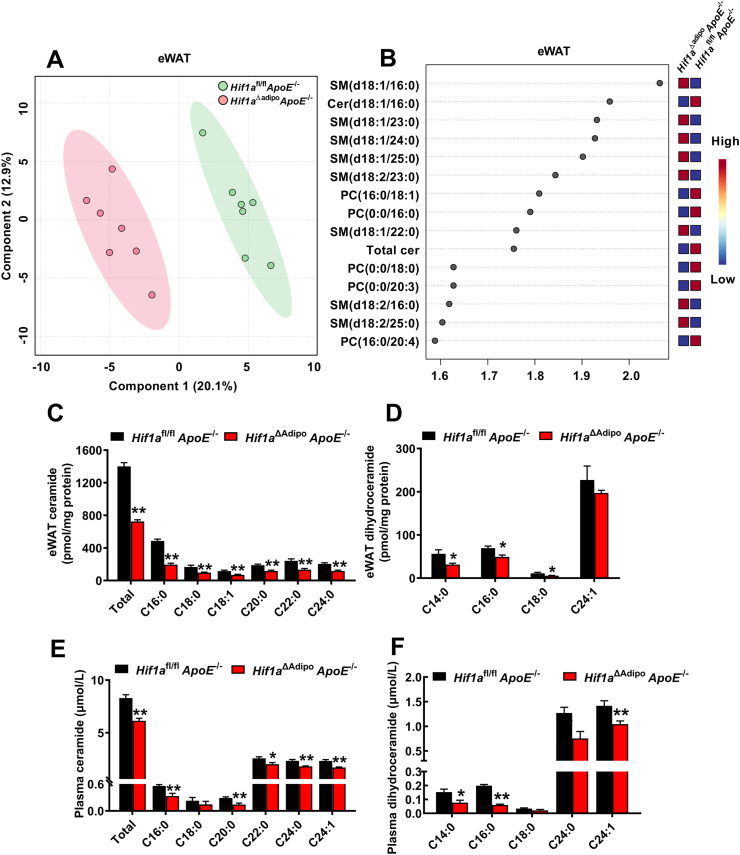
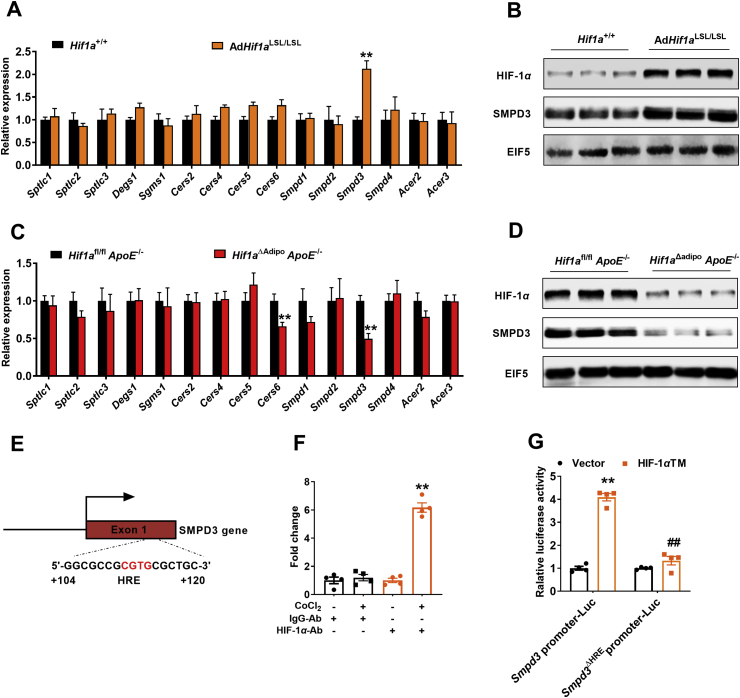
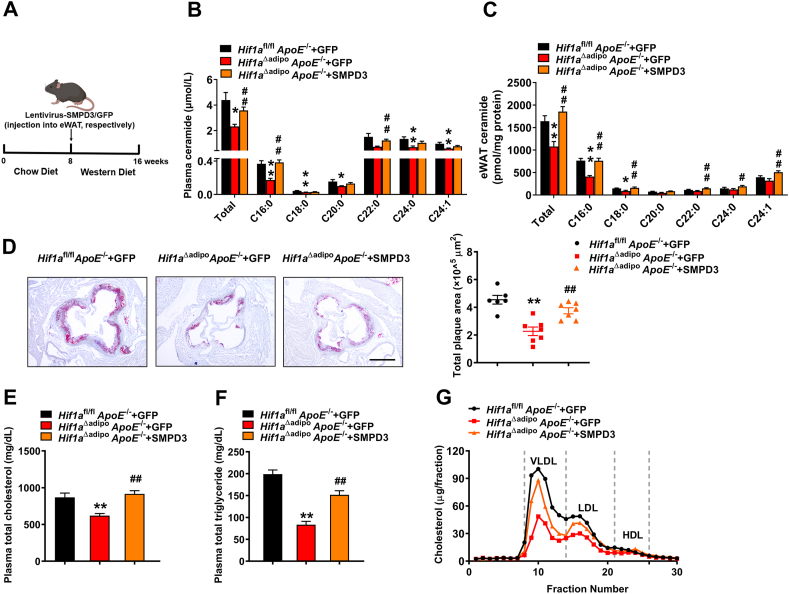
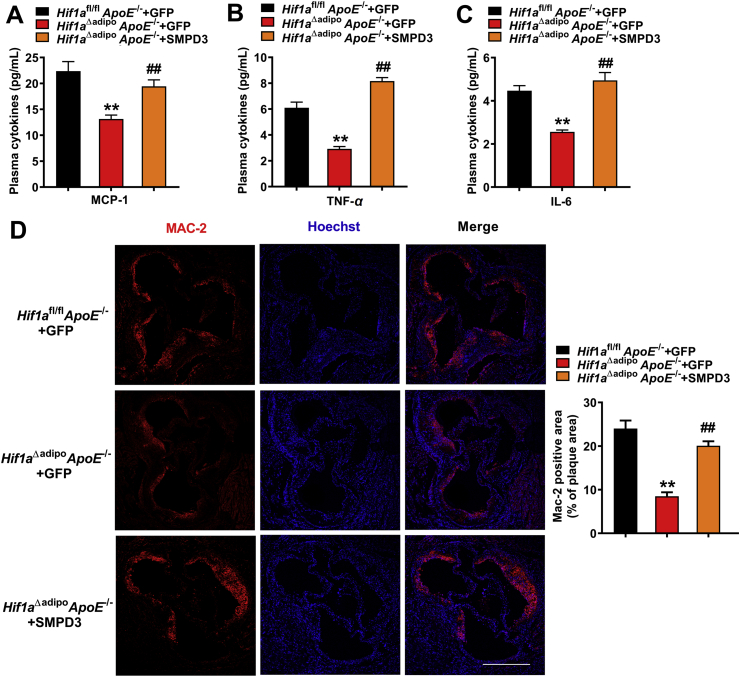
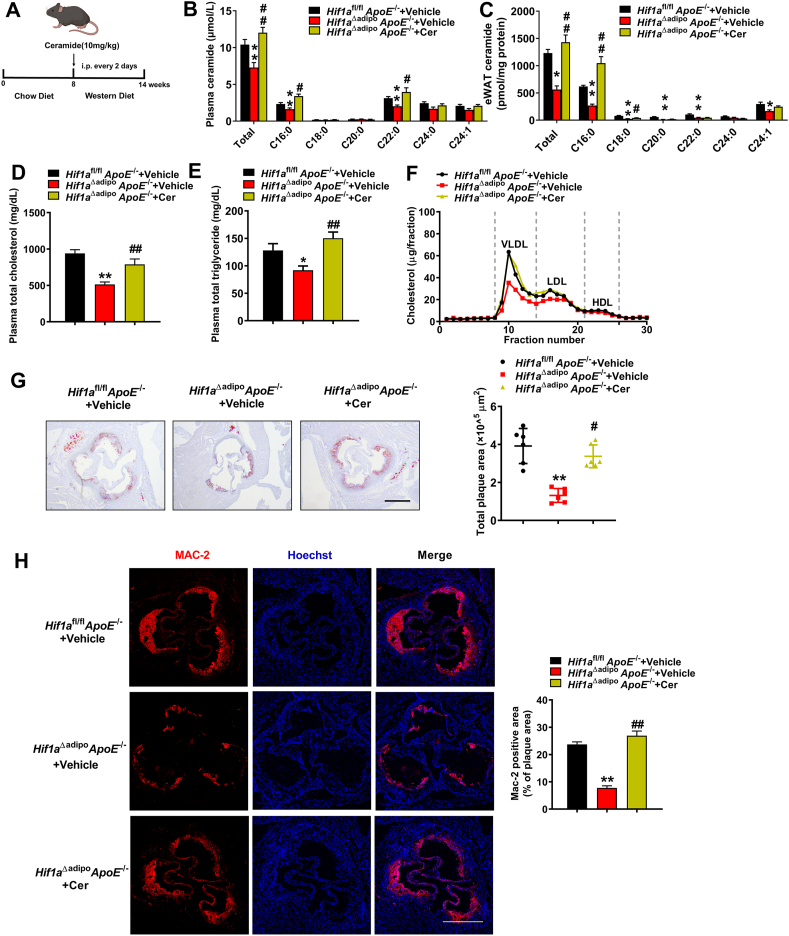
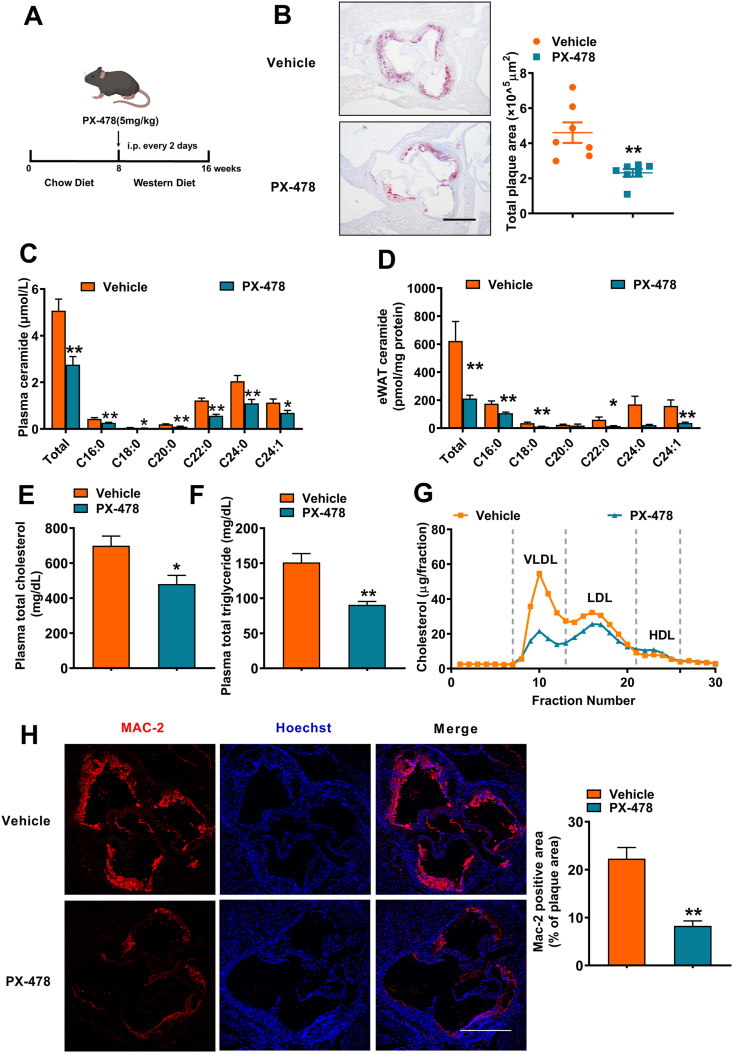
Atherosclerosis is a chronic multifactorial cardiovascular disease. Western diets have been reported to affect atherosclerosis through regulating adipose function. In high cholesterol diet-fed ApoE -/- mice, adipocyte HIF-1α deficiency or direct inhibition of HIF-1α by the selective pharmacological HIF-1α inhibitor PX-478 alleviates high cholesterol diet-induced atherosclerosis by reducing adipose ceramide generation, which lowers cholesterol levels and reduces inflammatory responses, resulting in improved dyslipidemia and atherogenesis. Smpd3, the gene encoding neutral sphingomyelinase, is identified as a new target gene directly regulated by HIF-1α that is involved in ceramide generation. Injection of lentivirus-SMPD3 in epididymal adipose tissue reverses the decrease in ceramides in adipocytes and eliminates the improvements on atherosclerosis in the adipocyte HIF-1α-deficient mice. Therefore, HIF-1α inhibition may constitute a novel approach to slow atherosclerotic progression.

Keywords: ACER2/3, alkaline ceramidase 2/3; APOE, apolipoprotein E; ARNT, aryl hydrocarbon nuclear translocator; Adipocyte; Atherosclerosis; CCL5, chemokine (C–C motif) ligand 5; CERS2/4/5/6, ceramide synthase 2/4/5/6; CXCL1, chemokine (C–X–C motif) ligand 1 protein; Ceramide; ChIP, chromatin immunoprecipitation; Cholesterol; CoCl2, cobalt(Ⅱ) chloride; DEGS1, delta(4)-desaturase, sphingolipid 1; EIF5, eukaryotic translation initiation factor 5; GFP, green fluorescent protein; HDL, high-density lipoprotein; HIF-1α; HIF-1α/2α/3α, hypoxia-inducible factor 1 alpha/2 alpha/3 alpha; HREs, HIF-response elements; IL-6/1β, interleukin-6/1β; Inflammatory responses; LDL, low-density lipoprotein; MAC-2, lectin, galactose binding, soluble 3; MCP-1, monocyte chemoattractant protein-1; PC, phosphatidylcholine; PLS-DA, partial least squares discriminant analysis; PX-478; SGMS1, sphingomyelin synthase 1; SM, sphingomyelin; SMPD1/2/3/4, sphingomyelin phosphodiesterase 1/2/3/4; SMPD3; SMase, sphingomyelinase; SPTLC1/2/3, serine palmitoyltransferase long chain base subunit 1/2/3; TNF-α, tumor necrosis factor alpha; VEGF, vascular endothelial growth factor; VIP, variable importance for the projection; VLDL, very low-density lipoprotein; eWAT, epididymal white adipose tissue.


Figures

Image 1
Graphical abstract
Figure 1
Figure 1
HIF-1α deficiency in adipocytes alleviates WD-induced atherosclerosis. Eight-week-old Hif1afl/flApoE–/– and Hif1aΔAdipoApoE–/– mice were fed a WD for 8 weeks. (A) Representative oil red O staining of cross-sections of aortic roots (n = 7 per group). Scale bar, 500 μm. (B, C) The levels of plasma total cholesterol (B) and triglyceride (C) in mice (n = 6 per group). (D) FPLC analysis of plasma cholesterol levels (n = 3 per group). (E) QPCR analysis of the Tnfa, Mcp1, Il1b, Il6, Cxcl1, and Ccl5 mRNA levels in aortas (n = 6 per group). (F–H) The levels of the plasma cytokines MCP-1 (F), TNF-α (G), and IL-6 (H) in mice (n = 6 per group). (I) Immunofluorescence staining of atherosclerotic lesions with MAC-2 antibody and calculated MAC-2 positive areas in the plaques (n = 3 per group). Scale bar, 500 μm. All data are presented as the mean ± SEM. Two-tailed Student's t-test (A–C, E–I): ∗P < 0.05, ∗∗P < 0.01 compared to the Hif1afl/flApoE–/– group. See also Fig. S1.
Figure 2
Figure 2
Adipocyte-specific HIF-1α ablation decreases ceramide generation. Eight-week-old Hif1afl/flApoE–/– and Hif1aΔAdipoApoE–/– mice were fed a WD for 8 weeks. (A) PLS-DA analysis of lipid metabolites in eWAT between the Hif1afl/flApoE–/– (green circle) and Hif1aΔAdipoApoE–/– (red circle) mice (n = 7 per group). (B) VIP score plot showing the top 15 lipid metabolites in eWAT. Normalized expression level of each metabolite in the Hif1aΔAdipoApoE–/– mice compared to the Hif1afl/flApoE–/– mice (n = 7 per group). (C, D) Quantitation of ceramide (C) and dihydroceramide (D) concentrations in eWAT (n = 7 per group). (E, F) Quantitation of ceramide (E) and dihydroceramide (F) concentrations in plasma (n = 7 per group). All data are presented as the mean ± SEM. Mann–Whitney U test (C, D) and two-tailed Student's t-test (E, F): ∗P < 0.05, ∗∗P < 0.01 compared to the Hif1afl/flApoE–/– group. See also Fig. S2.
Figure 3
Figure 3
The ceramide-generation-related gene Smpd3 is a novel target gene of adipocyte HIF-1α. (A) The mRNA levels of genes related to ceramide metabolism, including synthesis, transportation and elimination in the eWAT of the AdHif1aLSL/LSL and Hif1a+/+ mice (n = 6 per group). Two-tailed Student's t-test: ∗∗P < 0.01 compared to the Hif1a+/+ mice. (B) The protein levels of HIF-1α and SMPD3 in the eWAT of the AdHif1aLSL/LSL and Hif1a+/+ mice (n = 3 per group). (C) The mRNA levels of genes related to ceramide metabolism, including synthesis, transportation and elimination in the eWAT of the Hif1afl/flApoE–/– and Hif1aΔAdipoApoE–/– mice fed a WD for 8 weeks (n = 6 per group). Two-tailed Student's t-test: ∗∗P < 0.01 compared to the Hif1afl/flApoE–/– mice. (D) The protein levels of HIF-1α and SMPD3 in the eWAT of the Hif1afl/flApoE–/– and Hif1aΔAdipoApoE–/– mice mice fed a WD for 8 weeks (n = 3 per group). (E) Schematic diagram of the mouse Smpd3 promoter illustrating the predicted HRE in the regulatory region. The upstream regions are numbered in relation to the transcription initiation site, which is designated +1. (F) ChIP assays of 3T3-L1 adipocytes treated with CoCl2 (200 μmol/L) for 12 h (n = 4 per group). One-way ANOVA with Tukey's post hoc test: ∗∗P < 0.01 compared to the IgG-Ab group. (G) Luciferase reporter gene assay of Smpd3 promoter activity (n = 4 per group). One-way ANOVA with Dunnett's T3 post hoc test: ∗∗P < 0.01 compared to the Smpd3 promoter plasmid with vector group; ##P < 0.01 compared to the Smpd3 promoter plasmid with HIF-1α TM group.
Figure 4
Figure 4
Overexpression of SMPD3 in adipose tissue aggravates the progression of atherosclerosis. Eight-week-old Hif1afl/flApoE–/– and Hif1aΔAdipoApoE–/– mice were injected with lentivirus carrying mouse Smpd3 cDNA sequence or green fluorescent protein (GFP) and were fed a WD for 8 weeks. (A) Schematic diagram of the mouse model illustrating the concept of mouse injection with lentivirus-SMPD3/GFP. (B, C) Quantitation of ceramide concentrations in plasma (B) and eWAT (C), n = 6 per group. (D) Representative oil red O staining of cross-sections of aortic roots (n = 6–7 per group). Left, representative examples of cross-sections from the aortic root stained with oil red O. Scale bar, 500 μm. Right, quantification of aortic root lesion areas. (E, F) The levels of plasma total cholesterol (E) and triglyceride (F) in mice (n = 6–7 per group). (G) FPLC analysis of plasma cholesterol levels in mice. All data are presented as the mean ± SEM. one-way ANOVA with Tukey's post hoc test (B–F): ∗P < 0.05, ∗∗P < 0.01 compared to the Hif1afl/flApoE–/– + GFP group; #P < 0.05, ##P < 0.01 compared to the Hif1aΔAdipoApoE–/– + GFP group. See also Fig. S3.
Figure 5
Figure 5
Lenti-SMPD3 aggravates inflammation. Eight-week-old Hif1afl/flApoE–/– and Hif1aΔAdipoApoE–/– mice were injected with lentivirus carrying mouse Smpd3 cDNA sequence or GFP and were fed a WD for 8 weeks. (A–C) The levels of the plasma cytokines MCP-1 (A), TNF-α (B), and IL-6 (C) in mice (n = 6 per group). (D) Immunofluorescence staining of atherosclerotic lesions with MAC-2 antibody and calculated MAC-2 positive areas in the plaques (n = 3 per group). Scale bar, 500 μm. All data are presented as the mean ± SEM. One-way ANOVA with Tukey's post hoc test (A–D): ∗∗P < 0.01 compared to the Hif1afl/flApoE–/– + GFP group; ##P < 0.01 compared to the Hif1aΔAdipoApoE–/– + GFP group.
Figure 6
Figure 6
Administration of ceramide reverses the protective effects of adipose HIF-1α deficiency on atherosclerosis through increased inflammation and cholesterol. Eight-week-old Hif1afl/flApoE–/– and Hif1aΔAdipoApoE–/– mice were injected with ceramide C16:0 or vehicle and were fed a WD for 6 weeks. (A) Schematic diagram of the mouse model illustrating the concept of mouse injection with ceramide C16:0 or vehicle. (B, C) Quantitation of ceramide concentrations in plasma (B) and eWAT (C), n = 6 per group. (D, E) The levels of plasma total cholesterol (D) and triglyceride (E), n = 6–7 per group. (F) FPLC analysis of plasma cholesterol levels in mice. (G) Left, representative oil red O staining of cross-sections of aortic roots. Scale bar, 500 μm. Right, quantification of aortic root lesion areas. n = 6–7 per group. (H) Immunofluorescence staining of atherosclerotic lesions with MAC-2 antibody and calculated MAC-2 positive areas in the plaques (n = 3 per group). Scale bar, 500 μm. All data are presented as the mean ± SEM. One-way ANOVA with Tukey's post hoc test (B, D, E, H) and Kruskal–Wallis test (C and G): ∗P < 0.05, ∗∗P < 0.01 compared to the Hif1afl/flApoE–/– + vehicle group; #P < 0.05, ##P < 0.01 compared to the Hif1aΔAdipoApoE–/– + vehicle group. See also Fig. S4.
Figure 7
Figure 7
Inhibition of HIF-1α by PX-478 improves atherosclerosis through the SMPD3–ceramide axis. Eight-week-old ApoE–/– mice were administered with PX-478 (5 mg/kg) or vehicle every other day and fed a WD for 8 weeks. (A) Schematic diagram of the mouse model illustrating the concept of mouse injection with PX-478. (B) Left, representative oil red O staining of cross-sections of aortic roots. Scale bar, 500 μm. Right, quantification of aortic root lesion areas. n = 7 per group. (C, D) Quantitation of ceramide concentrations in plasma (C) and eWAT (D), n = 6 per group. (E, F) The levels of plasma total cholesterol (E) and triglyceride (F), n = 7 per group. (G) FPLC analysis of plasma cholesterol levels in mice. (H) Immunofluorescence staining of atherosclerotic lesions with MAC-2 antibody and calculated MAC-2 positive areas in the plaques (n = 3 per group). Scale bar, 500 μm. All data are presented as the mean ± SEM. Mann–Whitney U test (B, D), Two-tailed Student's t-test (C, E, F, H): ∗P < 0.05, ∗∗P < 0.01 compared to the vehicle group. See also Fig. S5.

Similar articles

Cited by

References

    1. Bittencourt M.S. Beyond the stenosis paradigm: atherosclerosis burden on a risk prediction score for suspected chronic CAD. JACC Cardiovasc Imaging. 2021;14:451–453. - PubMed
    1. Benjamin E.J., Muntner P., Alonso A., Bittencourt M.S., Callaway C.W., Carson A.P., et al. Heart disease and stroke statistics—2019 update: a report from the american heart association. Circulation. 2019;139:e56–e528. - PubMed
    1. Tyrrell D.J., Goldstein D.R. Ageing and atherosclerosis: vascular intrinsic and extrinsic factors and potential role of IL-6. Nat Rev Cardiol. 2021;18:58–68. - PMC - PubMed
    1. Csige I., Ujvarosy D., Szabo Z., Lorincz I., Paragh G., Harangi M., et al. The impact of obesity on the cardiovascular system. J Diabetes Res. 2018;2018:3407306. - PMC - PubMed
    1. Neeland I.J., Poirier P., Despres J.P. Cardiovascular and metabolic heterogeneity of obesity: clinical challenges and implications for management. Circulation. 2018;137:1391–1406. - PMC - PubMed