. 2022 Jun 22;25(8):104659.
doi: 10.1016/j.isci.2022.104659. eCollection 2022 Aug 19.

Establishment of a reference single-cell RNA sequencing dataset for human pancreatic adenocarcinoma

Affiliations

Establishment of a reference single-cell RNA sequencing dataset for human pancreatic adenocarcinoma

Ryota Chijimatsu et al. iScience. .

Abstract

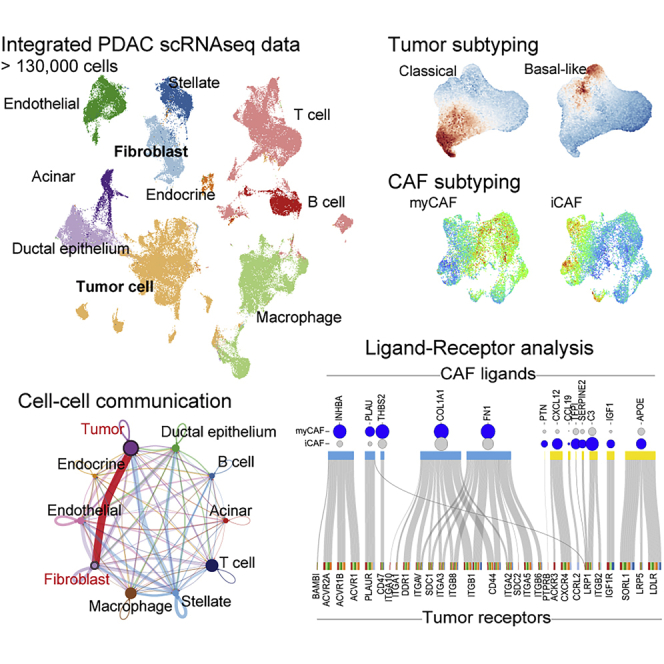
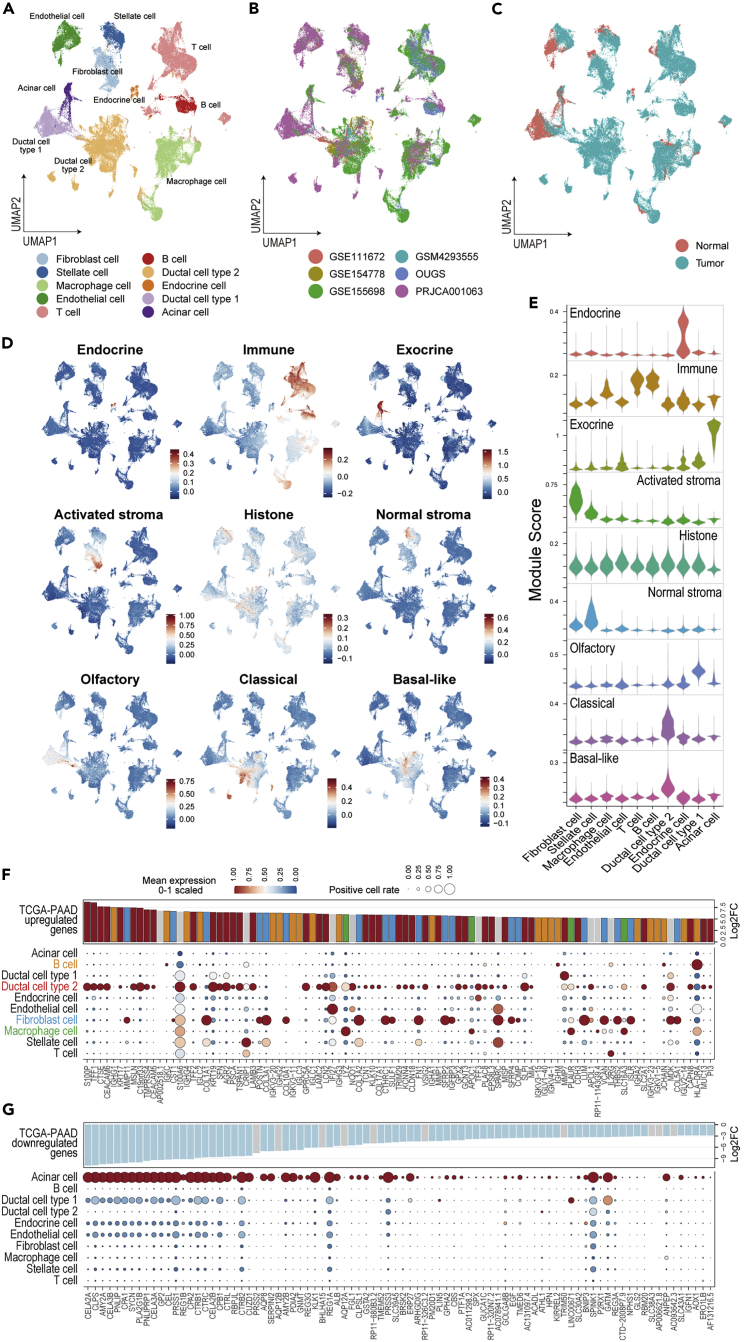
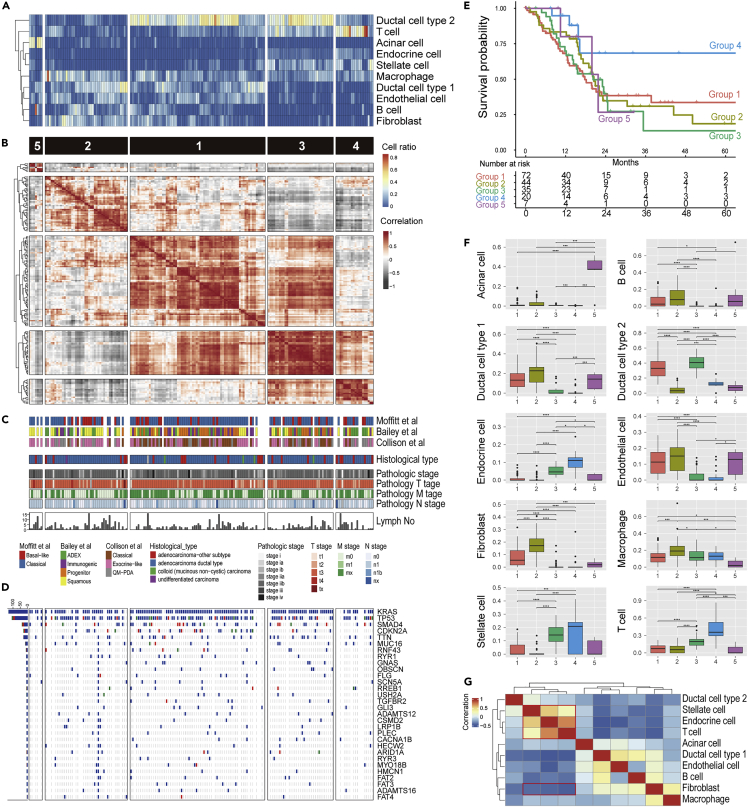
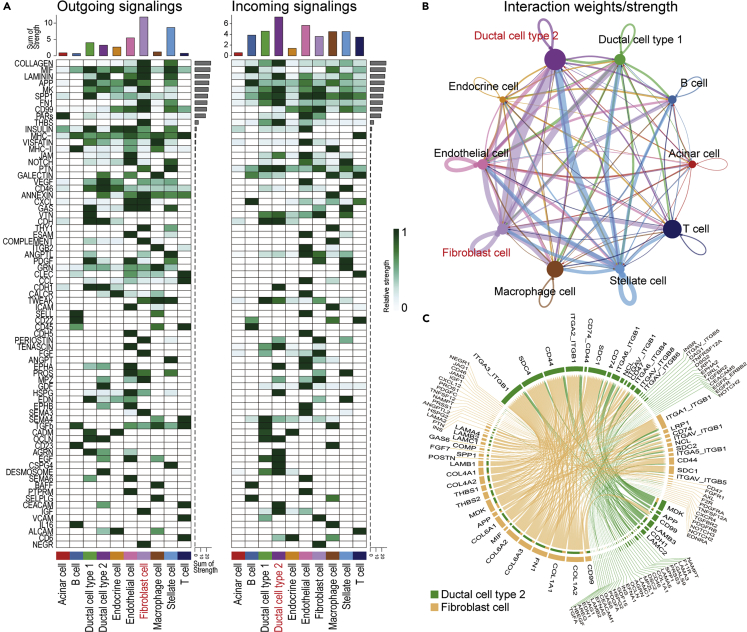
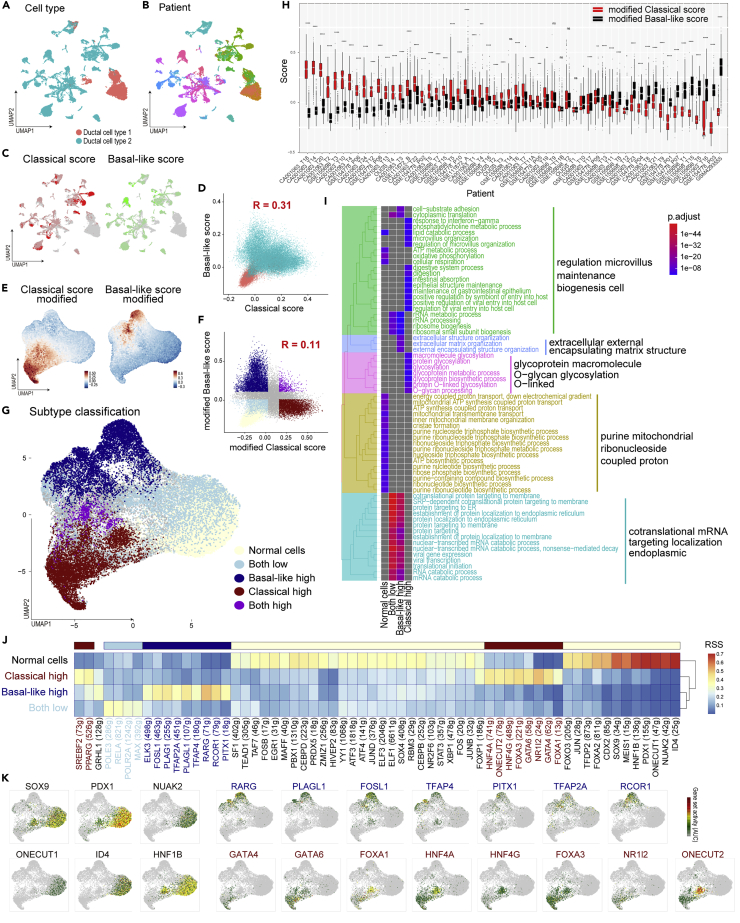
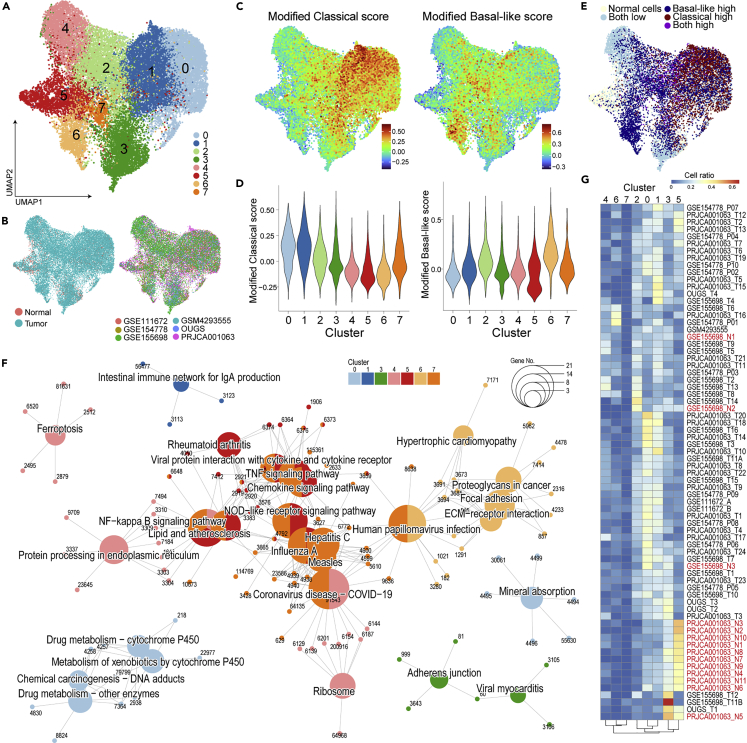
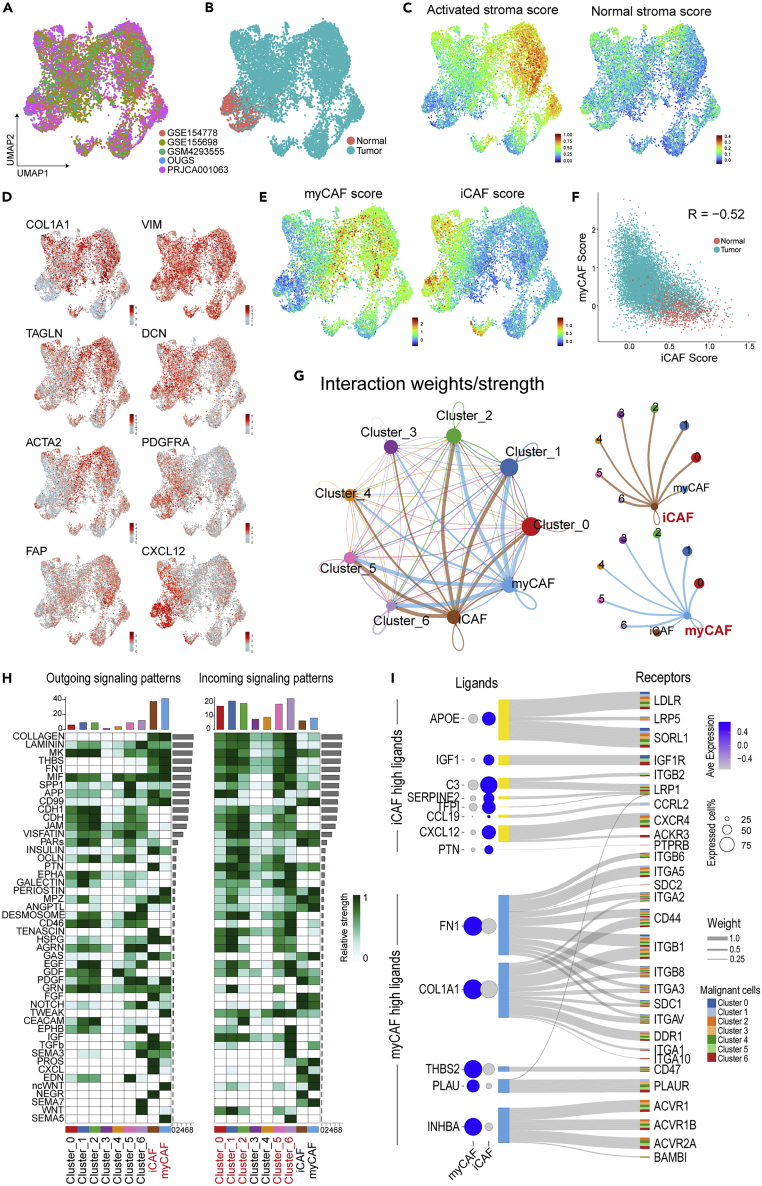
Single-cell RNA sequencing (scRNAseq) has been used to assess the intra-tumor heterogeneity and microenvironment of pancreatic ductal adenocarcinoma (PDAC). However, previous knowledge is not fully universalized. Here, we built a single cell atlas of PDAC from six datasets containing over 70 samples and >130,000 cells, and demonstrated its application to the reanalysis of the previous bulk transcriptomic cohorts and inferring cell-cell communications. The cell decomposition of bulk transcriptomics using scRNAseq data showed the cellular heterogeneity of PDAC; moreover, high levels of tumor cells and fibroblasts were indicative of poor-prognosis. Refined tumor subtypes signature indicated the tumor cell dynamics in intra-tumor and their specific regulatory network. We further identified functionally distinct tumor clusters that had close interaction with fibroblast subtypes via different signaling pathways dependent on subtypes. Our analysis provided a reference dataset for PDAC and showed its utility in research on the microenvironment of intra-tumor heterogeneity.

Keywords: Cancer; Cancer systems biology; Transcriptomics.


Conflict of interest statement

Partial institutional endowments were received from Taiho Pharmaceutical Co., Ltd. (Tokyo, Japan), Hirotsu Bio Science Inc. (Tokyo, Japan), Kinshu-kai Medical Corporation (Osaka, Japan), Kyowa-kai Medical Corporation (Osaka, Japan), IDEA Consultants Inc. (Tokyo, Japan), and Unitech Co. Ltd. (Chiba, Japan).

Figures

None
Graphical abstract
Figure 1
Figure 1
Integration of the six scRNAseq datasets and reinterpretation of altered gene expression in bulk transcriptomics at the cellular level (A–C) The integrated data are summarized in the UMAP and color-coded according to cell type (A), dataset (B), and sample type (C). (D and E) The module scores calculated using the signatures defined in the NMF method on TCGA-PDAC are plotted on UMAP (D) and their violin plot (E). (F and G) Bubble plot showing the cell origin of the driving genes that were highly upregulated (F) and downregulated (G) in TCGA-PAAD, with cell types indicated in the rows and genes in the columns. The size of each bubble represents the rate of cells expressing the gene, and the color represents the scaled average expression in their cell type cluster. The bar plot shows the log2 fold change in the TCGA-PAAD sample vs. the control pancreas obtained from GEPIA2.
Figure 2
Figure 2
Cellular decomposition analysis of the bulk transcriptome using scRNAseq data (A–D) Heatmap showing the estimated cell ratio of each patient from TCGA-PAAD (A). Hierarchical clustered heatmap for the correlation among patients based on the cell composition (B) with previously defined tumor subtypes, clinical metadata (C), and Oncoprint for major gene mutation (D). (E) Kaplan–Meier curve for a group of five patients defined by hierarchical clustering of cell composition (p = 0.03 from likelihood ratio test in Cox proportional hazards regression model). (F) Boxplot (25th percentile, median, and 75th percentile) showing cell composition aggregated for each patient group. Significance was assessed using Pairwise Wilcoxon Rank Sum Tests with Bonferroni correction (∗∗∗∗, p < 0.001; ∗∗∗, p < 0.05; ∗∗, p < 0.01; ∗, p < 0.05. Sample number is indicated in Figure 2E). (G) Hierarchical clustering for the correlation among cell types based on their pattern. The red frame highlights the positive/negative correlations among stellate cells, endocrine cells, T cells, and fibroblasts.
Figure 3
Figure 3
Estimation of cell–cell communication within PDAC using CellChat (A) Heatmap showing the summary of the signaling pathways that contribute to outgoing or incoming communication. The color bar represents the relative signaling strength of a signaling pathway across cell types. The bars indicate the sum of the signaling strength of each cell type or pathway. (B) Circle plots displaying putative ligand–receptor interactions, with the width of edges representing the strength of the communication. (C) Chord diagram showing each ligand–receptor pattern and their weights in the interaction between CAFs and malignant cells.
Figure 4
Figure 4
Re-clustering of ductal cells and their tumor-subtype analysis (A and B) The subset of ductal cells alone was isolated and further processed using the Seurat pipeline without batch correction. UMAP color-coded according to cell type (A) and individual (B) showing high heterogeneity of malignant cell clusters. (C) Tumor-subtype scores defined in Figure 1 plotted on UMAP showing the segmented pattern of the score. (D–G) Pearson’s correlation analysis of the two subtypes of scores indicate weak correlation. The color coding was according to tissue type (D) or new classification (F) (E, G) Modified tumor-subtype scores are shown on the UMAP, which processed new signatures as features for PCA to classify cells according to tumor-subtype (E). Based on their score distribution (F), ductal cells were classified into five groups (G). (H) Boxplot (25th percentile, median, and 75th percentile) of modified subtype scores aggregated for cells from each tumor sample showing their dependency on the source sample. Significance was assessed using Welch’s t-tests (∗∗∗∗, p < 0.001; ∗∗∗, p < 0.05; ∗∗, p < 0.01; ∗, p < 0.05. N = 26 to 2585 cells per patient.). (I) Enrichment analysis of differentially expressed genes in cell clusters using Gene Ontology Biological Process. Tree plot showing the hierarchical clustering of enriched terms with word clouds. (J and K) Tumor-subtype specific regulatory analysis conducted using SCENIC. The heatmap was colored according to the residual sum of squares (RSS) showing the specificity of the activated transcription factor (J). The representative transcript factor is plotted on the UMAP with color attributed according to regulon activity.
Figure 5
Figure 5
Unsupervised clustering of malignant cells indicates tumor-associated features in addition to subtype-specific functions (A and B) Unsupervised clustering of the malignant cell fraction plotted on the UMAP and color-coded according to cluster (A), tissue type, and dataset (B). (C–E) The modified subtype score (C) and cell label defined in Figure 4E are projected on the UMAP. Violin plots showing the aggregation of subtype scores for each cluster (D). (F) Enrichment analysis of differentially expressed genes in cell clusters using the KEGG database. Gene-Concept Network showing enriched terms of the KEGG database with nodes colored according to malignant cell clusters. The node size indicates the number of leaf nodes, and the characters show the Gene ID. (G) Heatmap of the proportion of malignant cell clusters in each sample. The normal pancreas sample is highlighted in red.
Figure 6
Figure 6
Re-clustering based on the fraction of cancer-associated fibroblasts and their subtype analysis (A and B) An unsupervised clustering of the CAF fraction plotted on the UMAP, which was color-coded according to dataset (A) and tissue type (B). (C–E) UMAP plots showing the stromal scores defined in Figure 1C, the expression of marker genes for CAF subtypes (D), and the subtype score for inflammatory/myofibroblast CAFs (E). (F) Pearson’s correlation analysis of two CAF scores indicating a negative correlation. (G) Circle plots displaying putative ligand–receptor interactions, with the width of edges representing the strength of the communication. (H) Heatmap showing the summary of signaling pathways that contributed to outgoing or incoming communication. The color bar represents the relative signaling strength of a signaling pathway across cell types. The bars show the sum of signaling strength for each cell type or pathway. (I) Sanky diagram summarizing the interaction between iCAF/myCAF-upregulated ligands and the receptor of malignant clusters. The width of the edges represents the weight value defined in NicheNet, and the color of the output of the edge represents the target malignant cluster. Bubble plot showing the expression levels in myCAFs or iCAFs. The size of each bubble represents the rate of cells expressing a gene, and the color represents the scaled average expression in their cell-type cluster.

References

    1. Aibar S., González-Blas C.B., Moerman T., Huynh-Thu V.A., Imrichova H., Hulselmans G., Rambow F., Marine J.-C., Geurts P., Aerts J., et al. SCENIC: single-cell regulatory network inference and clustering. Nat. Methods. 2017;14:1083–1086. doi: 10.1038/nmeth.4463. - DOI - PMC - PubMed
    1. Bailey P., Chang D.K., Nones K., Johns A.L., Patch A.M., Gingras M.C., Miller D.K., Christ A.N., Bruxner T.J.C., Quinn M.C., et al. Genomic analyses identify molecular subtypes of pancreatic cancer. Nature. 2016;531:47–52. doi: 10.1038/nature16965. - DOI - PubMed
    1. Balachandran V.P., Beatty G.L., Dougan S.K. Broadening the impact of immunotherapy to pancreatic cancer: Challenges and opportunities. Gastroenterology. 2019;156:2056–2072. doi: 10.1053/j.gastro.2018.12.038. - DOI - PMC - PubMed
    1. Baron M., Veres A., Wolock S.L., Faust A.L., Gaujoux R., Vetere A., Ryu J.H., Wagner B.K., Shen-Orr S.S., Klein A.M., et al. A single-cell transcriptomic map of the human and mouse pancreas reveals inter- and intra-cell population structure. Cell Syst. 2016;3:346–360.e4. doi: 10.1016/j.cels.2016.08.011. - DOI - PMC - PubMed
    1. Browaeys R., Saelens W., Saeys Y. NicheNet: modeling intercellular communication by linking ligands to target genes. Nat. Methods. 2020;17:159–162. doi: 10.1038/s41592-019-0667-5. - DOI - PubMed

LinkOut - more resources