. 2022 Jul 5:2022:3541731.
doi: 10.1155/2022/3541731. eCollection 2022.

Ameliorative Effects of Arctigenin on Pulmonary Fibrosis Induced by Bleomycin via the Antioxidant Activity

Affiliations

Ameliorative Effects of Arctigenin on Pulmonary Fibrosis Induced by Bleomycin via the Antioxidant Activity

Yueshang Wang et al. Oxid Med Cell Longev. .

Abstract

In this study, we evaluated the in vivo effect of arctigenin (ATG) on bleomycin-induced pulmonary fibrosis in mice and assessed the role of antioxidant activity. Hematoxylin and eosin (H&E) staining, the results of Masson's trichrome, and Sirius red staining showed that bleomycin induced obvious pathological changes and collagen deposition in the lung tissue of mice, which were effectively inhibited by ATG. Specifically, based on immunohistochemistry and western blot results, ATG inhibited the expression of fibrosis markers, such as collagen, fibronectin, and α-SMA. Moreover, ATG regulated reactive oxygen species (ROS), superoxide dismutase (SOD), malondialdehyde (MDA), and glutathione (GSH) in the lung tissue of pulmonary fibrosis mice and reduced the pressure of oxidative stress. ATG also regulated the TGF-β-induced expression of p-Akt, confirming that ATG can inhibit fibrosis through antioxidant activity modulation.


Conflict of interest statement

There are no conflicts of interest to declare.

Figures

Figure 1
Figure 1
(a) Hematoxylin and eosin staining was used to observe lung injury in mice. (b) Masson's trichrome staining was used to observe pulmonary fibrosis in mice. (c) Sirius red staining was used to observe collagen deposition in the lungs of mice. (d) Collagen distribution volume statistics using Masson's trichrome staining images; and (e) collagen distribution volume statistics for Sirius red staining images (calculated by Image Pro Plus) (P < 0.05, ∗∗∗P, ∗∗∗∗P < 0.01 vs. the PF group; ####P < 0.01 vs. the Sham group). (f, g) The wet-to-dry ratio and hydroxyproline content for each group (P < 0.05 vs. the PF group; #P < 0.05, ##P < 0.01 vs. the Sham group).
Figure 2
Figure 2
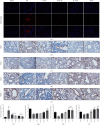
Assessment of pulmonary fibrosis. Immunohistochemical detection of fibrosis biomarkers: (a) collagen type I, (b) fibronectin, and (c) α-SMA. (d) Expression of the fibrosis biomarkers by western blot. (e)–(g) Statistical analysis of the fibrosis biomarkers by an immunohistochemical assay (P < 0.05, ∗∗P, ∗∗∗P, ∗∗∗∗P < 0.01 vs. the PF group; ##P, ###P, ####P < 0.01 vs. the Sham group). (h)–(j) Expression of the fibrosis biomarkers by western blot (∗∗∗P, ∗∗∗∗P < 0.01 vs. the PF group; ##P, ###P, ####P < 0.01 vs. the Sham group).
Figure 3
Figure 3
Assessment of oxidative stress in the lungs: (a) SOD, (b) MDA, (c) GSH, and (d) 8-ios-PGF2α content in each group (P < 0.05, ∗∗P, ∗∗∗P, ∗∗∗∗P < 0.01 vs. the PF group; #P < 0.05, ##P, ####P < 0.01 vs. the Sham group).
Figure 4
Figure 4
(a) Immunofluorescence detection of ROS. (b)–(e) Expression of ROS, Nrf-2, HO-1, and NQO-1 by immunohistochemistry. (f)–(i) Statistical analysis of ROS, Nrf-2, HO-1, and NQO-1 by immunohistochemical detection (∗∗P, ∗∗∗P, ∗∗∗∗P < 0.01 vs. the PF group; #P < 0.05, ##P, ###P, ####P < 0.01 vs. the Sham group).
Figure 5
Figure 5
(a)–(c) Immunohistochemistry detection of TGF-β, Akt, and p-Akt. (d) Expression of antioxidant factors and TGF-β/Akt tested by western blot. (e) Expression of antioxidant factors and TGF-β/Akt by western blot (P < 0.05, ∗∗P, ∗∗∗P, ∗∗∗∗P < 0.01 vs. the PF group; ###P, ####P < 0.01 vs. the Sham group). (f) Statistical analysis by immunohistochemistry (P < 0.05, ∗∗P, ∗∗∗P, ∗∗∗∗P < 0.01 vs. the PF group; ####P < 0.01 vs. the Sham group).

References

    1. Richeldi L., Collard H. R., Jones M. G. Idiopathic pulmonary fibrosis. Lancet . 2017;389(10082):1941–1952. doi: 10.1016/S0140-6736(17)30866-8. - DOI - PubMed
    1. Wynn T. A. Cellular and molecular mechanisms of fibrosis. Journal of Pathology . 2008;214(2):199–210. doi: 10.1002/path.2277. - DOI - PMC - PubMed
    1. Wynn T. A., Ramalingam T. R. Mechanisms of fibrosis: therapeutic translation for fibrotic disease. Nature Medicine . 2012;18(7):1028–1040. doi: 10.1038/nm.2807. - DOI - PMC - PubMed
    1. Hutchinson J., Fogarty A., Hubbard R., McKeever T. Global incidence and mortality of idiopathic pulmonary fibrosis: a systematic review. European Respiratory Journal . 2015;46(3):795–806. doi: 10.1183/09031936.00185114. - DOI - PubMed
    1. Rogliani P., Calzetta L., Cavalli F., Matera M. G., Cazzola M. Pirfenidone, nintedanib and _N_ -acetylcysteine for the treatment of idiopathic pulmonary fibrosis: A systematic review and meta-analysis. Pulmonary Pharmacology & Therapeutics . 2016;40:95–103. doi: 10.1016/j.pupt.2016.07.009. - DOI - PubMed