

Immune reconstitution following umbilical cord blood transplantation: IRES, a study of UK paediatric patients
- PMID: 35847689
- PMCID: PMC9176140
- DOI: 10.1002/jha2.12
Immune reconstitution following umbilical cord blood transplantation: IRES, a study of UK paediatric patients
Abstract
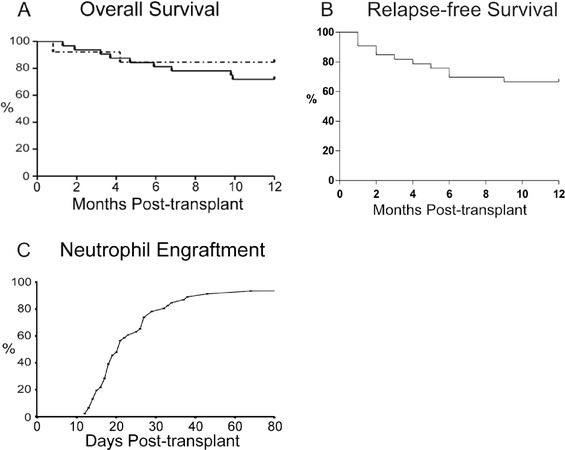
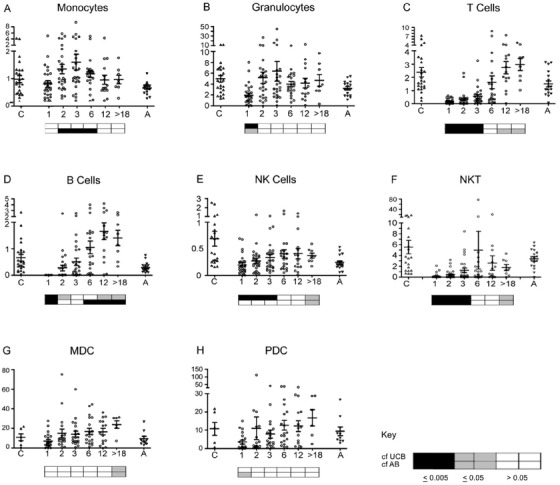
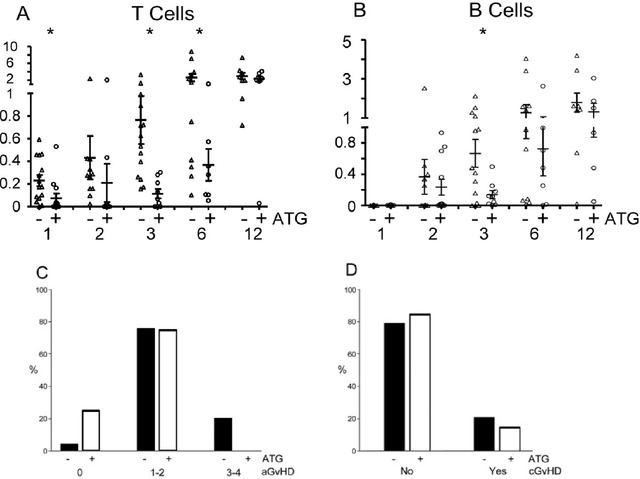
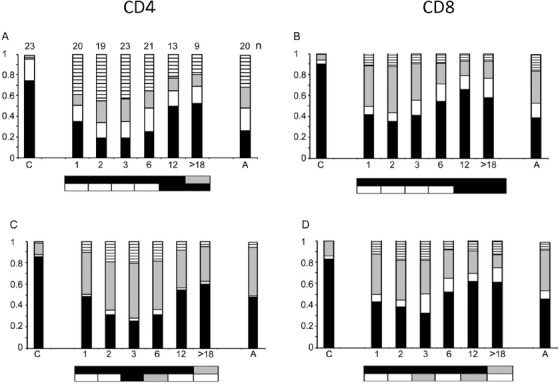
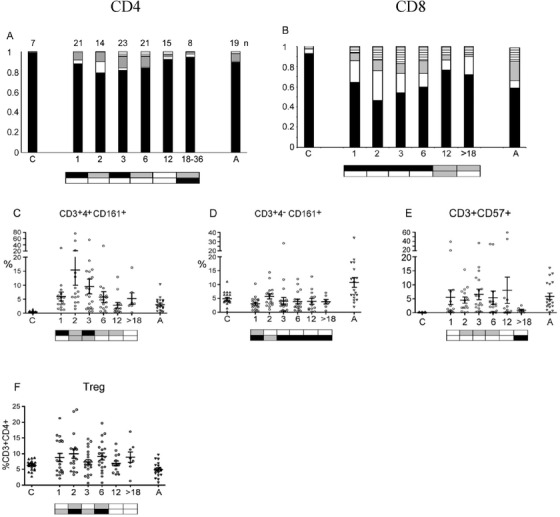
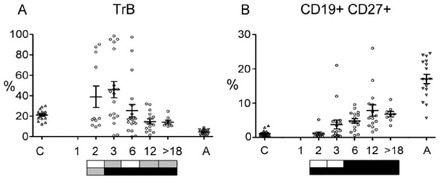
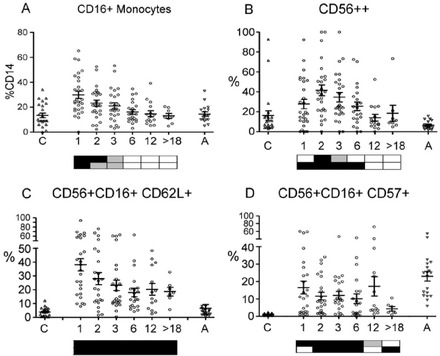
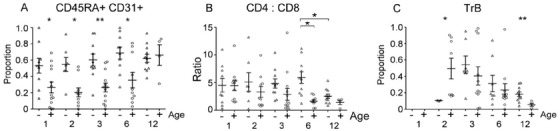
To obtain a qualitative as well as quantitative view immune reconstitution following umbilical cord blood (UCB) transplantation of paediatric patients, we utilised a broad panel of flow cytometry markers to monitor the phenotypes of lymphoid and myeloid cells at 1-12 months post-transplant. Samples were received from 46 patients with a median age of 3.3 years and survival was 76% at 1 year. Monocytes were at similar or higher median levels than in adult controls at all times tested, with a high CD16+ proportion in the first 3 months. NK cells were also within adult ranges, with a CD56++ high proportion in the first 6 months. B cell recovery was seen from 2 months in most patients and T cells from 3 months, both were delayed with anti-thymocyte globulin (ATG) treatment. CD4:CD8 ratios were high in the first 6 months, and the proportion of T cells with recent thymic emigrant and naïve phenotypes rose from 3 months. NK and plasmacytoid dendritic cell numbers remained at reduced levels in patients not surviving to 1 year. Our results can serve as a useful reference for detailed monitoring of immune reconstitution in paediatric recipients of UCB.
Keywords: cord blood; immunophenotyping; stem cell transplantation.
© 2020 The Authors. eJHaem published by British Society for Haematology and John Wiley & Sons Ltd.
Figures
Similar articles
-
Immune Reconstitution Profiling Suggests Antiviral Protection after Transplantation with Omidubicel: A Phase 3 Substudy.Transplant Cell Ther. 2023 Aug;29(8):517.e1-517.e12. doi: 10.1016/j.jtct.2023.04.018. Epub 2023 Apr 28. Transplant Cell Ther. 2023. PMID: 37120136 Clinical Trial.
-
Immune reconstitution after single-unit umbilical cord blood transplantation using anti-thymoglobulin and myeloablative conditioning in adults with hematological malignancies.Ann Hematol. 2024 Jul;103(7):2475-2484. doi: 10.1007/s00277-024-05758-0. Epub 2024 Apr 18. Ann Hematol. 2024. PMID: 38634914
-
The impact of different doses of antithymocyte globulin conditioning on immune reconstitution upon hematopoietic stem cell transplantation.Transpl Immunol. 2021 Dec;69:101486. doi: 10.1016/j.trim.2021.101486. Epub 2021 Oct 20. Transpl Immunol. 2021. PMID: 34678462
-
Reconstitution of adaptive immunity after umbilical cord blood transplantation: impact on infectious complications.Stem Cell Investig. 2017 May 25;4:40. doi: 10.21037/sci.2017.05.03. eCollection 2017. Stem Cell Investig. 2017. PMID: 28607914 Free PMC article. Review.
-
Improving engraftment and immune reconstitution in umbilical cord blood transplantation.Front Immunol. 2014 Feb 24;5:68. doi: 10.3389/fimmu.2014.00068. eCollection 2014. Front Immunol. 2014. PMID: 24605111 Free PMC article. Review.
Cited by
-
Hematopoiesis in the spleen after engraftment in unrelated cord blood transplantation evaluated by 18F-FLT PET imaging.Int J Hematol. 2023 Nov;118(5):618-626. doi: 10.1007/s12185-023-03658-z. Epub 2023 Oct 2. Int J Hematol. 2023. PMID: 37782417 Free PMC article.
References
-
- Rocha V. Umbilical cord blood cells from unrelated donor as an alternative source of hematopoietic stem cells for transplantation in children and adults. Semin Hematol. 2016;53:237–45. - PubMed
-
- Elfeky R, Lazareva A, Qasim W, Veys P. Immune reconstitution following hematopoietic stem cell transplantation using different stem cell sources. Expert Rev Clin Immunol. 2019;15:735–51. - PubMed
-
- Lucchini G, Perales MA, Veys P. Immune reconstitution after cord blood transplantation: peculiarities, clinical implications and management strategies. Cytotherapy 2015;17:711–22. - PubMed
LinkOut - more resources
Full Text Sources
Research Materials