. 2022 Jun 30:9:930043.
doi: 10.3389/fmed.2022.930043. eCollection 2022.

Mortality Prediction in Sepsis With an Immune-Related Transcriptomics Signature: A Multi-Cohort Analysis

Affiliations

Mortality Prediction in Sepsis With an Immune-Related Transcriptomics Signature: A Multi-Cohort Analysis

Louis Kreitmann et al. Front Med (Lausanne). .

Abstract

Background: Novel biomarkers are needed to progress toward individualized patient care in sepsis. The immune profiling panel (IPP) prototype has been designed as a fully-automated multiplex tool measuring expression levels of 26 genes in sepsis patients to explore immune functions, determine sepsis endotypes and guide personalized clinical management. The performance of the IPP gene set to predict 30-day mortality has not been extensively characterized in heterogeneous cohorts of sepsis patients.

Methods: Publicly available microarray data of sepsis patients with widely variable demographics, clinical characteristics and ethnical background were co-normalized, and the performance of the IPP gene set to predict 30-day mortality was assessed using a combination of machine learning algorithms.

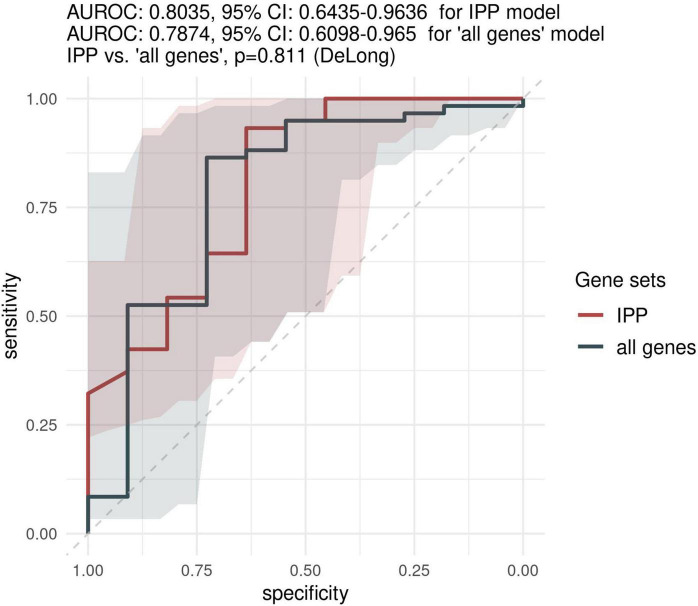
Results: We collected data from 1,801 arrays sampled on sepsis patients and 598 sampled on controls in 17 studies. When gene expression was assayed at day 1 following admission (1,437 arrays sampled on sepsis patients, of whom 1,161 were alive and 276 (19.2%) were dead at day 30), the IPP gene set showed good performance to predict 30-day mortality, with an area under the receiving operating characteristics curve (AUROC) of 0.710 (CI 0.652-0.768). Importantly, there was no statistically significant improvement in predictive performance when training the same models with all genes common to the 17 microarray studies (n = 7,122 genes), with an AUROC = 0.755 (CI 0.697-0.813, p = 0.286). In patients with gene expression data sampled at day 3 following admission or later, the IPP gene set had higher performance, with an AUROC = 0.804 (CI 0.643-0.964), while the total gene pool had an AUROC = 0.787 (CI 0.610-0.965, p = 0.811).

Conclusion: Using pooled publicly-available gene expression data from multiple cohorts, we showed that the IPP gene set, an immune-related transcriptomics signature conveys relevant information to predict 30-day mortality when sampled at day 1 following admission. Our data also suggests that higher predictive performance could be obtained when assaying gene expression at later time points during the course of sepsis. Prospective studies are needed to confirm these findings using the IPP gene set on its dedicated measurement platform.

Keywords: biomarker discovery; gene expression analysis; mortality; predictive modeling; sepsis; transcriptomics.


Conflict of interest statement

The IPP gene set has been filed for patent protection. LK was employed by, and has received research funding by bioMérieux. MB, AF, KI, M-AC, EP, EC, CT, J-FL, JT, SB, and KB-P were employed by bioMérieux. The remaining authors declare that the research was conducted in the absence of any commercial or financial relationships that could be construed as a potential conflict of interest.

Figures

FIGURE 1
FIGURE 1
Effect of ComBat co-normalization on patient-level gene expression data assessed by principal component analysis (PCA) across 17 microarray studies. We computed a 2-dimensional PCA plot of individual gene expression data from sepsis patients at day 1 following admission (7,122 genes assessed on 1,437 arrays sampled on 1,437 patients) before (left panel) and after (right panel) ComBat co-normalization using controls with the COCONUT R package. Each of the 17 studies maps to one color, showing how co-normalization attenuates the segregation of individual data points in clusters determined by the study to which they belong.
FIGURE 2
FIGURE 2
Predictive performance of the IPP gene set on “day 1” discovery and validation sets. We trained machine learning models on the “day 1” discovery (n = 1,007) and validation (n = 430) data sets by 5 repeats of 10-fold cross-validation, and computed areas under the receiver operating characteristic (AUROC, right panel) and precision-recall curves (AUPRC, left panel) on the resampled discovery set (box plots) and by prediction on the validation set (gray diamonds). Gray dashed line on the AUPRC facet indicates baseline probability of the outcome (death).
FIGURE 3
FIGURE 3
Comparison of predictive performances of the IPP gene set with that obtained with other genes on the “day 1” data set. We compared the predictive performance of the IPP gene set to that obtained with other genes common to the 17 microarray studies by computing ROC curves obtained by prediction on the validation set with IPP, “all genes” and “top 29 genes” models trained on GE data collected at day 1 following admission. Gray areas indicate 95% confidence intervals of corresponding AUROCs.
FIGURE 4
FIGURE 4
Predictive performance of the IPP gene set on the “days > 2” data set. We assessed the predictive performance of the IPP and “all genes” set by computing ROC curves on the validation set.
FIGURE 5
FIGURE 5
Prognostic enrichment with the IPP tool. We used the best IPP models (trained on the “day 1” and “days > 2” discovery sets) and computed a test threshold using the top-left method on corresponding validation sets. This enabled us to divide the validation sets in 2 sub-groups with a low and a high predicted risk of death. Then, we compared the actual proportion of sepsis patients deceased at day 30 in both sub-groups, to assess if IPP could be used for prognostic enrichment at the bedside.

References

    1. Angus DC, van der Poll T. Severe sepsis and septic shock. N Engl J Med. (2013) 369:840–51. - PubMed
    1. Vincent J-L, Marshall JC, Namendys-Silva SA, François B, Martin-Loeches I, Lipman J, et al. Assessment of the worldwide burden of critical illness: the intensive care over nations (ICON) audit. Lancet Respir Med. (2014) 2:380–6. 10.1016/S2213-2600(14)70061-X - DOI - PubMed
    1. Quenot J-P, Binquet C, Kara F, Martinet O, Ganster F, Navellou J-C, et al. The epidemiology of septic shock in French intensive care units: the prospective multicenter cohort EPISS study. Crit Care Lond Engl. (2013) 17:R65. 10.1186/cc12598 - DOI - PMC - PubMed
    1. Alhazzani W, Møller MH, Arabi YM, Loeb M, Gong MN, Fan E, et al. Surviving sepsis campaign: guidelines on the management of critically ill adults with coronavirus disease 2019 (COVID-19). Intensive Care Med. (2020) 46:854–87. - PMC - PubMed
    1. Cohen J, Vincent J-L, Adhikari NKJ, Machado FR, Angus DC, Calandra T, et al. Sepsis: a roadmap for future research. Lancet Infect Dis. (2015) 15:581–614. - PubMed

LinkOut - more resources