

Differential Diagnosis Value of Shear-Wave Elastography for Superficial Enlarged Lymph Nodes
- PMID: 35847906
- PMCID: PMC9280688
- DOI: 10.3389/fonc.2022.908085
Differential Diagnosis Value of Shear-Wave Elastography for Superficial Enlarged Lymph Nodes
Abstract
Objectives: To evaluate the diagnostic efficiency and diagnostic threshold of conventional US and shear-wave elastography (SWE) in superficial enlarged lymph nodes (LNs).
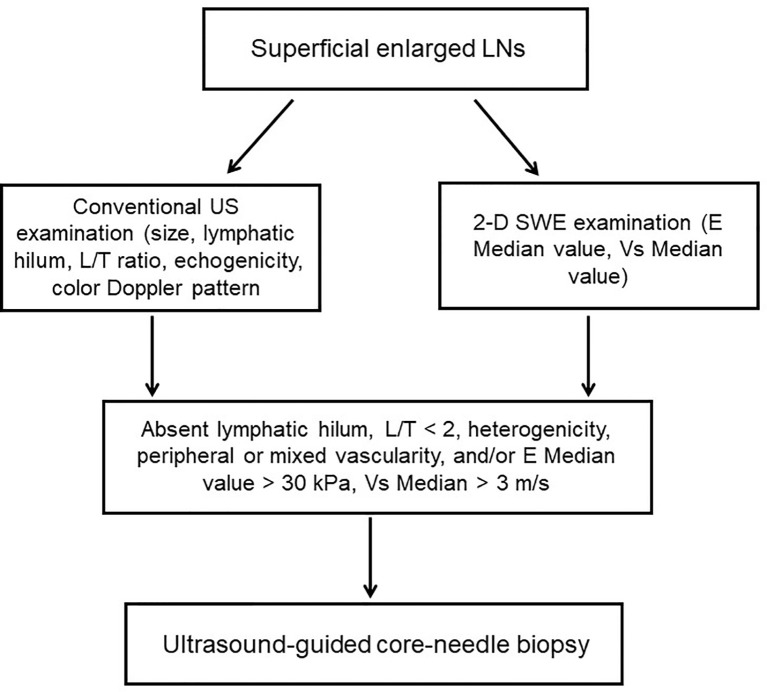
Methods: A total of 204 patients with superficial enlarged LNs were enrolled in this retrospective study aged 46.0 ± 15.2 years from March 2020 to March 2021. LNs with a long axis larger than 0.7 cm were considered as superficial enlarged. Before the histological biopsy, LNs that were considered suspicious according to both conventional US and SWE were included, while LNs with no or unclear pathological results, or with no satisfactory SWE images, were excluded. The conventional and 2-D SWE examinations were performed with Aplio i800 and Acuson sequoia equipped with i18LX5 linear-array transducer (5-18 MHz) and 10L4 linear-array transducer (4-10 MHz), respectively. Both E Median and Vs Median parameters were investigated by two senior ultrasound physicians. The pathological results were performed as the gold standard.
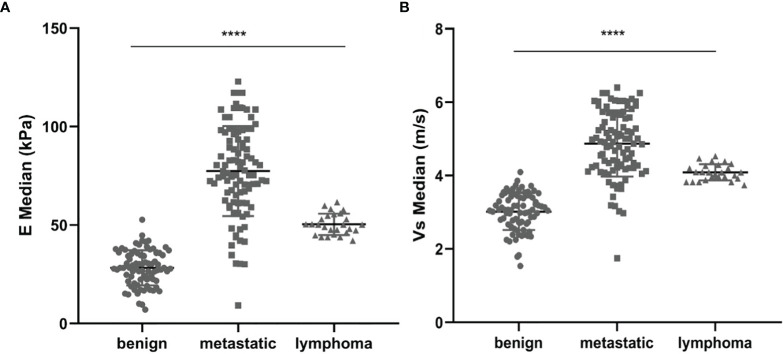
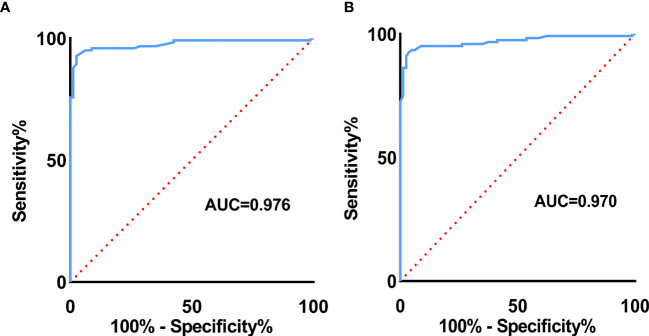
Results: Variables including transverse axis size, lymphatic hilum, L/T ratio, echogenicity, and color Doppler pattern were considered significant. The mean E Median value in benign, metastatic LNs, and lymphoma were 28.26 ± 8.87 kPa, 77.46 ± 22.85 kPa, and 50.37 ± 5.41 kPa (p <0.001), while Vs Median values were 3.02 ± 0.50 m/s, 4.87 ± 0.90 m/s, and 4.09 ± 0.22 m/s, respectively (p < 0.001). The diagnostic performance indicated the high sensitivity, specificity, PPV, NPV, and overall accuracy of conventional US combined with SWE. The optimal cutoff values of E Median and Vs Median for predicting malignant LNs were 42.90 kPa and 3.73 m/s, respectively. As AUC value, sensitivity, specificity, accuracy, PPV, and NPV revealed, the indexes of E Median were 0.976, 0.927, 0.975, 0.946, 0.983, and 0.897, respectively, while Vs Median were 0.970, 0.927, 0.963, 0.941, 0.975, and 0.895, respectively (p <0.001). The ROC curves of both E Median (AUC=0.976) Vs Median (AUC=0.970) suggested the remarkable diagnostic efficiency in distinguishing benignity between suspected malignant LNs.
Conclusions: Above results indicated that conventional US together with 2-D SWE could elevate the diagnostic performance. Meanwhile, the parameters of 2-D SWE including E Median and Vs Median could effectively assess malignant LNs, which provide valuable differentiating information in superficial enlarged LNs.
Keywords: conventional ultrasonography; differential diagnosis; shear-wave elastography; superficial enlarged lymph nodes; ultrasound.
Copyright © 2022 Sun, Wang, Mi, Zhang and Zhang.
Conflict of interest statement
The authors declare that the research was conducted in the absence of any commercial or financial relationships that could be construed as a potential conflict of interest.
Figures
Similar articles
-
The diagnostic value of two-dimensional shear-wave elastography in identifying malignant lesions in lymph nodes: a prospective study.Sci Rep. 2025 May 19;15(1):17395. doi: 10.1038/s41598-025-00502-8. Sci Rep. 2025. PMID: 40389433 Free PMC article.
-
Value of Shear Wave Elastography Versus Contrast-Enhanced Sonography for Differentiating Benign and Malignant Superficial Lymphadenopathy Unexplained by Conventional Sonography.J Ultrasound Med. 2017 Jan;36(1):189-199. doi: 10.7863/ultra.16.01014. Epub 2016 Nov 30. J Ultrasound Med. 2017. PMID: 27925679
-
Virtual touch tissue imaging quantification shear wave elastography for determining benign versus malignant cervical lymph nodes: a comparison with conventional ultrasound.Diagn Interv Radiol. 2019 Mar;25(2):114-121. doi: 10.5152/dir.2019.18406. Diagn Interv Radiol. 2019. PMID: 30774094 Free PMC article.
-
Two-dimensional shear wave elastography of breast lesions: Comparison of two different systems.Clin Hemorheol Microcirc. 2017;66(1):37-46. doi: 10.3233/CH-16243. Clin Hemorheol Microcirc. 2017. PMID: 28211807
-
Shear wave elastography combined with gray-scale ultrasound for predicting central lymph node metastasis of papillary thyroid carcinoma.Surg Oncol. 2021 Mar;36:1-6. doi: 10.1016/j.suronc.2020.11.004. Epub 2020 Nov 25. Surg Oncol. 2021. PMID: 33271464 Review.
Cited by
-
Evaluating Different Quantitative Shear Wave Parameters of Ultrasound Elastography in the Diagnosis of Lymph Node Malignancies: A Systematic Review and Meta-Analysis.Cancers (Basel). 2022 Nov 13;14(22):5568. doi: 10.3390/cancers14225568. Cancers (Basel). 2022. PMID: 36428661 Free PMC article. Review.
-
Fisher discriminant analysis of multimodal ultrasound in diagnosis of cervical metastatic lymph nodes in papillary thyroid cancer.Korean J Intern Med. 2025 Jan;40(1):103-114. doi: 10.3904/kjim.2024.122. Epub 2024 Oct 29. Korean J Intern Med. 2025. PMID: 39468925 Free PMC article.
-
Multimodality high-frequency ultrasound in the evaluation of cervical malignant lymphoma before biopsy.Future Oncol. 2024 Dec;20(39):3279-3287. doi: 10.1080/14796694.2024.2430168. Epub 2024 Nov 20. Future Oncol. 2024. PMID: 39563526
-
Ultrasound tissue scatterer distribution imaging: An adjunctive diagnostic tool for shear wave elastography in characterizing focal liver lesions.Ultrason Sonochem. 2023 Dec;101:106716. doi: 10.1016/j.ultsonch.2023.106716. Epub 2023 Dec 7. Ultrason Sonochem. 2023. PMID: 38071854 Free PMC article.
-
The diagnostic value of two-dimensional shear-wave elastography in identifying malignant lesions in lymph nodes: a prospective study.Sci Rep. 2025 May 19;15(1):17395. doi: 10.1038/s41598-025-00502-8. Sci Rep. 2025. PMID: 40389433 Free PMC article.
References
LinkOut - more resources
Full Text Sources
Research Materials