

An Immunity-Related Gene Model Predicts Prognosis in Cholangiocarcinoma
- PMID: 35847907
- PMCID: PMC9283581
- DOI: 10.3389/fonc.2022.791867
An Immunity-Related Gene Model Predicts Prognosis in Cholangiocarcinoma
Abstract
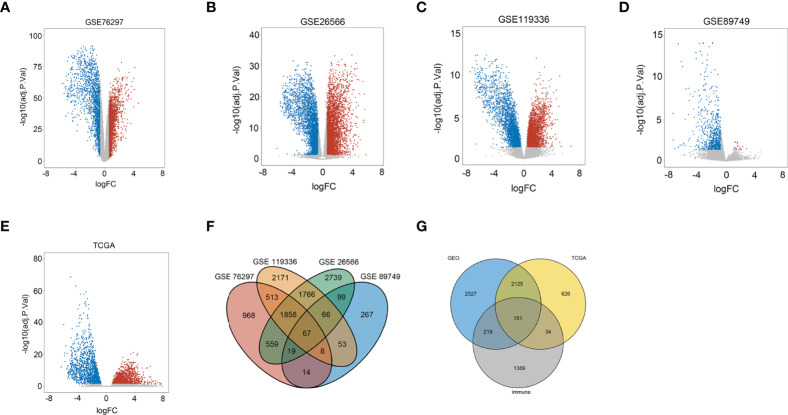
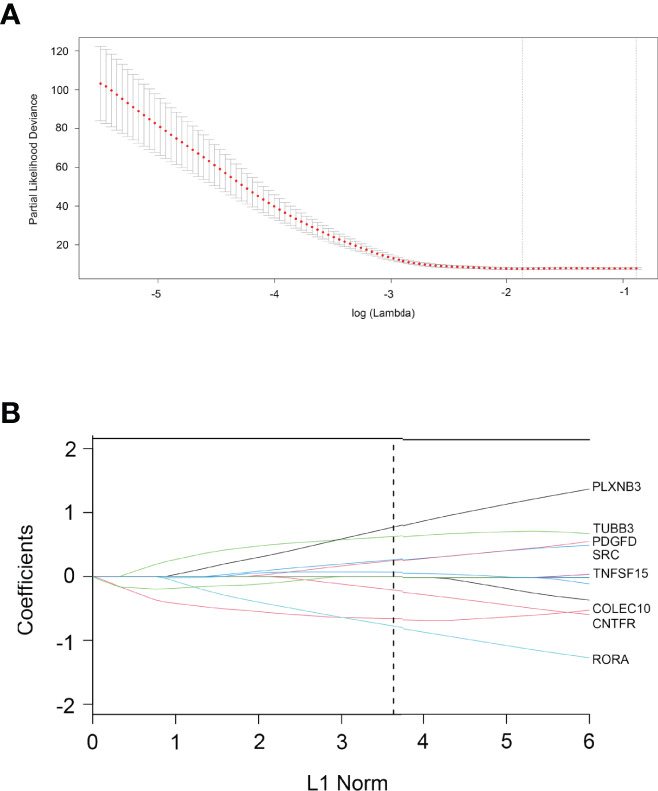
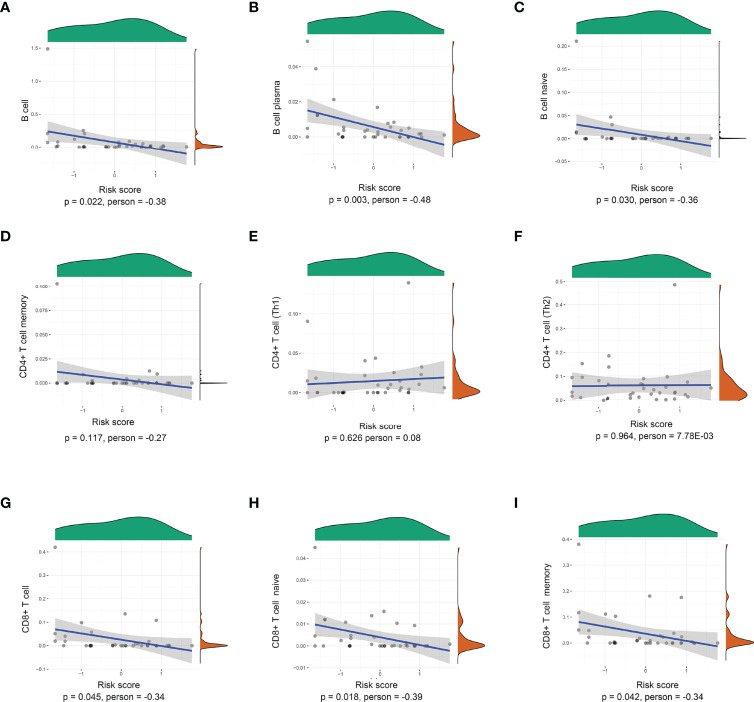
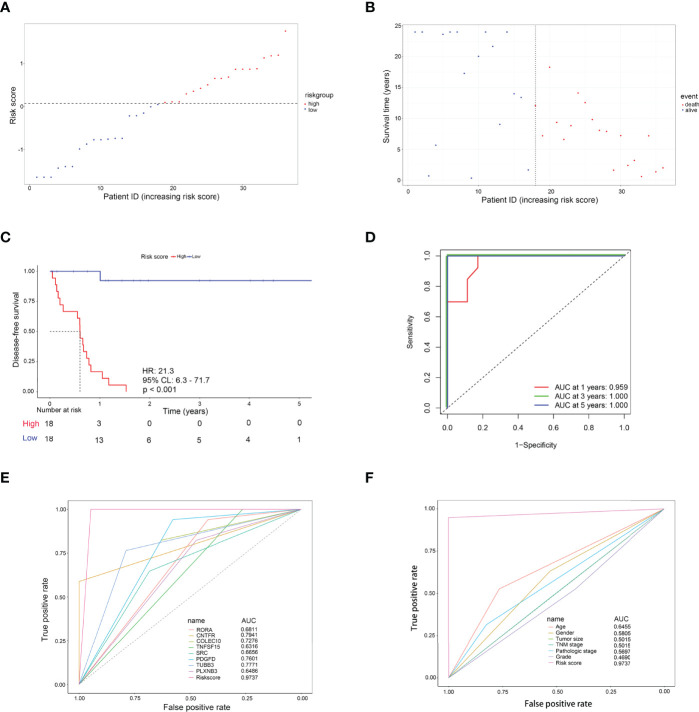
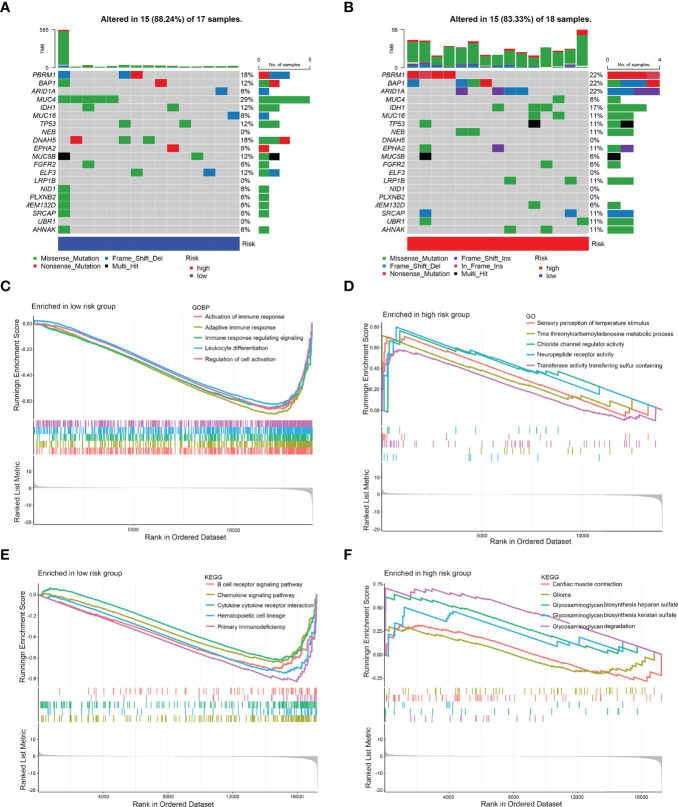
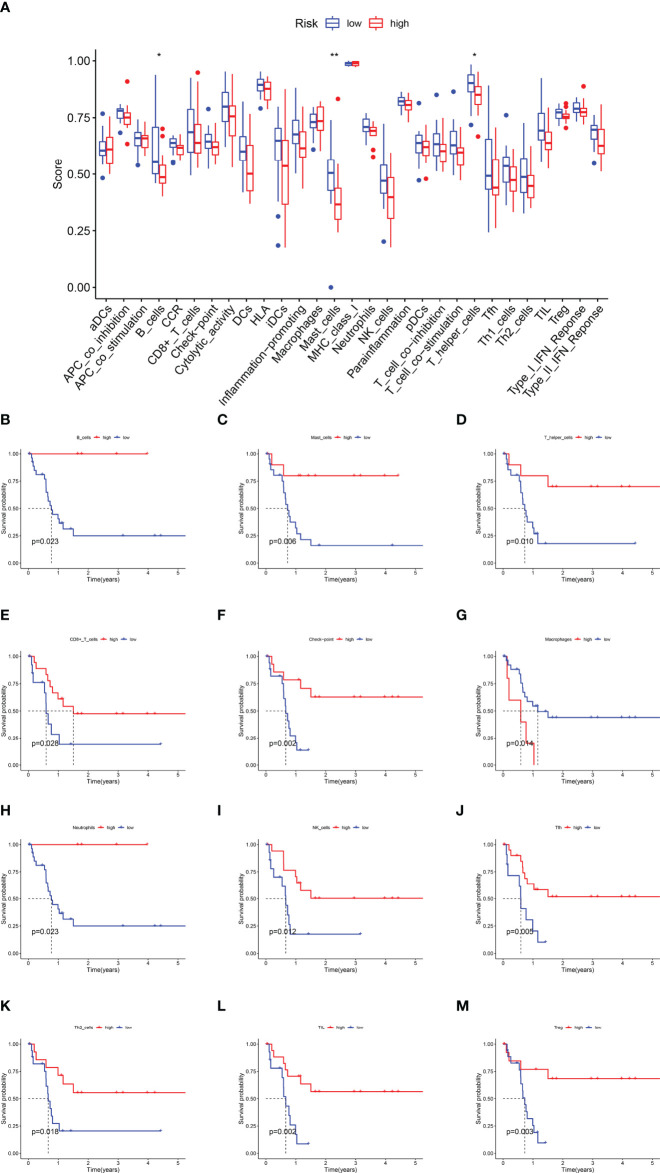
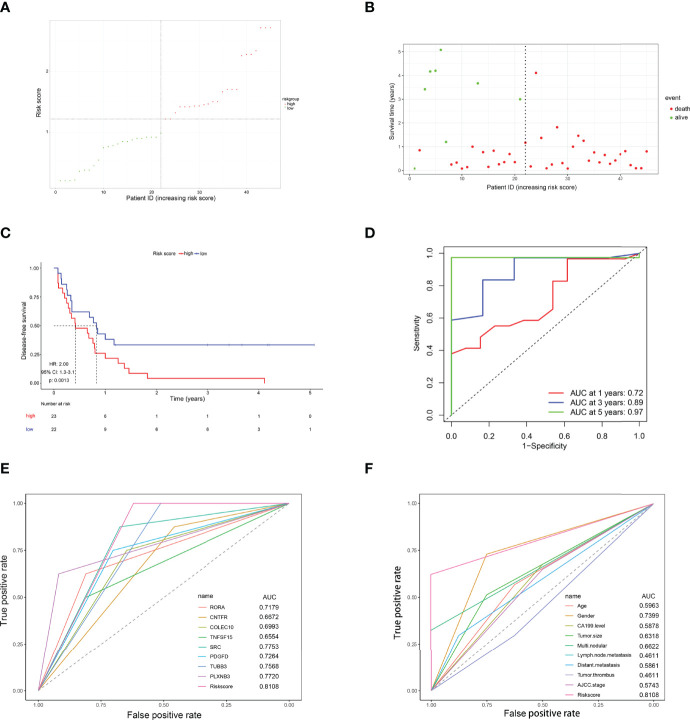
The prognosis of patients with cholangiocarcinoma (CCA) is closely related to both immune cell infiltration and mRNA expression. Therefore, we aimed at conducting multi-immune-related gene analyses to improve the prediction of CCA recurrence. Immune-related genes were selected from the Gene Expression Omnibus (GEO), The Cancer Genome Atlas (TCGA), and the Immunology Database and Analysis Portal (ImmPort). The least absolute shrinkage and selection operator (LASSO) regression model was used to establish the multi-gene model that was significantly correlated with the recurrence-free survival (RFS) in two test series. Furthermore, compared with single genes, clinical characteristics, tumor immune dysfunction and exclusion (TIDE), and tumor inflammation signature (TIS), the 8-immune-related differentially expressed genes (8-IRDEGs) signature had a better prediction value. Moreover, the high-risk subgroup had a lower density of B-cell, plasma, B-cell naïve, CD8+ T-cell, CD8+ T-cell naïve, and CD8+ T-cell memory infiltration, as well as more severe immunosuppression and higher mutation counts. In conclusion, the 8-IRDEGs signature was a promising biomarker for distinguishing the prognosis and the molecular and immune features of CCA, and could be beneficial to the individualized immunotherapy for CCA patients.
Keywords: LASSO; TCI; cholangiocarcinoma; immunity; prognosis.
Copyright © 2022 Guo, Qian, Yu, Bi, Jiao, Jiang, Yu, Wu, Shi and Kong.
Conflict of interest statement
The authors declare that the research was conducted in the absence of any commercial or financial relationships that could be construed as a potential conflict of interest.
Figures
Similar articles
-
Prognostic values of a novel multi-mRNA signature for predicting relapse of cholangiocarcinoma.Int J Biol Sci. 2020 Jan 16;16(5):869-881. doi: 10.7150/ijbs.38846. eCollection 2020. Int J Biol Sci. 2020. PMID: 32071556 Free PMC article.
-
Pyroptosis-Related Gene Signature Predicts Prognosis and Indicates Immune Microenvironment Infiltration in Glioma.Front Cell Dev Biol. 2022 Apr 25;10:862493. doi: 10.3389/fcell.2022.862493. eCollection 2022. Front Cell Dev Biol. 2022. PMID: 35547808 Free PMC article.
-
Identifying and Validating an Acidosis-Related Signature Associated with Prognosis and Tumor Immune Infiltration Characteristics in Pancreatic Carcinoma.J Immunol Res. 2021 Dec 28;2021:3821055. doi: 10.1155/2021/3821055. eCollection 2021. J Immunol Res. 2021. PMID: 34993253 Free PMC article.
-
A novel immunogenomic signature to predict prognosis and reveal immune infiltration characteristics in pancreatic ductal adenocarcinoma.Precis Clin Med. 2022 Apr 25;5(2):pbac010. doi: 10.1093/pcmedi/pbac010. eCollection 2022 Jun. Precis Clin Med. 2022. PMID: 35694712 Free PMC article.
-
Construction and validation of immune-related LncRNAs classifier to predict prognosis and immunotherapy response in laryngeal squamous cell carcinoma.World J Surg Oncol. 2022 May 24;20(1):164. doi: 10.1186/s12957-022-02608-z. World J Surg Oncol. 2022. PMID: 35606755 Free PMC article.
Cited by
-
Biomarkers for the Evaluation of Immunotherapy in Patients with Cholangiocarcinoma.Cancers (Basel). 2025 Feb 6;17(3):555. doi: 10.3390/cancers17030555. Cancers (Basel). 2025. PMID: 39941920 Free PMC article. Review.
-
A novel signature of combing cuproptosis- with ferroptosis-related genes for prediction of prognosis, immunologic therapy responses and drug sensitivity in hepatocellular carcinoma.Front Oncol. 2022 Sep 27;12:1000993. doi: 10.3389/fonc.2022.1000993. eCollection 2022. Front Oncol. 2022. PMID: 36249031 Free PMC article.
-
Identification of immune related gene signature for predicting prognosis of cholangiocarcinoma patients.Front Immunol. 2023 Feb 2;14:1028404. doi: 10.3389/fimmu.2023.1028404. eCollection 2023. Front Immunol. 2023. PMID: 36817485 Free PMC article.
References
-
- Alabraba E, Joshi H, Bird N, Griffin R, Sturgess R, Stern N, et al. . Increased Multimodality Treatment Options has Improved Survival for Hepatocellular Carcinoma But Poor Survival for Biliary Tract Cancers Remains Unchanged. Eur J Surg Oncol (2019) 45:1660–7. doi: 10.1016/j.ejso.2019.04.002 - DOI - PubMed
LinkOut - more resources
Full Text Sources
Research Materials