. 2022 Oct;28(19):5708-5725.
doi: 10.1111/gcb.16301. Epub 2022 Jul 18.

Marine heatwaves drive recurrent mass mortalities in the Mediterranean Sea

Joaquim Garrabou  1   2 Daniel Gómez-Gras  1   3 Alba Medrano  3 Carlo Cerrano  4   5 Massimo Ponti  6   7 Robert Schlegel  8 Nathaniel Bensoussan  1   2 Eva Turicchia  6   7 Maria Sini  9 Vasilis Gerovasileiou  10   11 Nuria Teixido  8   12 Alice Mirasole  12 Laura Tamburello  12 Emma Cebrian  13 Gil Rilov  14 Jean-Baptiste Ledoux  1   15 Jamila Ben Souissi  16   17 Faten Khamassi  16 Raouia Ghanem  17 Mouloud Benabdi  18 Samir Grimes  19 Oscar Ocaña  20 Hocein Bazairi  21 Bernat Hereu  3 Cristina Linares  3 Diego Kurt Kersting  3 Graciel la Rovira  3 Júlia Ortega  3 David Casals  3 Marta Pagès-Escolà  3 Núria Margarit  3 Pol Capdevila  22 Jana Verdura  23 Alfonso Ramos  24 Andres Izquierdo  25 Carmen Barbera  24 Esther Rubio-Portillo  26 Irene Anton  25 Paula López-Sendino  1 David Díaz  27 Maite Vázquez-Luis  27 Carlos Duarte  28   29 Nuria Marbà  29 Eneko Aspillaga  29 Free Espinosa  30 Daniele Grech  31 Ivan Guala  31 Ernesto Azzurro  12   32 Simone Farina  33 Maria Cristina Gambi  34 Giovanni Chimienti  7   35 Monica Montefalcone  36 Annalisa Azzola  36 Torcuato Pulido Mantas  4 Simonetta Fraschetti  7   37 Giulia Ceccherelli  38 Silvija Kipson  39   40 Tatjana Bakran-Petricioli  40 Donat Petricioli  41 Carlos Jimenez  42   43 Stelios Katsanevakis  9 Inci Tuney Kizilkaya  44 Zafer Kizilkaya  45 Stephane Sartoretto  46 Rouanet Elodie  47 Sandrine Ruitton  2 Steeve Comeau  8 Jean-Pierre Gattuso  8   48 Jean-Georges Harmelin  47
Affiliations

Marine heatwaves drive recurrent mass mortalities in the Mediterranean Sea

Joaquim Garrabou et al. Glob Chang Biol. 2022 Oct.

Abstract

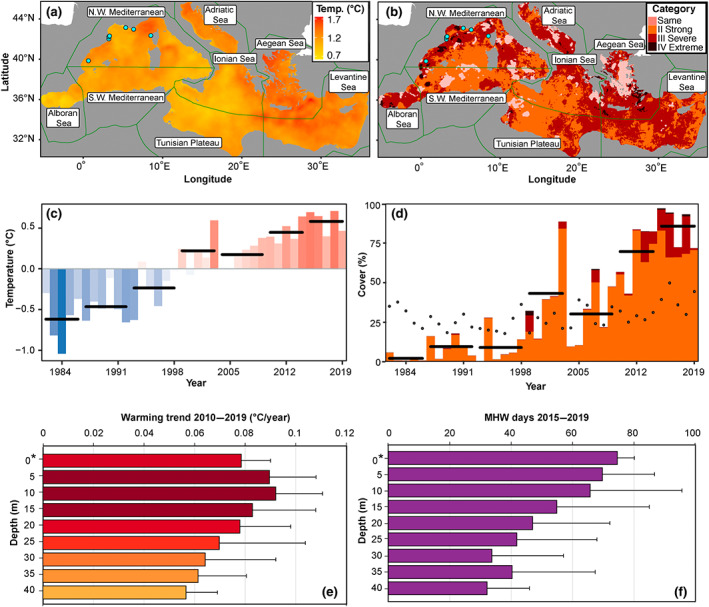
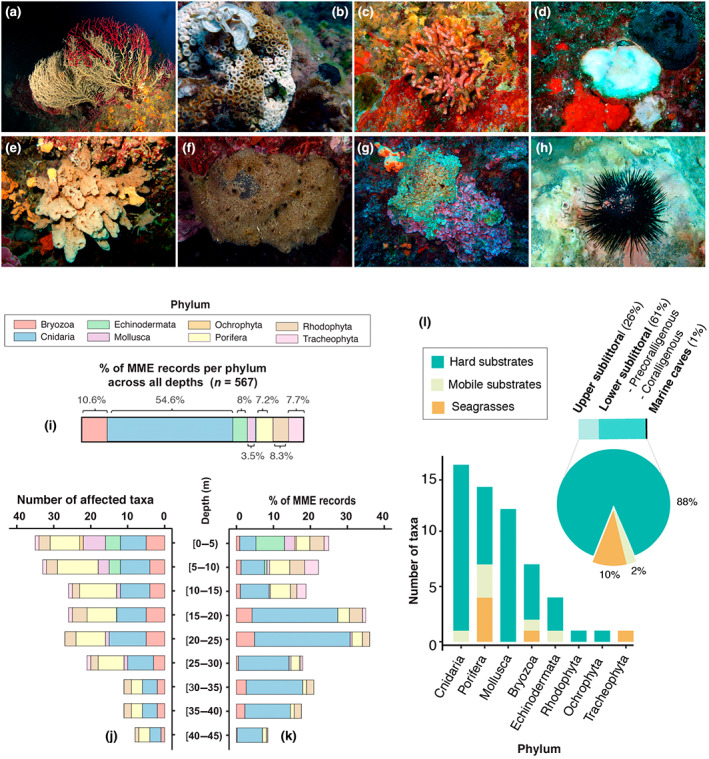
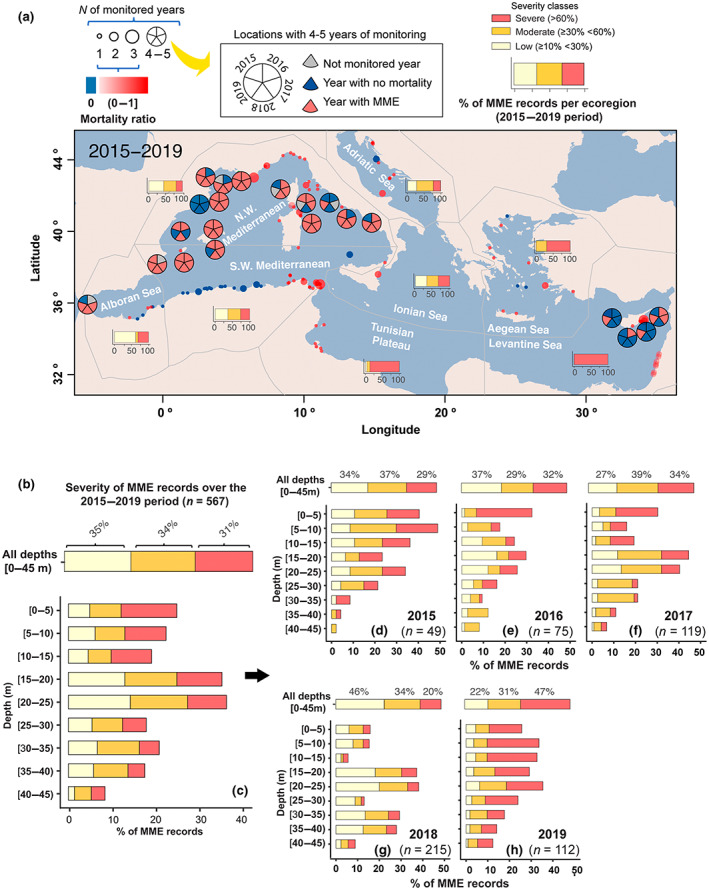
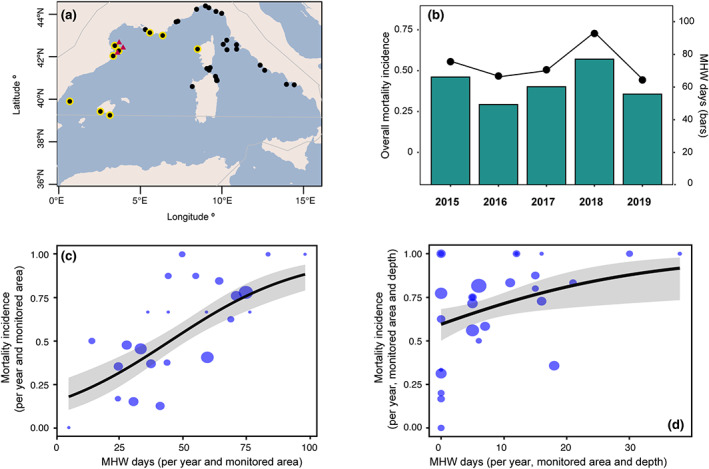
Climate change is causing an increase in the frequency and intensity of marine heatwaves (MHWs) and mass mortality events (MMEs) of marine organisms are one of their main ecological impacts. Here, we show that during the 2015-2019 period, the Mediterranean Sea has experienced exceptional thermal conditions resulting in the onset of five consecutive years of widespread MMEs across the basin. These MMEs affected thousands of kilometers of coastline from the surface to 45 m, across a range of marine habitats and taxa (50 taxa across 8 phyla). Significant relationships were found between the incidence of MMEs and the heat exposure associated with MHWs observed both at the surface and across depths. Our findings reveal that the Mediterranean Sea is experiencing an acceleration of the ecological impacts of MHWs which poses an unprecedented threat to its ecosystems' health and functioning. Overall, we show that increasing the resolution of empirical observation is critical to enhancing our ability to more effectively understand and manage the consequences of climate change.

Keywords: climate change; coralligenous habitats; foundation species; habitat-forming species; impact assessment; marine conservation; marine heatwaves; temperate reefs.


Figures

FIGURE 1
FIGURE 1
Patterns of warming and marine heatwaves (MHWs) across the Mediterranean Sea. (a) The difference in temperature between the mean of 2015 to 2019 minus the mean of 1982 to 1986. Green lines and blue dots have been added to visualize, respectively, the Mediterranean ecoregions and the monitoring areas with in‐situ (along depth) temperature monitoring (also in panel b). (b) The highest category of MHW experienced from 2015 to 2019 at locations where only a category I MHW was experienced in 1982 to 1986. Light pink areas show when a category II or greater MHW occurred in the earlier period. (c) Annual sea surface temperature (SST) anomalies from 1982 to 2019 (climatology period is 1982 to 2019). Horizontal black bars show 5‐year averages over the time series. (d) The annual surface area (%) of the Mediterranean affected by category II or greater MHWs from 1982 to 2019. The color of the bar shows what proportion relates to the MHWs category. Horizontal black bars show roughly 5‐year averages in % of surface affected by category II or greater MHWs; finally the black dots show the average global ocean cover (%) per year for category II or greater MHWs. Category I moderate events are excluded here to allow for a better understanding of the increasing severity of MHWs. (e) The average per depth strata decadal warming trend for 7 nearshore sampling areas from the Northwestern Mediterranean sea. Error bars indicate the standard deviation. The asterisk (*) indicate that satellite data were used for the surface whereas subsurface data originate from in situ monitoring every 5 m from 5 to 40 m depth. (f) The average along depth number of MHW days for the months from June to November over the study period (2015–2019) for the seven Northwestern Mediterranean sampling areas. Error bars indicate the standard error. The asterisk (*) indicate that satellite data were used for the surface, whereas subsurface data originate from in situ monitoring every 5 m from 5 to 40 m depth. The map lines in panels (a) and (b) delineate study areas and do not necessarily depict accepted national boundaries.
FIGURE 2
FIGURE 2
Ecological impacts of the 2015–2019 mass mortality events (MMEs). (a) A red gorgonian Paramuricea clavata colony exhibiting partial mortality (brown areas overgrown by epibionts) contrasting with live tissue (red areas; 35 m depth in Tavolara Island, Sardinia, Italy; photo by: M. Munaretto). (b) A colony of the reef‐building coral Cladocora caespitosa with signs of partial mortality (bare skeleton in white areas) contrasting with live tissue (brown areas; 3–4 m depth in Tabarca Island, Alicante, Spain; photo by A. Izquierdo). (c) A colony of the bryozoan Myriapora truncata showing mortality (white parts overgrown by epibionts; 15 m depth in Ibiza, Balearic Islands, Spain; photo by J. Garrabou), (d) An individual of the mollusk Spondylus gaederopus affected by mortality (white; 25 m depth in Ullastres, Catalan coast; photo by P. López‐Sendino). (e) The massive sponge Agelas oroides exhibiting mortality (brown spongin network free of cellular material) contrasting with the alive orange tissue (16 m depth, Chalkidiki peninsula, North Greece; photo by V. Gerovasileiou). (f) Almost completely dead individual of Spongia officinalis showing brown spongin network free of cellular material (10 m depth in Portofino, Liguria, Italy; photo by F. Betti). (g) Partially dead rhodophyte Mesophyllum sp. (10 m depth, Kalymnos Island, South Greece; photo by M. Sini). (h) Arbacia lixula exhibiting mortality with the loss of spines (3 m depth in Cap de Creus, NE Spain; photo by J. Garrabou). (i) Percentage (%) of MME records per phylum across the entire data set. (j) Number of taxa affected per phylum over depth. (k) Percentage (%) of MME records per phylum over depth. (l) Number of affected taxa per phylum and habitat category (barplot), and percentage (%) of affected habitat category across the overall mortality data set (pie chart).
FIGURE 3
FIGURE 3
Spatio‐temporal patterns of mass mortality event (MME) records and their severity across depths over the 2015–2019 period (a) Spatio‐temporal trends of MME records. For those areas that have been monitored from 1 to 3 years, the size of the circles represents the number of monitoring years, and their transparency is related to a mortality ratio on those areas. The mortality ratio (from 0; minimum to 1; maximum) is calculated by dividing the number of years exhibiting mortality in one area by the total number of monitoring years in that area. In the case of a mortality ratio equal to zero, circles have been colored in blue. For an extended version of this panel showing detailed temporal trends in areas with 1–3 years of monitoring, see Figure S2. For areas with more than 3 years of monitoring, pie charts have been used to represent the temporal trends in each of the 4/5 years of the study. (b) Severity of MME records across the entire data set. (c) Severity of MME records across depth. (d–h) Temporal trends in the severity of MME records across depth. The map lines in panel (a) delineate study areas and do not necessarily depict accepted national boundaries.
FIGURE 4
FIGURE 4
Relationship between heat exposure (marine heatwave [MHW] days) and mortality incidence in the Northwestern Mediterranean ecoregion during 2015–2019. (a) Map of the Northwestern Mediterranean ecoregion showing the location of the monitored areas included in the analysis; black dots indicate all monitored areas in the Northwestern Mediterranean Sea (used in the regional analysis shown in panel b), yellow dots indicate only the monitoring areas considered for the analysis shown in panel c and red triangles indicate the areas with long‐term, in situ temperature monitoring used for the in‐depth analysis shown in panel d (see Section 2.3 for further details). (b) Bars and points show, respectively, the yearly mean number of MHW days and mortality incidence (proportion of records showing mortality) observed across the Northwestern Mediterranean basin. Panels c and d show respectively the relationship between heat exposure (yearly average of MHW days during the JJASON period) at the surface (sea surface temperature) or across depth (from 5 to 40 m) and the corresponding mortality incidence in the studied monitored areas, years, and/or depths. The lines show the predicted values of the generalized linear models and their confidence interval (95%). The size of the points is proportional to the sampling size (number of populations for all the species surveyed in each monitored area, year and/or depth; minimum number = 3, maximum number = 50). The map lines in panel (a) delineate study areas and do not necessarily depict accepted national boundaries.

References

    1. Albano, P. G. , Steger, J. , Bošnjak, M. , Dunne, B. , Guifarro, Z. , Turapova, E. , Hua, Q. , Kaufman, D. S. , Rilov, G. , & Zuschin, M. (2021). Native biodiversity collapse in the eastern Mediterranean. Proceedings of the Royal Society B Biological Sciences, 218(1942), 20202469. 10.1098/rspb.2020.2469 - DOI - PMC - PubMed
    1. Arizmendi‐Mejía, R. , Ledoux, J. B. , Antunes, A. , Thanopoulou, Z. , Garrabou, J. , & Linares, C. (2015). Demographic responses to warming: Reproductive maturity and sex influence vulnerability in an octocoral. Coral Reefs, 34, 1207–1216. 10.1007/s00338-015-1332-9h - DOI
    1. Ballesteros, E. (2006). Mediterranean coralligenous assemblages: A synthesis of present knowledge. Oceanography and Marine Biology: An Annual Review, 44, 123–195.
    1. Banzon, V. , Smith, T. M. , Chin, T. M. , Liu, C. , & Hankins, W. (2016). A long‐term record of blended satellite and in situ sea‐surface temperature for climate monitoring, modeling and environmental studies. Earth System Science Data, 8, 165–176. 10.5194/essd-8-165-2016 - DOI
    1. Banzon, V. , Smith, T. M. , Steele, M. , Huang, B. , & Zhang, H.‐M. (2020). Improved estimation of proxy sea surface temperature in the Arctic. Journal of Atmospheric and Oceanic Technology, 37, 341–349. 10.1175/JTECH-D-19-0177.1 - DOI

LinkOut - more resources