. 2022 Aug 15;135(16):jcs259871.
doi: 10.1242/jcs.259871. Epub 2022 Aug 16.

Respiratory syncytial virus disrupts the airway epithelial barrier by decreasing cortactin and destabilizing F-actin

Affiliations

Respiratory syncytial virus disrupts the airway epithelial barrier by decreasing cortactin and destabilizing F-actin

Nannan Gao et al. J Cell Sci. .

Abstract

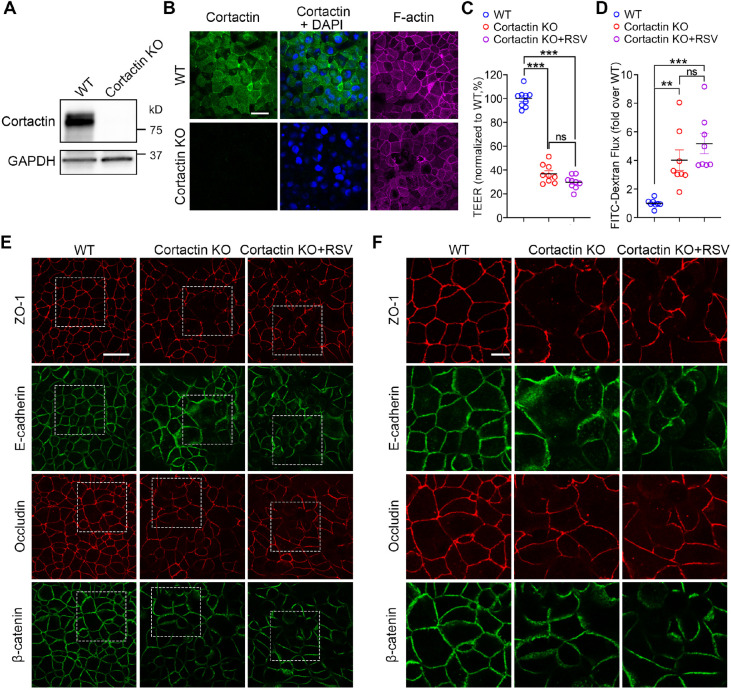
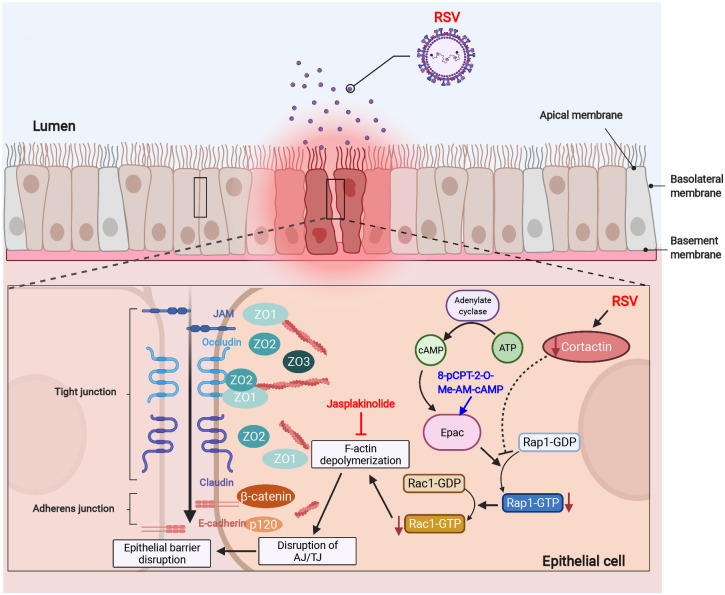
Respiratory syncytial virus (RSV) infection is the leading cause of acute lower respiratory tract infection in young children worldwide. Our group recently revealed that RSV infection disrupts the airway epithelial barrier in vitro and in vivo. However, the underlying molecular pathways were still elusive. Here, we report the critical roles of the filamentous actin (F-actin) network and actin-binding protein cortactin in RSV infection. We found that RSV infection causes F-actin depolymerization in 16HBE cells, and that stabilizing the F-actin network in infected cells reverses the epithelial barrier disruption. RSV infection also leads to significantly decreased cortactin in vitro and in vivo. Cortactin-knockout 16HBE cells presented barrier dysfunction, whereas overexpression of cortactin protected the epithelial barrier against RSV. The activity of Rap1 (which has Rap1A and Rap1B forms), one downstream target of cortactin, declined after RSV infection as well as in cortactin-knockout cells. Moreover, activating Rap1 attenuated RSV-induced epithelial barrier disruption. Our study proposes a key mechanism in which RSV disrupts the airway epithelial barrier via attenuating cortactin expression and destabilizing the F-actin network. The identified pathways will provide new targets for therapeutic intervention toward RSV-related disease. This article has an associated First Person interview with the first author of the paper.

Keywords: Airway epithelial cells; Cortactin; Epithelial barrier; F-actin; RSV; Rap1 GTPase; Respiratory syncytial virus.


Conflict of interest statement

Competing interests The authors declare no competing or financial interests.

Figures

Fig. 1.
Fig. 1.
RSV infection disrupts the F-actin network in airway epithelial cells. (A) Confluent 16HBE cells were infected with control medium (control), UV-RSV or RSV at an MOI of 0.5. After 24 h of infection, cells were fixed with 4% PFA, F-actin network was probed by Alexa Fluor™ 633-phalloidin and visualized by confocal microscopy (visualized as green). Images are representative of three experiments. Scale bar: 25 µm. (B) Confluent 16HBE cells were infected with control medium or RSV for 22 h, then DMSO (vehicle) or 100 nM Jasp. was added for 2 h. Free globular-actin (G-actin, G) and filamentous actin (F-actin, F) fractions were separated from whole-cell lysates and blotted with anti-pan-actin antibodies. (C) The ratio of G-actin to F-actin from experiments shown in B was quantified using densitometry analysis and plotted as normalized values versus control+vehicle. Data shown as mean±s.e.m., n=5 independent experiments, repeated measures one-way ANOVA followed by Tukey's multiple comparisons test. Control+vehicle versus control+100 nM Jasp., not significant (ns), P=0.1038; control+vehicle versus RSV 24 h+vehicle, ***P<0.001 (P=0.0010); RSV 24 h+vehicle versus RSV 24 h+100 nM Jasp., ***P<0.001 (P=0.0002).
Fig. 2.
Fig. 2.
Jasplakinolide treatment restores RSV-induced epithelial barrier disruption. 16HBE cells were infected with RSV or control medium for 22 h, then DMSO (vehicle) or 100 nM Jasp. was added for another 2 h. (A) TEER (Ω cm2) was measured with the volt-ohm meter and plotted as percentage versus control+vehicle. Data shown as mean±s.e.m., n=8 replicates, one-way ANOVA followed by Tukey's multiple comparisons test. Control+vehicle versus control+100 nM Jasp., not significant (ns), P=0.6059; control+vehicle versus RSV 24 h+vehicle, ***P<0.001; RSV 24 h+vehicle versus RSV 24 h+100 nM Jasp., ***P<0.001. (B) The permeability of the epithelial barrier was quantified by measuring the transepithelial flux of 4 kDa FITC-conjugated dextran. Data are presented as normalized values versus control+vehicle. Note that the decreased resistance and increased permeability caused by RSV infection are attenuated in Jasp.-treated cells. Data shown as mean±s.e.m., n=9 replicates, one-way ANOVA followed by Tukey's multiple comparisons test. Control+vehicle versus control+100 nM Jasp., ns, P=0.9491; control+vehicle versus RSV 24 h+vehicle, ***P<0.001; RSV 24 h+vehicle versus RSV 24 h+100 nM Jasp., *P<0.05 (P=0.0207). (C,D) Jasplakinolide treatment does not affect RSV infection of 16HBE cells. (C) Whole-cell lysates were collected and subjected to western blotting with the indicated antibodies. GAPDH was used as the control for protein loading. (D) The expression of RSV-G glycoprotein was analyzed by densitometry and plotted as normalized values as indicated. Data shown as mean±s.e.m., n=3 independent experiments, paired two-tailed Student's t-test, not significant (ns), P=0.8105. (E) The structure of the AJC was determined by immunostaining with antibodies towards tight junction protein ZO-1 and occludin (red) as well as adherens junction protein E-cadherin and β-catenin (green). Arrows indicate disrupted AJCs in RSV-infected cells. Images are representative of four experiments. Scale bar: 25 µm.
Fig. 3.
Fig. 3.
Cortactin decreases during RSV infection in airway epithelial cells in vitro and in vivo. (A) Representative western blot of whole-cell lysates from 16HBE cells infected with control medium (Con.), UV-RSV or RSV for 0–48 h. GAPDH served as the control for protein loading. (B,C) Densitometry analysis of blots from experiments as in A. The protein level of cortactin was determined by densitometric analysis and plotted as normalized values as indicated. Data shown as mean±s.e.m., n=3 independent experiments, repeated measures one-way ANOVA followed by Dunnett's multiple comparisons test. Control versus UV-RSV 3 h, not significant (ns), P=0.7255; control versus UV-RSV 6 h, ns, P=0.5035; control versus UV-RSV 12 h, ns, P=0.3928; control versus UV-RSV 24 h, ns, P=0.4937; control versus UV-RSV 48 h, ns, P=0.9883. Control versus RSV 3 h, ns, P=0.1151; control versus RSV 6 h, *P<0.05 (P=0.0319); control versus RSV 12 h, **P<0.01 (P=0.0062); control versus RSV 24 h, ***P<0.001 (P=0.0009); control versus RSV 48 h, ***P<0.001 (P=0.0005). (D) 16HBE cells were infected with control medium (Con.), UV-RSV or RSV for 24 h and fixed, cells were immunolabeled with antibodies against cortactin and imaged by confocal microscopy (green). (E) Primary NHBE cells were differentiated at the air–liquid interface for 33 days and infected with control medium, UV-RSV or RSV (MOI=2). At 4 days after infection, cells were fixed, immunostained with antibodies against cortactin, and imaged by confocal microscopy (green). (F–H) Representative images of lung tissue from mice inoculated with control (RSV growing medium) (F), UV-RSV (G), or RSV (H). Mice were intranasally inoculated and euthanized 4 days later. Lung tissues were harvested and sections were subjected to immunohistochemistry using antibodies again cortactin (green) and E-cadherin (red). Enlarged images of small airways from the indicated area are shown underneath overview images. Images in D–H are representative of at least three experiments. Scale bars: 25 µm.
Fig. 4.
Fig. 4.
Epithelial barrier integrity is disrupted in cortactin KO 16HBE cells. (A) Representative western blot of whole-cell lysates from WT and cortactin KO 16HBE cells. GAPDH served as the control for protein loading. Image representative of four experiments. (B) WT and cortactin KO 16HBE cells were fixed with 4% PFA, labeled with antibodies or probes, and imaged by confocal microscopy. Cortactin was immunolabeled with antibodies and visualized as green, nuclei were labeled by DAPI and visualized as blue; the F-actin network was probed by Alexa Fluor™ 633-phalloidin and visualized as magenta. Images are representative of three experiments. Scale bar: 25 µm. (C,D) 16HBE cells of the indicated genotype were seeded at the same density and cultured until they were confluent; RSV-infected cortactin KO cells were infected by RSV for 24 h. Cortactin KO epithelial cells presented disrupted barrier integrity, shown as reduced resistance and increased permeability compared with WT cells, and RSV did not cause significant additional impacts on the barrier function in cortactin KO cells. (C) TEER (Ω cm2) was measured by a volt-ohm meter and plotted as a percentage versus WT. Data shown as mean±s.e.m., n=9 replicates from three independent KO clones, one-way ANOVA followed by Tukey's multiple comparisons. WT versus cortactin KO, ***P<0.001; WT versus cortactin KO+RSV, ***P<0.001; cortactin KO versus cortactin KO+RSV not significant (ns), P=0.0948. (D) The permeability of the epithelial barrier was evaluated by the transepithelial flux of 4 kDa FITC-conjugated dextran and normalized to WT. Data shown as mean±s.e.m., n=8 replicates from three independent KO clones, one-way ANOVA followed by Tukey's multiple comparisons. WT versus cortactin KO, **P<0.01 (P=0.0074); WT versus cortactin KO+RSV, ***P<0.001 (P=0.0007); cortactin KO versus cortactin KO+RSV not significant (ns), P=0.2198. (E,F) The structure of the AJC was determined by immunostaining with antibodies towards tight junction protein ZO-1 and occludin (red) as well as the AJ junction proteins E-cadherin and β-catenin (green). Higher magnifications of the areas indicated are E are shown in F. Scale bars: 25 μm (E), 10 µm (F).
Fig. 5.
Fig. 5.
Cortactin overexpression attenuates RSV-induced epithelial barrier dysfunction. Non-confluent 16HBE cells were transfected with GFP plasmid or GFP–cortactin plasmid using LipofectamineTM 3000 reagent. Cells were infected with RSV or control medium 40 h after the transfection. (A) Representative western blot of whole-cell lysates from 16HBE cells transfected with GFP or GFP–cortactin plasmids. GAPDH served as the control for protein loading. Images are representative of two experiments. (B) The expression of GFP or GFP-cortactin in transfected 16HBE cells was directly visualized by imaging the Transwell inserts with an inverted fluorescence microscope without staining (green). Images are representative of four experiments. Scale bar: 50 µm. (C) TEER (Ω cm2) was measured by a volt-ohm meter and plotted as percentage versus GFP+control. Data shown as mean±s.e.m., n=9 replicates, one-way ANOVA followed by Tukey's multiple comparisons test. GFP+control versus GFP-cortactin+control, not significant (ns), P=0.9880; GFP+control versus GFP+RSV 24 h, ***P<0.001; GFP+RSV 24 h versus GFP–cortactin+RSV 24 h, *P<0.05 (P=0.0122). (D) Permeability of the epithelial barrier was quantified by the transepithelial flux of 4 kDa FITC-conjugated dextran and normalized to GFP+control. Data shown as mean±s.e.m., n=7 or 9 replicates, one-way ANOVA followed by Tukey's multiple comparisons test, GFP+control versus GFP–cortactin+control, not significant (ns), P=0.3566; GFP+control versus GFP+RSV 24 h, ***P<0.001 (P=0.0005); GFP+RSV 24 h versus GFP–cortactin+RSV 24 h, ***P<0.001 (P=0.0005). (E) The structure of the AJC was determined by immunostaining with antibodies towards ZO-1 or E-cadherin (red) along with GFP (green). Asterisks indicate cells transfected by indicated plasmids. Images are representative of three experiments. Scale bar: 25 µm.
Fig. 6.
Fig. 6.
Rap1 activity decreases during RSV infection and in the absence of cortactin. (A) 16HBE cells were infected with control medium (Con.) or RSV for the indicated period and subsequently subjected to Rap1 activity assays. Rap1-GTP was pulled down from cell lysates with GST-RalGDS RBD beads and analyzed by immunoblotting with anti-Rap1 antibodies. Rap1 was analyzed in the whole-cell lysate. GAPDH was used as the control for protein loading. (B) Quantification of immunoblots from experiments as in A. The ratio of Rap1-GTP to Rap1 was determined by densitometric analysis and plotted as normalized values versus control. Data shown as mean±s.e.m., n=3 independent experiments, repeated measures one-way ANOVA followed by Dunnett's multiple comparisons. Control versus RSV 3 h, not significant (ns), P=0.9855; control versus RSV 6 h, ns, P=0.9919; control versus RSV 18 h, *P<0.05 (P=0.0475); control versus RSV 24 h, *P<0.05 (P=0.0417). (C) WT, cortactin KO and RSV-infected cortactin KO 16HBE cells were subjected to Rap1 activity assays. Rap1-GTP was pulled down from cell lysates with GST-RalGDS RBD beads and analyzed by immunoblotting with anti-Rap1 antibodies. Rap1 was analyzed in the whole-cell lysate. GAPDH was used as the control for protein loading. (D) Quantification of immunoblots from experiments as in C. The Rap1-GTP to Rap1 ratio was determined by densitometric analysis and normalized to WT. Data shown as mean±s.e.m., n=3 replicates from three independent KO clones, one-way ANOVA followed by Tukey's multiple comparisons. WT versus cortactin KO, *P<0.05 (P=0.0411); WT versus cortactin KO+RSV, *P<0.05 (P=0.0284); cortactin KO versus cortactin KO+RSV not significant (ns), P=0.9490.
Fig. 7.
Fig. 7.
Rap1 activation mitigates the epithelial barrier dysfunction caused by RSV infection. 16 HBE cells were infected with RSV or control medium for 22 h and DMSO (vehicle) or 5 µM 8-pCPT-AM was added for another 2 h. Treatment of 8-pCPT-AM alleviated reduced resistance and increased permeability caused by RSV. (A) TEER (Ω cm2) was measured with a volt-ohm meter and plotted as percentage versus control+vehicle. Data shown as mean±s.e.m., n=8 replicates, one-way ANOVA followed by Tukey's multiple comparisons test. Control+vehicle versus control+5 µM 8-pCPT-AM, not significant (ns), P=0.9184; control+vehicle versus RSV 24 h+vehicle, ***P<0.001; RSV 24 h+vehicle versus RSV 24 h+5 µM 8-pCPT-AM, ***P<0.001 (P=0.0007). (B) Permeability of the epithelial barrier was quantified by measuring the transepithelial flux of 4 kDa FITC-conjugated dextran and normalized to control+vehicle. Data shown as mean±s.e.m., n=8 replicates, one-way ANOVA followed by Tukey's multiple comparisons test. Control+vehicle versus control+5 µM 8-pCPT-AM, not significant (ns), P=0.8495; control+vehicle versus RSV 24 h+vehicle, **P<0.01 (P=0.0036); RSV 24 h+vehicle versus RSV 24 h+5 µM 8-pCPT-AM, *P=0.0321. (C) The structure of the AJC was determined by immunostaining with antibodies towards tight junction protein ZO-1 (red) and adherens junction protein E-cadherin (green). Arrows indicate disrupted AJCs in RSV-infected cells. Images are representative of three experiments. Scale bar: 25 µm.
Fig. 8.
Fig. 8.
A graphical model showing mechanism through which RSV infection induces epithelial barrier dysfunction. RSV infection disrupts the epithelial barrier via attenuating the cortactin/Rap1 signaling pathway and depolymerizing F-actin. In RSV-infected epithelial cells, the protein level of cortactin reduces, which in turn attenuates the activity of the Rap1/Rac1 signaling pathway and leads to F-actin depolymerization. Destabilization of the actin network finally results in disrupted structure and increased permeability of the airway epithelial barrier through disassembly of the AJC, which is extensively associated with the F-actin network. These RSV-induced barrier dysfunctions will be mitigated via activation of Rap1 signaling by Epac activator 8-pCPT-2-O-Me-cAMP-AM or F-actin stabilization by jasplakinolide. This image was created with BioRender.com.

Similar articles

Cited by

References

    1. Adamson, R. H., Ly, J. C., Sarai, R. K., Lenz, J. F., Altangerel, A., Drenckhahn, D. and Curry, F. E. (2008). Epac/Rap1 pathway regulates microvascular hyperpermeability induced by PAF in rat mesentery. Am. J. Physiol. Heart Circ. Physiol. 294, H1188-H1196. 10.1152/ajpheart.00937.2007 - DOI - PubMed
    1. Ammer, A. G. and Weed, S. A. (2008). Cortactin branches out: roles in regulating protrusive actin dynamics. Cell Motil. Cytoskeleton 65, 687-707. 10.1002/cm.20296 - DOI - PMC - PubMed
    1. Anderson, J. M., Van Itallie, C. M. and Fanning, A. S. (2004). Setting up a selective barrier at the apical junction complex. Curr. Opin. Cell Biol. 16, 140-145. 10.1016/j.ceb.2004.01.005 - DOI - PubMed
    1. Bednarek, R. (2022). In Vitro methods for measuring the permeability of cell monolayers. Methods Protoc. 5, 17. 10.20944/preprints202201.0029.v1 - DOI - PMC - PubMed
    1. Blanchoin, L., Boujemaa-Paterski, R., Sykes, C. and Plastino, J. (2014). Actin dynamics, architecture, and mechanics in cell motility. Physiol. Rev., 94, 235-263. 10.1152/physrev.00018.2013 - DOI - PubMed

Publication types