. 2022 Oct;113(10):3437-3448.
doi: 10.1111/cas.15493. Epub 2022 Jul 28.

Polarity switching of ovarian cancer cell clusters via SRC family kinase is involved in the peritoneal dissemination

Affiliations

Polarity switching of ovarian cancer cell clusters via SRC family kinase is involved in the peritoneal dissemination

Mayuko Kawata et al. Cancer Sci. 2022 Oct.

Abstract

Peritoneal dissemination is a predominant pattern of metastasis in patients with advanced ovarian cancer. Despite recent progress in the management strategy, peritoneal dissemination remains a determinant of poor ovarian cancer prognosis. Using various histological types of patient-derived ovarian cancer organoids, the roles of the apicobasal polarity of ovarian cancer cell clusters in peritoneal dissemination were studied. First, it was found that both ovarian cancer tissues and ovarian organoids showed apicobasal polarity, where zonula occludens-1 (ZO-1) and integrin beta 4 (ITGB4) served as markers for apical and basal sides, respectively. The organoids in suspension culture, as a model of cancer cell cluster floating in ascites, showed apical-out/basal-in polarity status, while once embedded in extracellular matrix (ECM), the organoids switched their polarity to apical-in/basal-out. This polarity switch was accompanied by the SRC kinase family (SFK) phosphorylation and was inhibited by SFK inhibitors. SFK inhibitors abrogated the adherence of the organoids onto the ECM-coated plastic surface. When the organoids were seeded on a mesothelial cell layer, they cleared and invaded mesothelial cells. In vivo, dasatinib, an SFK inhibitor, suppressed peritoneal dissemination of ovarian cancer organoids in immunodeficient mice. These results suggest SFK-mediated polarity switching is involved in peritoneal metastasis. Polarity switching would be a potential therapeutic target for suppressing peritoneal dissemination in ovarian cancer.

Keywords: SRC family kinase; cell polarity; metastasis; organoids; ovarian cancer.


Figures

FIGURE 1
FIGURE 1
Ovarian cancer (OC) tissue and cell clusters exhibit apicobasal polarity. A, Hematoxylin and eosin staining (HE, upper panels) and immunofluorescent images (IF, lower panels) of OC organoid–derived xenograft tumors. Green, ITGB4; red, ZO‐1; blue, DAPI; scale bars, 100 μm. B, Bright‐field images of cell clusters obtained from peritoneal fluid of patients with OC. Boxed areas in the upper panels are enlarged in the lower panels. Scale bars, 100 μm. C, Immunofluorescent staining of OC cell clusters in peritoneal fluid. Green, ITGB4; red, Z‐1; blue, DAPI; scale bars, 50 μm. D, Bright‐field images (BF) and immunofluorescent images (IF) of OC organoids derived from five different patients. Green, ITGB4; red, ZO‐1; blue, DAPI; scale bars, 50 μm
FIGURE 2
FIGURE 2
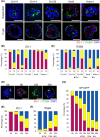
The polarity of the ovarian cancer (OC) cell cluster exhibits dynamic changes upon contact with extracellular matrix (ECM). A, Immunofluorescent staining of OC organoids under suspended culture (upper panels) and Matrigel‐embedded culture (lower panels). Histological subtypes for each case are described in Table S1. Green, ITGB4; red, ZO‐1; blue, DAPI; scale bars, 50 μm. B, C, Quantitative analysis of ZO‐1 (B) and ITGB4 (C) localization at suspended culture condition (S) and Matrigel‐embedded condition (G). N = 50 for each condition. D‐F, Time course changes in the polarity status of Ov114 organoids after embedding in Matrigel. Representative immunofluorescent images of each time point (D) and quantitative analyses of ZO‐1 (E) and ITGB4 (F) localization at each time point are shown. N = 50 for each condition. Green, ITGB4; red, ZO‐1; blue, DAPI; scale bars, 50 μm. G, Time course changes in the polarity status of GPI‐GFP Ov114 organoids after embedding in Matrigel. Definition and representative images of each status are described in Figure S3
FIGURE 3
FIGURE 3
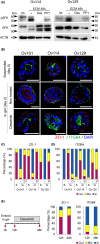
Polarity switching of ovarian cancer (OC) cell clusters occurs via SRC family kinase (SFK) activation triggered by contact with extracellular matrix (ECM). A, Western blot of Ov114 and Ov129 organoids before (0 h) and after being embedded in Matrigel and cultured for 48 h (ECM 48 h) in the absence or presence of SFK inhibitors (500 nM dasatinib [Das] and 10 μM PP1). Beta‐actin (ACTB) was used for loading control. B, Immunofluorescent images of organoids embedded in Matrigel cultured with or without 500 nM dasatinib. Green, ITGB4; red, ZO‐1; blue, DAPI; scale bars, 50 μm. C, D, Quantitative analysis of ZO‐1 (C) and ITGB4 (D) localization after embedding in Matrigel with dasatinib treatment. Polarity status was evaluated for suspended (S) and Matrigel‐embedded condition (G), either nontreated (−) or with dasatinib (D). The data for suspended culture, as baseline control, is identical with Figure 2E,F. N = 50 for each condition. E, Illustrated protocol for the experiment (left panel). Dasatinib treatment started 12 h after embedding in Matrigel and was evaluated 48 h after embedding. Quantitative analysis of ZO‐1 (middle panel) and ITGB4 (right panel) localization of Ov114 organoids. N = 50 for each condition
FIGURE 4
FIGURE 4
Polarity switching is involved in the adhesion of cell clusters to matrices. A, Confocal immunofluorescent images of Ov114 organoid adhering on Matrigel‐coated plastic surface at 24 and 48 h. Images are shown with orthogonal views, as illustrated in the left panel. Green, ITGB4; red, ZO‐1; blue, DAPI; scale bars, 50 μm. B, Time course quantitative analysis of ITGB4 expression at the adhering interface of Ov114 organoids and extracellular matrix (ECM) coated plastic surface. Organoids that failed to adhere to the plastic surface were excluded from the quantification. N = 30 for each time point. *p < 0.05, Dunnett's test. C, Time course quantitative analysis of Ov114 organoids tightly adhered to the Matrigel‐coated plastic surface. After shaking the culture plate, the percentage of organoids persisting on the plastic surface was quantified. N = 3 for each time point. Data are presented as mean ± SD. D, Quantitative analysis of the organoids tightly adhered to the Matrigel‐coated plastic surface. Percentages of organoids treated with increasing doses of dasatinib were quantified for persistence on the plastic surface after shaking the culture plate. N = 3 for each dose. Data are presented as mean ± SD, *p < 0.05, Dunnett's test. E, Illustrated protocol for the quantitative analysis of organoids adhering on the Matrigel‐coated plastic surface (left panel). Dasatinib was added 24 h after placing organoids on the ECM‐coated plates. Relative change of the area of the organoids persisting on the plastic surface is shown. N = 3 for each condition. Data are presented as mean ± SD
FIGURE 5
FIGURE 5
Polarity switching occurs during the invasion of OC cell clusters through mesothelial cell sheet. A, Images of Ov114 organoid invading HOMC‐B1 mesothelial cell sheet. Bright‐field image (upper left), mCherry‐expressing mesothelial cells (red, upper right), GPI‐GFP Ov114 organoid (green, lower left), and merged image (lower right) are shown. Dotted line indicates the area where HOMC‐B1 cells were cleared. Scale bars, 100 μm. B, Quantitative analysis of cleared areas in HOMC‐B1 cell sheet by invading GPI‐GFP Ov114 organoids. Data are presented as box plots. Each dot indicates a cleared spot. N = 17, 31, and 40 for each time point. *p < 0.05, Steel‐Dwass test. C, Confocal immunofluorescent images of Ov114 organoid attached on the mCherry (red)‐expressing HOMC‐B1 cells labeled for ITGB4 (green). Images of the XY plane (panels ii and v) are shown with orthogonal views (panels i, iii, iv, and vi). Yellow arrowheads indicate the interface of mesothelial cells and metastatic cancer cell clusters lacking ITGB4 expression. Green, ITGB4; red, mCherry;, blue, DAPI; scale bars, 50 μm
FIGURE 6
FIGURE 6
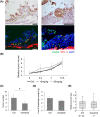
SRC family kinase (SFK) inhibition suppresses peritoneal metastasis of ovarian cancer (OC) cell clusters in vivo. A, Immunohistochemistry images for E‐cadherin (upper panels) and immunofluorescent images (lower panels; green, ITGB4; red, ZO‐1; blue, DAPI) of serial sections from peritoneal metastatic foci of Ov114 in NSG mouse. Two representative foci are shown. Yellow arrowheads indicate the border of the tumor and peritoneal wall in each focus. Scale bars, 100 μm. B, Growth curves of subcutaneous xenograft tumors originating from Ov114 organoids with the oral treatment of dasatinib or buffer alone (Ctrl). Data are shown as mean ± SD. N = 6 per group. One‐way ANOVA detected no significance. C, Number of overt peritoneal metastatic foci of NSG mice 4 weeks after peritoneal Ov114 organoids injection, treated either with dasatinib or buffer alone (Ctrl). Data are presented as mean ± SD. N = 4 per group. *p < 0.05, t test. D, Weight of the liver and the diaphragm of NSG mice 4 weeks after peritoneal Ov114 organoids injection, treated either with dasatinib or buffer alone (Ctrl). Data are presented as mean ± SD. N = 4 per group. No significance was detected using t test. E, Relative tumor volume of overt peritoneal metastatic foci in NSG mice 4 weeks after peritoneal Ov114 organoids injection, treated either with dasatinib or buffer alone (Ctrl). Data are presented as box plots. N = 24 and 11 per group. No significance was detected using the Wilcoxon rank‐sum test

Similar articles

Cited by

References

    1. Lheureux S, Braunstein M, Oza AM. Epithelial ovarian cancer: evolution of management in the era of precision medicine. CA Cancer J Clin. 2019;69(4):280‐304. - PubMed
    1. Bast RC, Hennessy B, Mills GB. The biology of ovarian cancer: new opportunities for translation. Nat Rev Cancer. 2009;9(6):415‐428. - PMC - PubMed
    1. Torre LA, Trabert B, DeSantis CE, et al. Ovarian cancer statistics, 2018. CA Cancer J Clin. 2018;68(4):284‐296. - PMC - PubMed
    1. Motohara T, Masuda K, Morotti M, et al. An evolving story of the metastatic voyage of ovarian cancer cells: cellular and molecular orchestration of the adipose‐rich metastatic microenvironment. Oncogene. 2019;38(16):2885‐2898. - PMC - PubMed
    1. Farsinejad S, Cattabiani T, Muranen T, Iwanicki M. Ovarian cancer dissemination—a cell Biologist's perspective. Cancer. 2019;11(12):1957. - PMC - PubMed