

External Validation and Clinical Applicability of Two Optical Coherence Tomography-Based Risk Calculators for Detecting Glaucoma
- PMID: 35848905
- PMCID: PMC9308015
- DOI: 10.1167/tvst.11.7.14
External Validation and Clinical Applicability of Two Optical Coherence Tomography-Based Risk Calculators for Detecting Glaucoma
Abstract
Purpose: To clinically validate the diagnostic ability of two optical coherence tomography (OCT)-based glaucoma diagnostic calculators (GDCs).
Methods: We conducted a retrospective, consecutive sampling of 76 patients with primary open-angle glaucoma, 107 glaucoma suspects, and 67 controls. Demographics, reliable visual field testing, and macular and optic disc OCT were collected. The reference diagnosis was compared against the probability of having glaucoma obtained from two GDCs derived from multivariate logistic regressions using quantitative and qualitative (GDC1) or only quantitative (GDC2) OCT data. The discrimination (area under the curve [AUC]) and calibration (calibration plots) were compared for both calculators and the best OCT parameters.
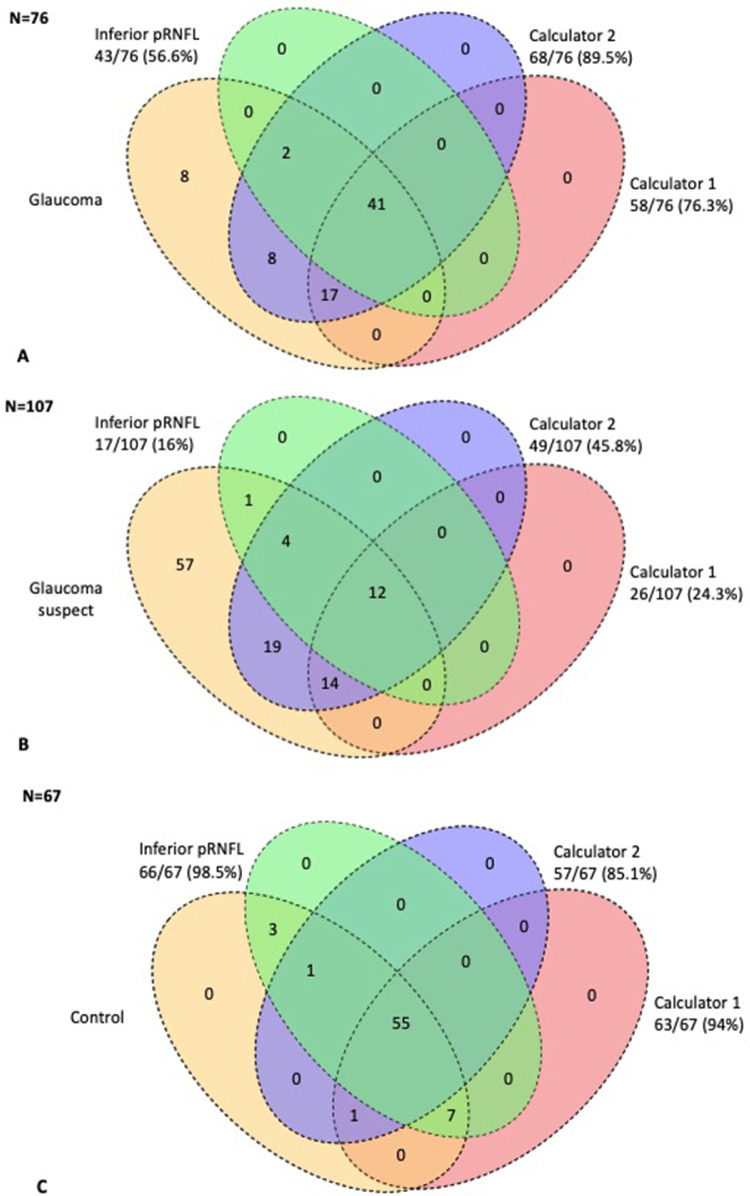
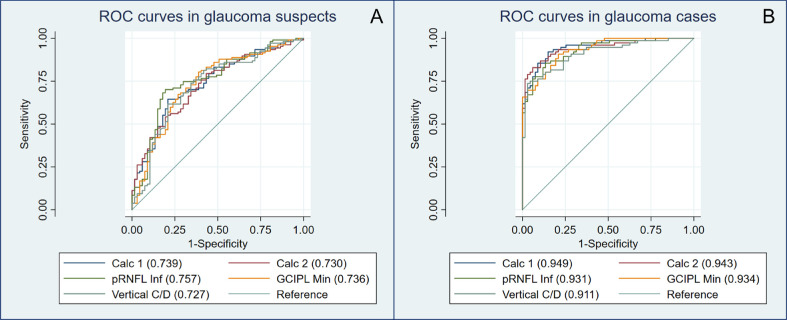
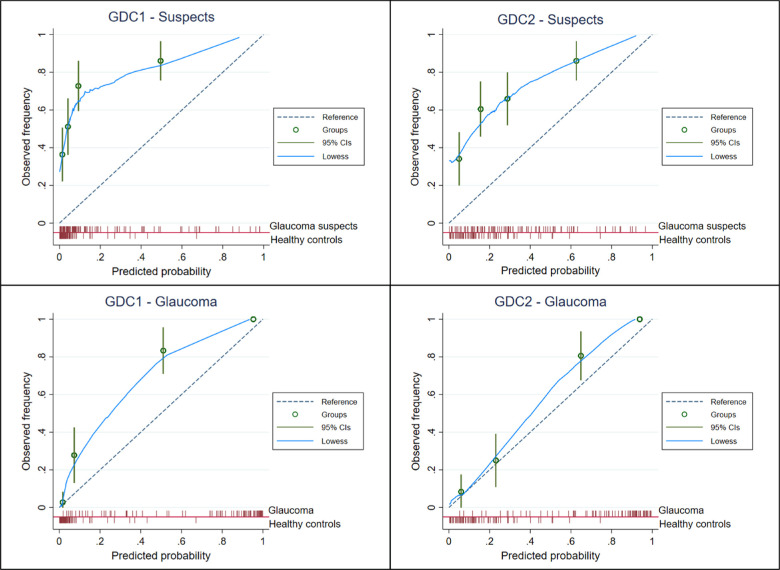
Results: GDC2 was able to identify 46.9% more suspects and 14.7% more glaucomatous eyes than GDC1. Both GDCs obtained the highest discriminative ability in glaucomatous eyes (GDC1 AUC = 0.949; GDC2 = 0.943 vs inferior peripapillary retinal nerve fiber layer [pRNFL] = 0.931; P = 0.43). The discriminating ability was not as good for glaucoma suspects, but the GDCs were not inferior to pRNFL (GDC 1 AUC = 0.739; GDC2 = 0.730; inferior pRNFL = 0.760; P = 0.54) and GDC2 was still able to correctly identify up to 30.8% more cases than the conventional OCT classification. Calibration showed risk underestimation for both groups and calculators, but it was better in GDC2 and in patients with glaucoma.
Conclusions: OCT-based calculators showed an excellent diagnostic performance in glaucomatous eyes. GDC2 was able to identify approximately 30% more cases than the conventional pRNFL inferior OCT classification in both groups, suggesting a potential role of these composite scores in clinical practice.
Translational relevance: These OCT-based calculators may improve glaucoma diagnosis in clinical care.
Conflict of interest statement
Disclosure:
Figures
Similar articles
-
Comparison of confocal scanning laser ophthalmoscopy, scanning laser polarimetry and optical coherence tomography to discriminate ocular hypertension and glaucoma at an early stage.Graefes Arch Clin Exp Ophthalmol. 2006 Jan;244(1):58-68. doi: 10.1007/s00417-005-0029-0. Epub 2005 Jul 26. Graefes Arch Clin Exp Ophthalmol. 2006. PMID: 16044326
-
Comparison of Peripapillary Retinal Nerve Fiber Layer Thickness, Functional Subzones, and Macular Ganglion Cell-Inner Plexiform Layer in Differentiating Patients With Mild, Moderate, and Severe Open-angle Glaucoma.J Glaucoma. 2020 Sep;29(9):761-766. doi: 10.1097/IJG.0000000000001598. J Glaucoma. 2020. PMID: 32657819
-
SD-OCT peripapillary nerve fibre layer and ganglion cell complex parameters in glaucoma: principal component analysis.Br J Ophthalmol. 2021 Apr;105(4):496-501. doi: 10.1136/bjophthalmol-2020-316296. Epub 2020 Jun 3. Br J Ophthalmol. 2021. PMID: 32493759
-
Color Reflectivity Discretization Analysis of OCT Images in the Detection of Glaucomatous Nerve Fiber Layer Defects.J Glaucoma. 2016 Apr;25(4):e346-54. doi: 10.1097/IJG.0000000000000363. J Glaucoma. 2016. PMID: 26766397
-
Macular imaging for glaucoma using spectral-domain optical coherence tomography: a review.Semin Ophthalmol. 2012 Sep-Nov;27(5-6):160-6. doi: 10.3109/08820538.2012.712734. Semin Ophthalmol. 2012. PMID: 23163271 Review.
References
-
- Tham Y-C, Li X, Wong TY, Quigley HA, Aung T, Cheng C-Y.. Global prevalence of glaucoma and projections of glaucoma burden through 2040: a systematic review and meta-analysis. Ophthalmology. 2014; 121(11): 2081–2090. - PubMed
-
- Lin AP, Katz LJ, Spaeth GL, et al. .. Agreement of visual field interpretation among glaucoma specialists and comprehensive ophthalmologists: comparison of time and methods. Br J Ophthalmol. 2011; 95(6): 828–831. - PubMed
-
- Oddone F, Lucenteforte E, Michelessi M, et al. .. Macular versus retinal nerve fiber layer parameters for diagnosing manifest glaucoma: a systematic review of diagnostic accuracy studies. Ophthalmology. 2016; 123(5): 939–949. - PubMed
-
- Pazos M, Dyrda AA, Biarnés M, et al. .. Diagnostic accuracy of Spectralis SD OCT automated macular layers segmentation to discriminate normal from early glaucomatous eyes. Ophthalmology. 2017; 124(8): 1218–1228. - PubMed
MeSH terms
LinkOut - more resources
Full Text Sources
Other Literature Sources
Medical
Miscellaneous
