. 2022 Aug 12;50(14):8207-8225.
doi: 10.1093/nar/gkac605.

Melanoma RBPome identification reveals PDIA6 as an unconventional RNA-binding protein involved in metastasis

Affiliations

Melanoma RBPome identification reveals PDIA6 as an unconventional RNA-binding protein involved in metastasis

Neus Mestre-Farràs et al. Nucleic Acids Res. .

Abstract

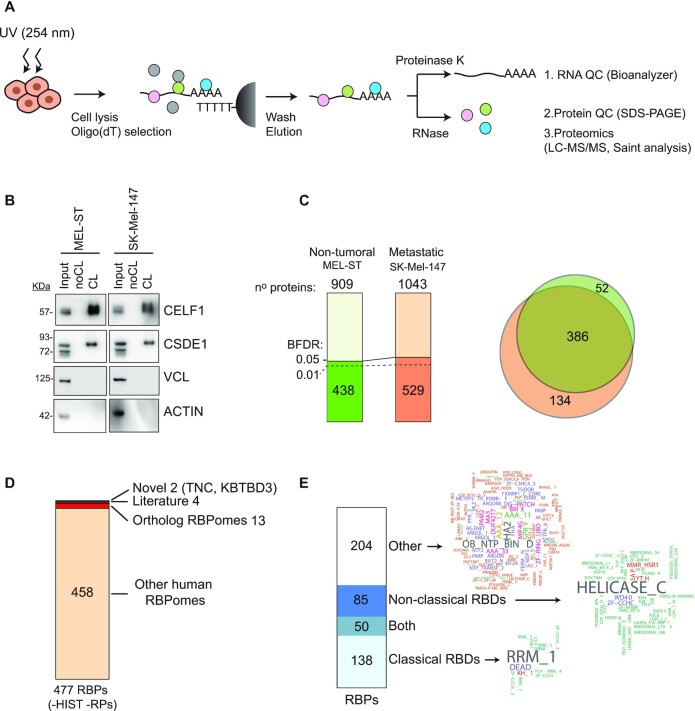
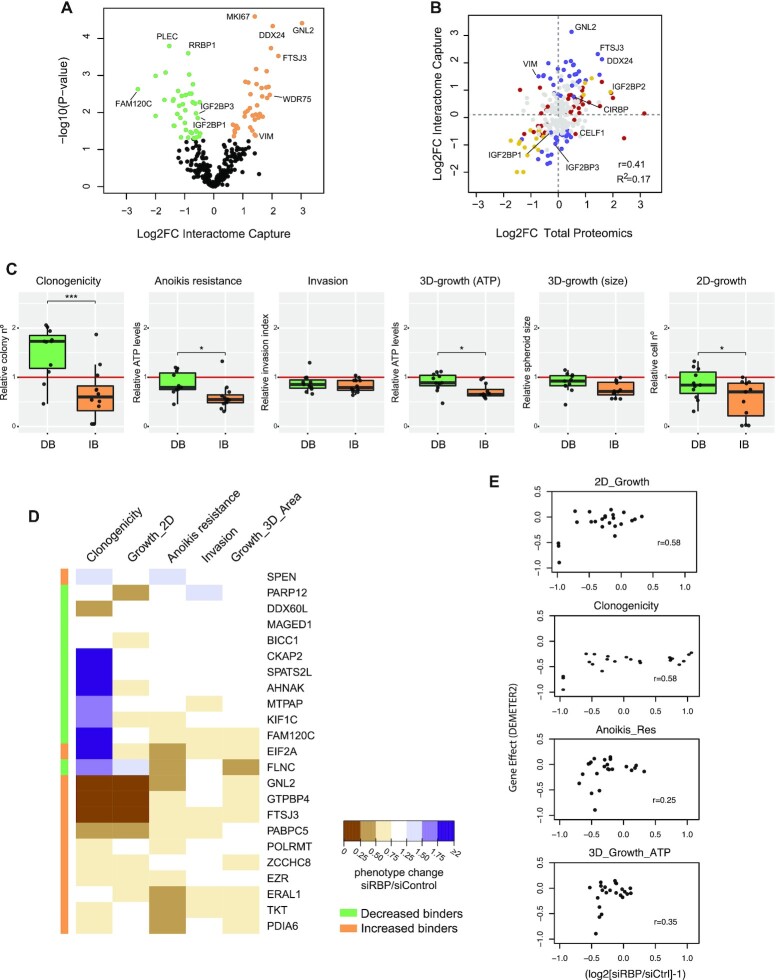
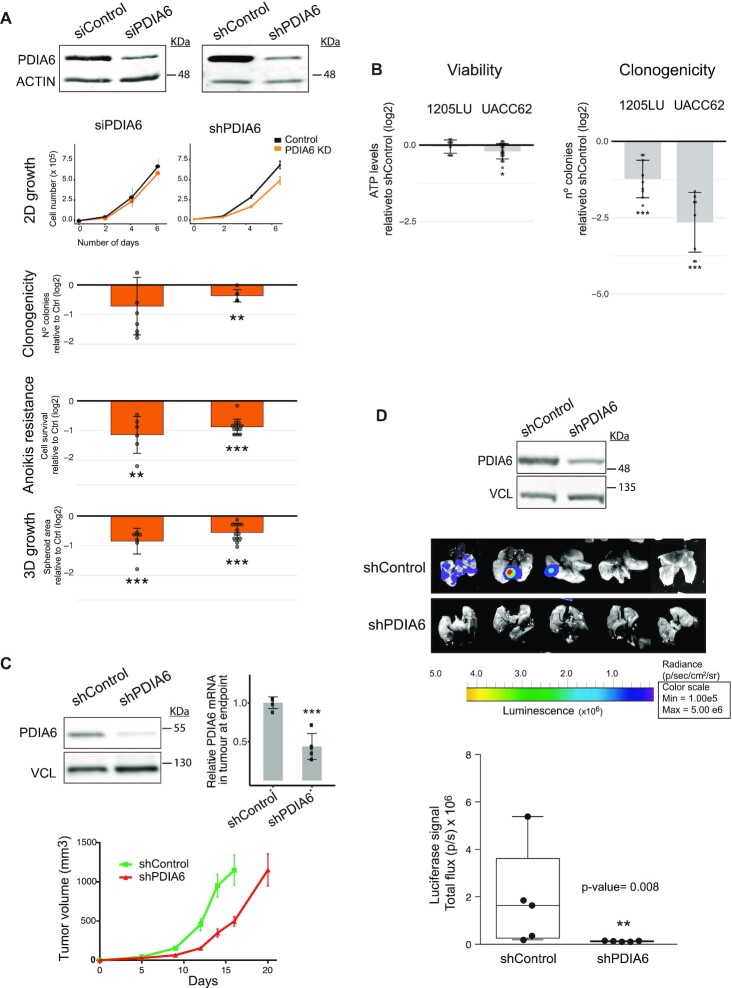
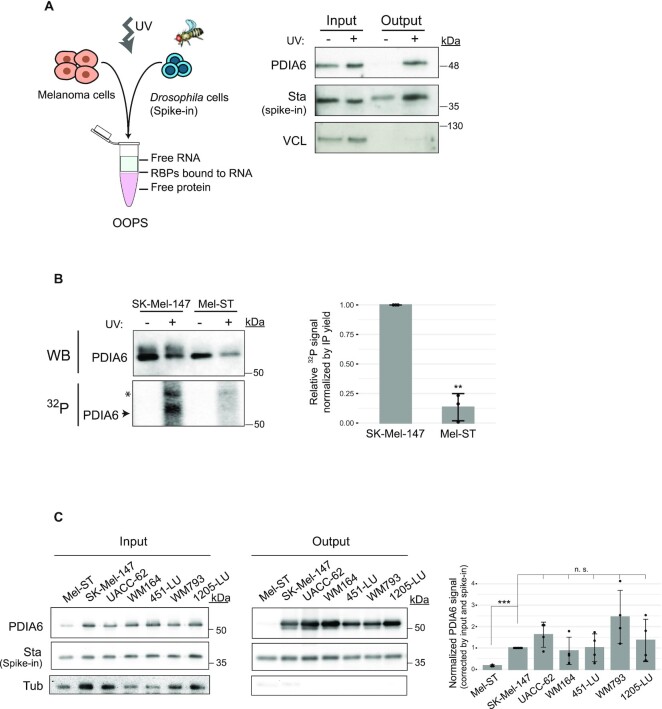
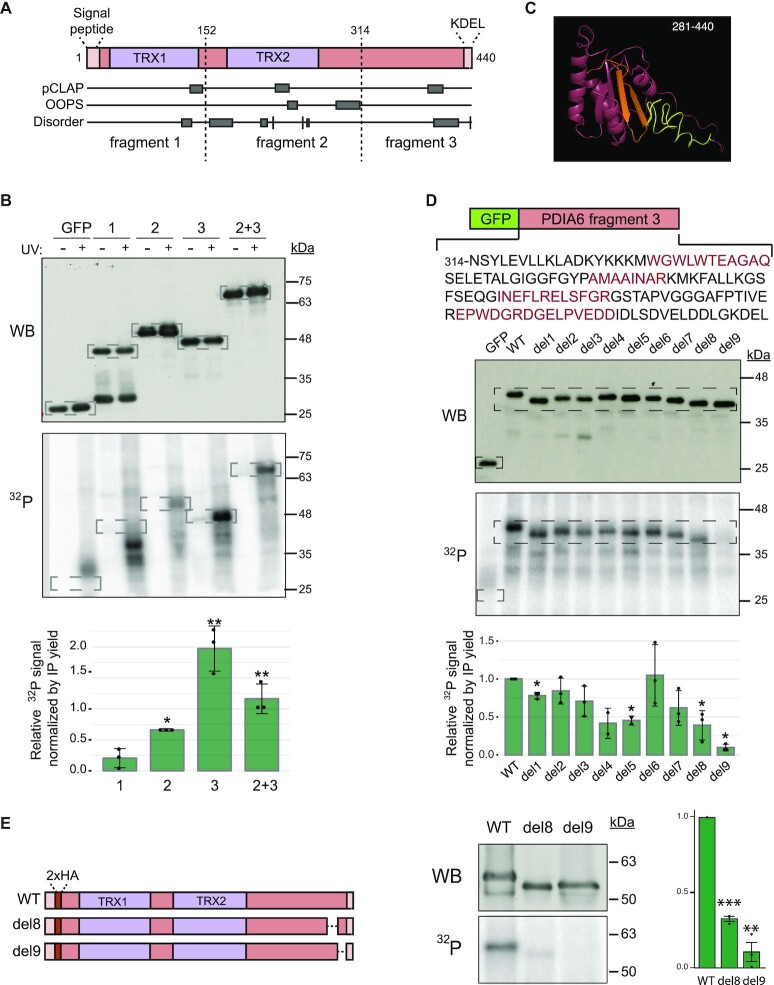
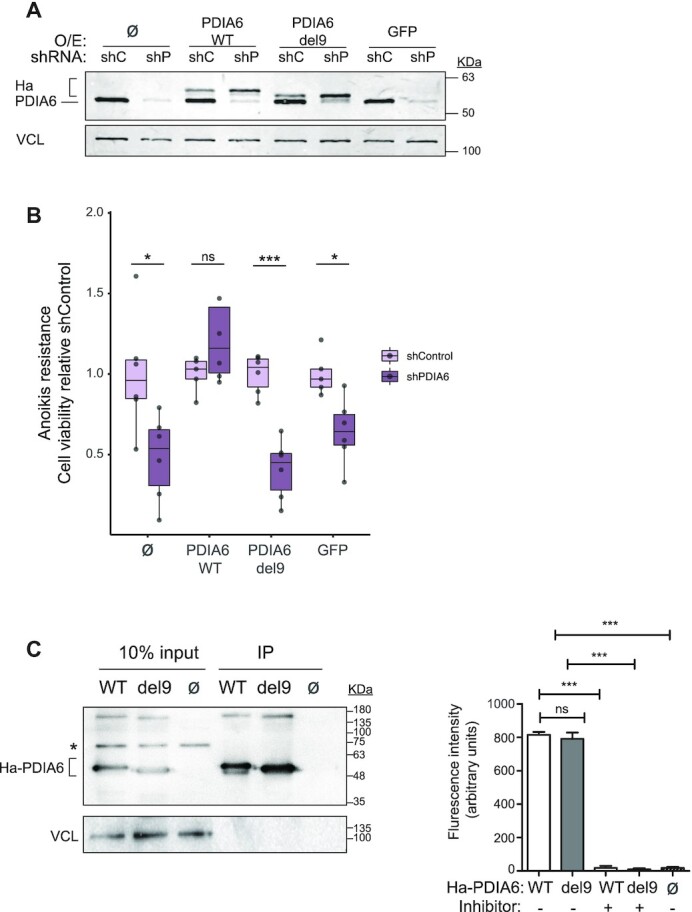
RNA-binding proteins (RBPs) have been relatively overlooked in cancer research despite their contribution to virtually every cancer hallmark. Here, we use RNA interactome capture (RIC) to characterize the melanoma RBPome and uncover novel RBPs involved in melanoma progression. Comparison of RIC profiles of a non-tumoral versus a metastatic cell line revealed prevalent changes in RNA-binding capacities that were not associated with changes in RBP levels. Extensive functional validation of a selected group of 24 RBPs using five different in vitro assays unveiled unanticipated roles of RBPs in melanoma malignancy. As proof-of-principle we focused on PDIA6, an ER-lumen chaperone that displayed a novel RNA-binding activity. We show that PDIA6 is involved in metastatic progression, map its RNA-binding domain, and find that RNA binding is required for PDIA6 tumorigenic properties. These results exemplify how RIC technologies can be harnessed to uncover novel vulnerabilities of cancer cells.


Figures

Figure 1.
Figure 1.
Characterization of the melanoma RBPome. (A) Schematic representation of the RNA interactome capture (RIC) procedure. (B) RBP enrichment assessed by western blot. (C) Number of total and significant (BFDR ≤ 0.05) proteins recovered in RIC eluates. Most significant proteins were also recovered with a BFDR ≤0.01 (dashed line). Significance was calculated using SAINTexpress by comparing crosslinked versus non-crosslinked conditions. The overlap of significant RBPs in both cell lines is shown on the right. (D) Comparison of the melanoma RBPome (excluding histones and ribosomal proteins) with previously published RBPomes. (E) Analysis of RNA binding domains (RBDs) present in the melanoma RBPome. Domain word clouds indicate the frequency of protein domains in the data sets.
Figure 2.
Figure 2.
RIC uncovers novel dependencies of cancer cells. (A) Volcano plot showing differential RBP recovery in RIC eluates of non-tumoral and metastatic cells. Some RBPs are indicated. (B) Scatter plot showing the correlation between changes at the level of RIC and changes at the level of total proteomics for RBPs identified in both cell lines. Proteins with a significant Log2FC (P< 0.05) only in RIC (blue), levels (red) or both (yellow) are highlighted. Pearson correlation and the coefficient of determination are shown in the lower-right corner of the graphs. Some RBPs are indicated. (C) RIC identifies RBP dependencies of metastatic SK-Mel-147 cells. Boxplots show the outcomes of RBP depletions within the decreased binder (green) or increased binder (orange) groups in clonogenicity, anoikis resistance, invasion, 3D growth (spheroid size and ATP) and 2D-growth assays. Each dot represents the averaged results of siRBP normalized to siControl (red line) for one RBP (n = 6–9). Significance between groups was assessed by Student's t-test. (D) Unbiased K-means clustering of results from functional validation. Clustering did not take into account the efficiency of depletion of each RBP. The colored sidebar on the left indicates the original classification of RBPs based on RIC. (E) Comparison of our functional validation with RNAi data for melanoma cells in DepMap. Each dot represents one RBP.
Figure 3.
Figure 3.
PDIA6 promotes melanoma metastasis. (A) Outcomes of PDIA6 depletion from metastatic SK-Mel-147 cells using either siPools or shRNAs. Typical depletion efficiency at the start of cellular assays is indicated at the top. siRNA data for PDIA6 was reproduced from Supplementary Figure S3. Significance was assessed by the Kolmogorov–Smirnov test (2D-growth) or Student's t-test (clonogenicity, anoikis resistance and 3D-growth). Data were normalized to depletion controls. (B) Outcomes of PDIA6 depletion in viability (left) and clonogenicity (right) of UACC-62 and 1205-LU cells. PDIA6 was depleted with shRNAs and the values normalized to shControl. Significance was assessed by Student's t-test (n = 3–4). (C) Effect of PDIA6 depletion on primary tumor growth. PDIA6 was depleted using a doxycycline-inducible shRNA and its levels were assessed at the beginning (western blot, left) and end (RT-qPCR, right) of the experiment. One million cells were injected per mouse flank (n = 10) and tumor volume was monitored until animals had to be sacrificed (bottom). (D) Effect of PDIA6 depletion on metastasis. Mice were injected in the tail vein with 1.5 million metastatic SK-Mel-147 cells labeled with luciferase, either expressing inducible shPDIA6 or shControl, and luciferase signal followed using an IVIS Spectrum. Quantification of the signal is shown at the bottom. The box limits indicate the 25th and 75th quartiles and the upper whisker extends from the minimum to the maximum values. The level of depletion attained before injection is shown at the top. Wilcoxon t-test was used to assess significance (n = 5).
Figure 4.
Figure 4.
PDIA6 is an RNA binding protein. (A) Assessment of RNA-binding by OOPS. Left, schematic representation of the OOPS principle, including the Drosophila spike-in control. Right, western blot showing that PDIA6 is recovered in the OOPS eluate (output) upon UV-crosslinking. Crosslinked Drosophila extracts were added to all samples to estimate sample recovery, as monitored by Western blot against Stubarista (Sta). Vinculin (VCL) was used as negative control. (B) Assessment of RNA-binding by PNK assay. PDIA6 was immunoprecipitated from 2 mg of extract from SK-Mel-147 or Mel-ST cells, and the associated RNA digested and labelled with 32P. The same membrane was first exposed to capture the 32P-RNA signal and then incubated with anti-PDIA6 antibodies for western blot (WB). The asterisk denotes a non-specific band. Quantification of 3 independent experiments is shown on the right. (C) PDIA6 binds RNA in a panel of melanoma cell lines. RNA-binding was assessed by OOPS as in (A). Only crosslinked samples are shown. Quantification of the output signal corrected for input and spike in, and normalized to SK-Mel-147 is shown on the right. Significance was assessed by Student's t-test (n = 3–4).
Figure 5.
Figure 5.
PDIA6 binds RNA through its C-terminal thioredoxin-like fold and disordered region. (A) Domain organization of PDIA6. The signal peptide and the KDEL retention/retrieval signal are indicated. Peptides retrieved from pCLAP and OOPS databases, as well as disordered tracks, are shown. Dashed lines mark the limits of the fragments chosen for RNA binding analysis. TRX, thioredoxin domain. (B) PDIA6 binds RNA via the C-terminal domain. PDIA6 fragments were fused to the C-terminus of GFP, transfected into melanoma SK-Mel-147 cells and tested in PNK assays. Cells expressing GFP alone were used as control. Western blot (top) and 32P signal (bottom) from a representative example are shown. Dashed squares indicate the regions of focus. Quantification of the 32P signal corrected for the amount of immunoprecipitated protein is shown at the bottom. Significance was assessed by Student's t-test (n = 3). (C) Structural model of the C-terminal domain of PDIA6 (I281-L440). Regions 4 and 5 are indicated in orange and regions 8 and 9 in yellow. (D) Scanning mutagenesis of fragment 3. Nine regions (1–9) were serially deleted, as indicated by alternating black and red colors (top). Representative results from PNK assays of UV-irradiated cells (Western blot and 32P signal) are shown. Dashed squares indicate the regions of focus. Quantification of the 32P signal corrected for the amount of immunoprecipitated protein is shown at the bottom. Significance was assessed by Student's t-test (n = 2–3). (E) The C-terminal disordered region of PDIA6 is essential for RNA binding. Regions 8 or 9 were removed from full length, HA-tagged PDIA6 (left) and tested in PNK assays (middle). Quantification of the 32P signal corrected for immunoprecipitated protein is shown (right). Significance was assessed by Student's t-test (n = 3).
Figure 6.
Figure 6.
RNA-binding by PDIA6 mediates its tumorigenic properties. (A) PDIA6 expression. SK-Mel-147 cells expressing shControl (shC) or shPDIA6 (shP) were infected with sh-resistant WT or del9 HA-tagged PDIA6 constructs. Non-infected (Ø) and GFP-infected cells were carried as controls. Endogenous and exogenous (Ha) PDIA6 are indicated. (B) Cells in (A) were tested in anoikis resistance assays. Quantification is shown normalized to shControl. Significance was assessed by Student's t-test (n = 6). (C) Deletion of the C-terminal RNA-binding domain of PDIA6 does not affect its enzymatic activity. HA-PDIA6 was immunoprecipitated from shP/WT and shP/del9 cells, and the thioredoxin activity in the pellet measured. Non-infected cells (shC/ Ø) were used as control. Left, Western blot showing the efficiency of immunoprecipitation. The asterisk denotes a non-specific band. Right, PDI thioredoxin activity assay. The PDI inhibitor bacitracin was used in some reactions as control. Bars represent the average of at least two independent biological replicates with 1–3 technical replicates. Significance was assessed by Student's t-test.

References

    1. Marine J.-.C., Dawson S.-.J., Dawson M.A.. Non-genetic mechanisms of therapeutic resistance in cancer. Nat. Rev. Cancer. 2020; 20:743–756. - PubMed
    1. Salgia R., Kulkarni P.. The genetic/non-genetic duality of drug ‘resistance’ in cancer. Trends Cancer. 2018; 4:110–118. - PMC - PubMed
    1. Flavahan W.A., Gaskell E., Bernstein B.E.. Epigenetic plasticity and the hallmarks of cancer. Science. 2017; 357:eaal2380. - PMC - PubMed
    1. Pereira B., Billaud M., Almeida R.. RNA-Binding proteins in cancer: old players and new actors. Trends Cancer. 2017; 3:506–528. - PubMed
    1. Mino T., Takeuchi O.. Post-transcriptional regulation of immune responses by RNA binding proteins. Proc. Jpn. Acad. Ser. B Phys. Biol. Sci. 2018; 94:248–258. - PMC - PubMed

Publication types

MeSH terms