

Eye Tracking Metrics Differences among Uninjured Adolescents and Those with Acute or Persistent Post-Concussion Symptoms
- PMID: 35848958
- PMCID: PMC9361745
- DOI: 10.1097/OPX.0000000000001921
Eye Tracking Metrics Differences among Uninjured Adolescents and Those with Acute or Persistent Post-Concussion Symptoms
Abstract
Significance: Eye tracking assessments that include pupil metrics can supplement current clinical assessments of vision and autonomic dysfunction in concussed adolescents.
Purpose: This study aimed to explore the utility of a 220-second eye tracking assessment in distinguishing eye position, saccadic movement, and pupillary dynamics among uninjured adolescents, those with acute post-concussion symptoms (≤28 days since concussion), or those with persistent post-concussion symptoms (>28 days since concussion).
Methods: Two hundred fifty-six eye tracking metrics across a prospective observational cohort of 180 uninjured adolescents recruited from a private suburban high school and 224 concussed adolescents, with acute or persistent symptoms, recruited from a tertiary care subspecialty concussion care program, 13 to 17 years old, from August 2017 to June 2021 were compared. Kruskal-Wallis tests were used, and Bonferroni corrections were applied to account for multiple comparisons and constructed receiver operating characteristic curves. Principal components analysis and regression models were applied to determine whether eye tracking metrics can augment clinical and demographic information in differentiating uninjured controls from concussed adolescents.
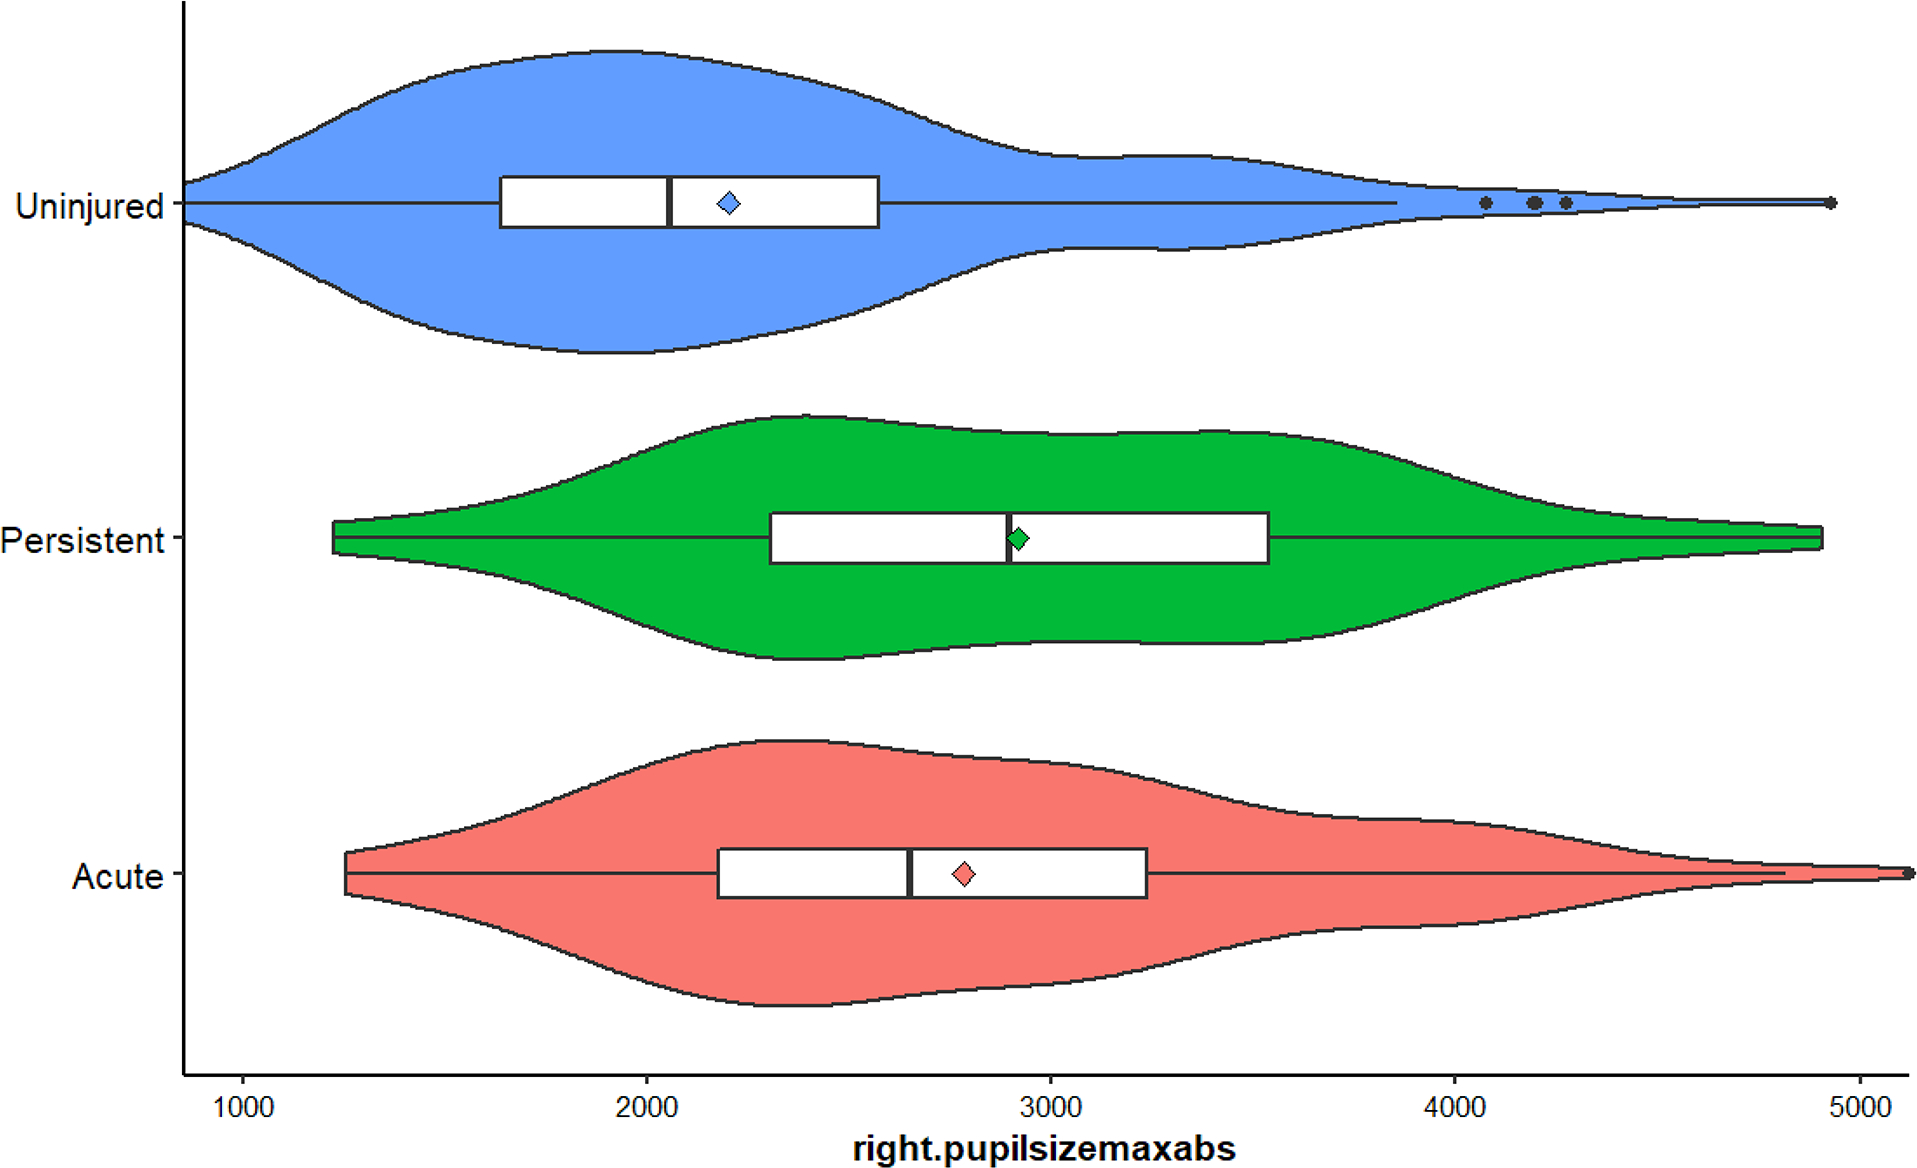
Results: Two metrics of eye position were worse in those with concussion than uninjured adolescents, and only one metric was significantly different between acute cases and persistent cases. Concussed adolescents had larger left and right mean, median, minimum, and maximum pupil size than uninjured controls. Concussed adolescents had greater differences in mean, median, and variance of left and right pupil size. Twelve metrics distinguished female concussed participants from uninjured; only four were associated with concussion status in males. A logistic regression model including clinical and demographics data and transformed eye tracking metrics performed better in predicting concussion status than clinical and demographics data alone.
Conclusions: Objective eye tracking technology is capable of quickly identifying vision and pupillary disturbances after concussion, augmenting traditional clinical concussion assessments. These metrics may add to existing clinical practice for monitoring recovery in a heterogeneous adolescent concussion population.
Copyright © 2022 American Academy of Optometry.
Conflict of interest statement
Conflict of Interest Disclosure: None of the authors have reported a financial conflict of interest.
Figures


References
-
- Bryan MA, Rowhani-Rahbar A, Comstock RD, et al. Sports-and Recreation-Related Concussions in US Youth. Pediatrics 2016;138. - PubMed
-
- Centers for Disease Control and Prevention (CDC). | HEADS UP | Returning to Sports and Activities; 2015.Available at https://www.cdc.gov/headsup/basics/return_to_sports.html. Accessed July 4, 2022.
-
- Ransom DM, Vaughan CG, Pratson L, et al. Academic Effects of Concussion in Children and Adolescents. Pediatrics 2015;135:1043–50. - PubMed
-
- McCrory P, Meeuwisse W, Dvořák J, et al. Consensus Statement on Concussion in Sport—the 5th International Conference on Concussion in Sport Held in Berlin, October 2016. Br J Sports Med 2017;51:838–47. - PubMed
-
- Master CL, Scheiman M, Gallaway M, et al. Vision Diagnoses Are Common after Concussion in Adolescents. Clin Pediatr (Phila) 2016;55:260–7. - PubMed
Publication types
MeSH terms
Grants and funding
LinkOut - more resources
Full Text Sources
Medical
