Clinical Trial
. 2022 Sep 30;77(10):2718-2728.
doi: 10.1093/jac/dkac225.

Population pharmacokinetics of apramycin from first-in-human plasma and urine data to support prediction of efficacious dose

Affiliations
Clinical Trial

Population pharmacokinetics of apramycin from first-in-human plasma and urine data to support prediction of efficacious dose

Chenyan Zhao et al. J Antimicrob Chemother. .

Abstract

Background: Apramycin is under development for human use as EBL-1003, a crystalline free base of apramycin, in face of increasing incidence of multidrug-resistant bacteria. Both toxicity and cross-resistance, commonly seen for other aminoglycosides, appear relatively low owing to its distinct chemical structure.

Objectives: To perform a population pharmacokinetic (PPK) analysis and predict an efficacious dose based on data from a first-in-human Phase I trial.

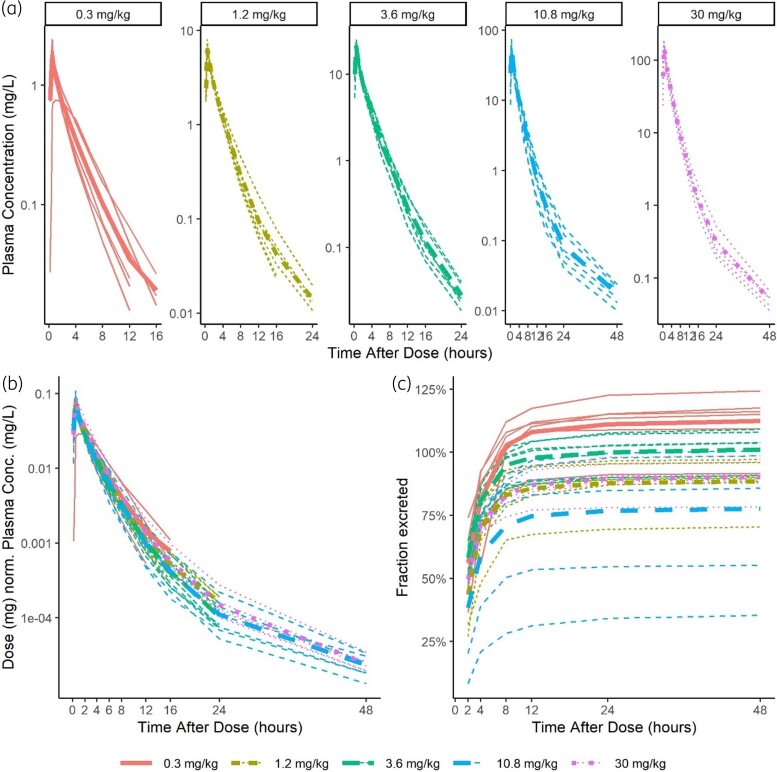
Methods: The drug was administered intravenously over 30 min in five ascending-dose groups ranging from 0.3 to 30 mg/kg. Plasma and urine samples were collected from 30 healthy volunteers. PPK model development was performed stepwise and the final model was used for PTA analysis.

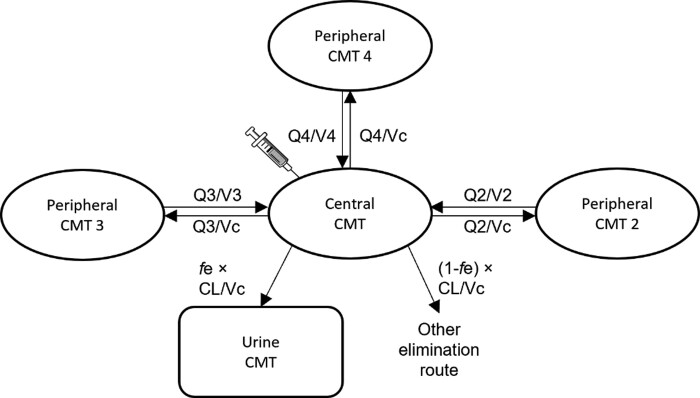
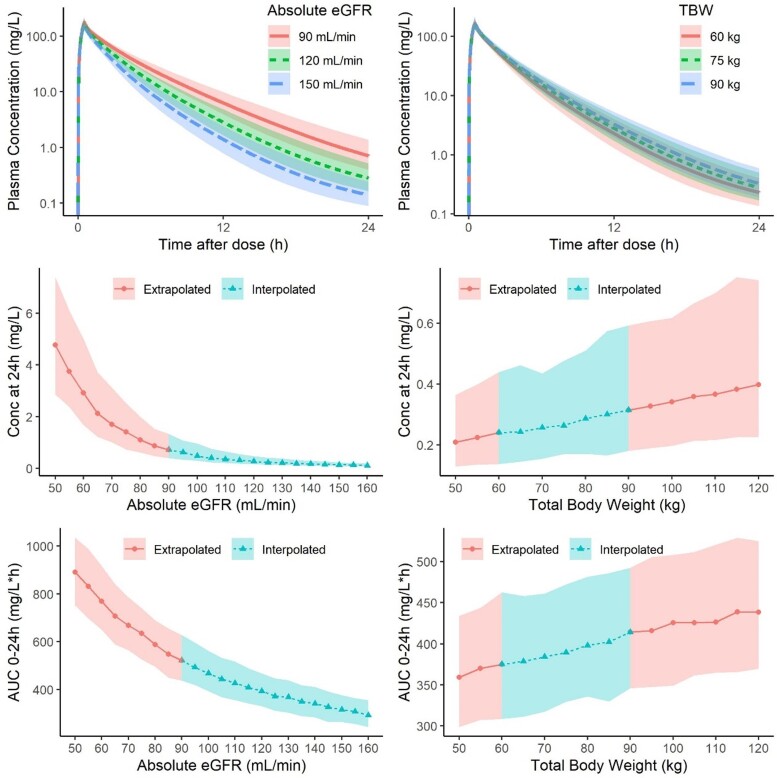
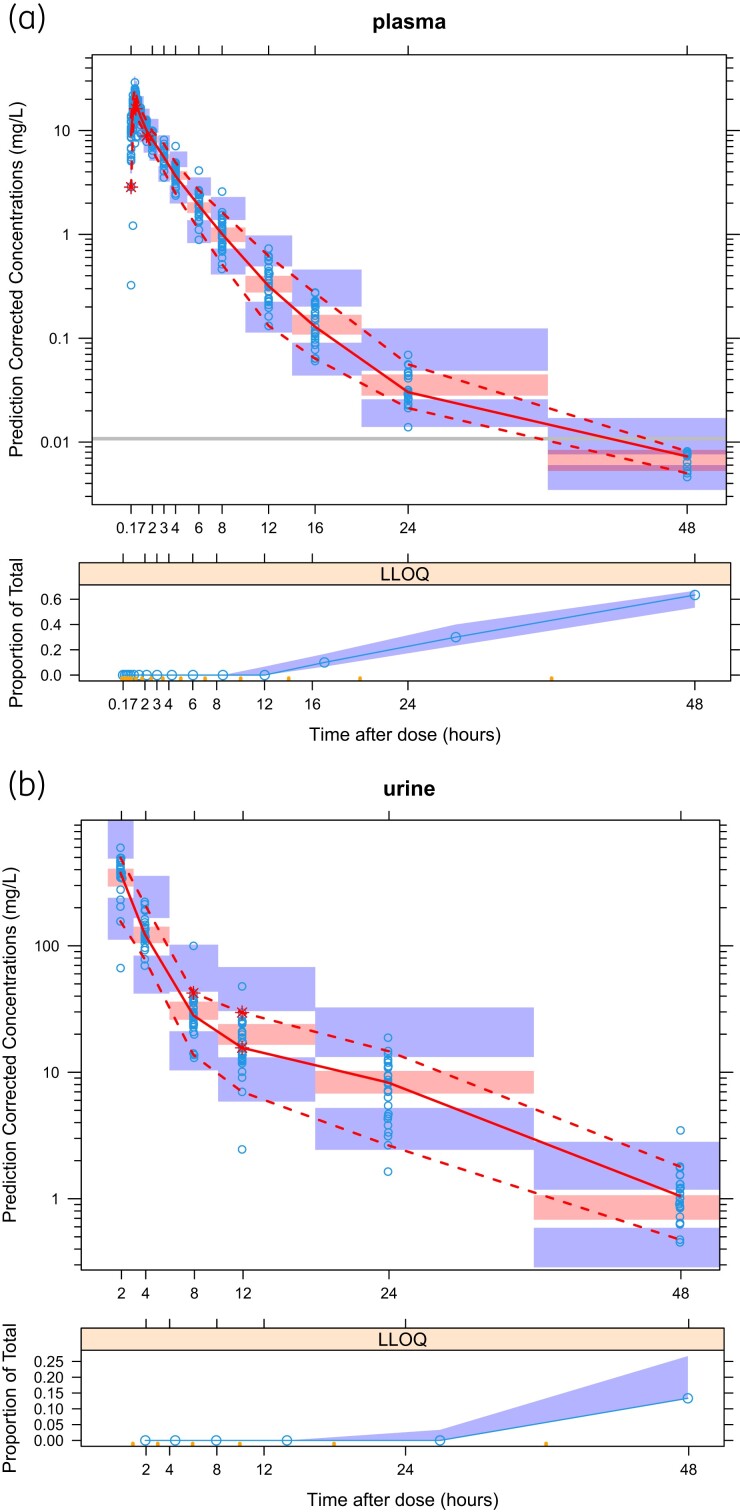
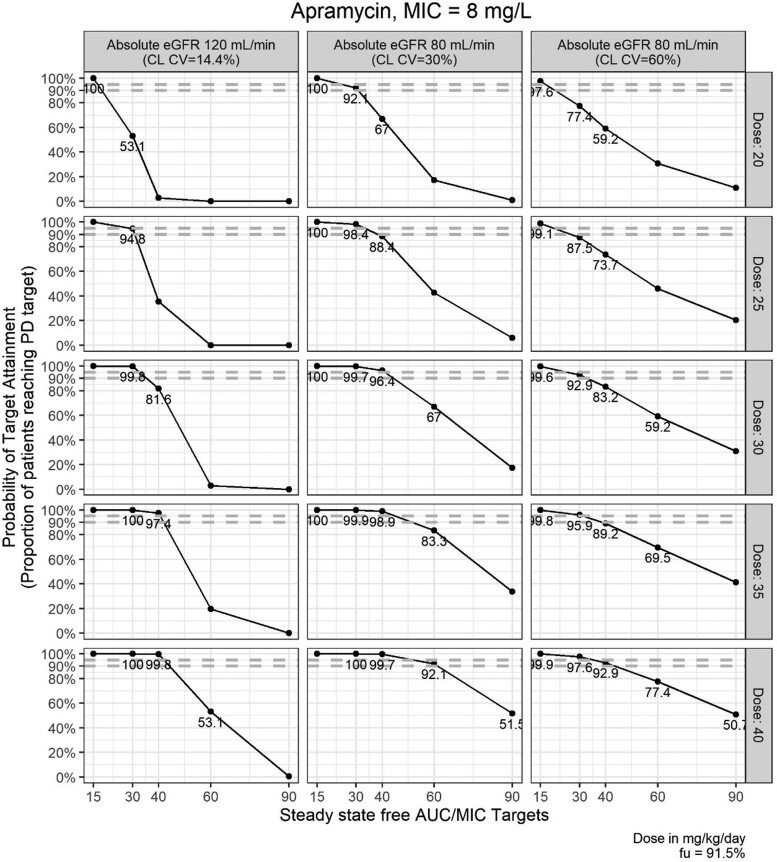
Results: A mammillary four-compartment PPK model, with linear elimination and a renal fractional excretion of 90%, described the data. Apramycin clearance was proportional to the absolute estimated glomerular filtration rate (eGFR). All fixed effect parameters were allometrically scaled to total body weight (TBW). Clearance and steady-state volume of distribution were estimated to 5.5 L/h and 16 L, respectively, for a typical individual with absolute eGFR of 124 mL/min and TBW of 70 kg. PTA analyses demonstrated that the anticipated efficacious dose (30 mg/kg daily, 30 min intravenous infusion) reaches a probability of 96.4% for a free AUC/MIC target of 40, given an MIC of 8 mg/L, in a virtual Phase II patient population with an absolute eGFR extrapolated to 80 mL/min.

Conclusions: The results support further Phase II clinical trials with apramycin at an anticipated efficacious dose of 30 mg/kg once daily.


Figures

Figure 1.
Figure 1.
Apramycin (a) plasma concentrations stratified by dose cohort, (b) dose-normalized plasma concentrations and (c) accumulated fraction of administered drug amount excreted in urine over time profiles, coloured by respective dose cohort. Individual profiles are shown as thinner lines; group means are shown as thicker lines. Data below the limit of quantification are excluded or set to half of the limit in calculations for plasma or urine data, respectively.
Figure 2.
Figure 2.
Schematic illustration of the developed apramycin population pharmacokinetic model. The central compartment (cmt), where drug is administered and plasma concentrations are observed, is connected reversibly to three parallel peripheral compartments (cmt 2–4). A large fraction of apramycin (fe %) is renally eliminated to the urine cmt while the rest is through other routes. Urine collections are from urine cmt. CL and Vc are clearance and volume of the central cmt, respectively. Q2, Q3, and Q4 are intercompartmental clearances between central cmt and cmt 2, 3, and 4, respectively. V2, V3, and V4 are volumes of cmt 2, 3, and 4, respectively.
Figure 3.
Figure 3.
Relationships of the change in absolute eGFR (left column, absolute eGFR range 50–160 mL/min, increments of 5, when TBW set to 75 kg) and TBW (right column, WT range 50–120 kg, increments of 5, when absolute eGFR set to 120 mL/min) versus the change in concentration–time profiles (first row), concentration at 24 h after dose (second row) and AUC in the first 24 h after dose (third row), following a dose of 30 mg/kg administered intravenously over 30 min. The solid line is the median and the corresponding-coloured area is 80% prediction interval, based on 500 simulated individuals in each scenario. The colours and shapes indicate whether the range of covariate values were interpolated from the observed range in the first-in-human study, or extrapolated.
Figure 4.
Figure 4.
Prediction corrected visual predictive check (pcVPC) of the final population pharmacokinetic model developed from combined plasma and urine data for (a) plasma and (b) urine concentrations. In each subplot, the upper panel shows the fit of the observations above the limit of quantification (LOQ) with LOQ indicated by the grey line; observations are displayed as blue dots; red lines are the observed 5th, 50th, and 95th percentiles, blue and red fields are the corresponding 95% CI defined by simulations from the model. Red stars highlight where the observed percentile is outside the 95% CI. The lower panels show the fit of the observed proportion of the data below LOQ. The observed proportions are displayed as blue dots and blue fields are the corresponding 95% CI. For urine, time of observations are the end of the collection interval. A zoom-in plot providing greater resolution for the first 5 h of panel (a) plasma can be found in Figure S6. This figure appears in colour in the online version of JAC and in black and white in the print version of JAC.
Figure 5.
Figure 5.
Apramycin PTA versus steady-state free AUC/MIC targets for an MIC of 8 mg/L under different daily doses in patients with TBW 75 kg and different renal function, based on 1000 simulated individuals in each scenario. Inter-individual variability (IIV) on clearance (CL) was set to coefficient of variation (CV) 14.4% for the interpolated and 30% or 60% for the extrapolated virtual patient population. Grey dashed lines indicate 90% and 95% PTA for reference. PTAs >50% and <100% are annotated. Individual AUCs were calculated as the ratio of absolute administered dose over model simulated individual CL. Absolute eGFR, estimated glomerular filtration rate (CKD-EPI equation) corrected by body surface area; TBW, total body weight. To note, some of the PTAs in the patient population were predicted to be lower than the corresponding PTAs in the population with normal renal function due to the larger IIV assumed in the former population.

References

    1. Olliver M, Griestop L, Hughes Det al. ENABLE: an engine for European antibacterial drug discovery and development. Nat Rev Drug Discov 2021; 20: 407–8. doi: 10.1038/d41573-021-00074-y - DOI - PubMed
    1. Matt T, Ng CL, Lang Ket al. Dissociation of antibacterial activity and aminoglycoside ototoxicity in the 4-monosubstituted 2-deoxystreptamine apramycin. Proc Natl Acad Sci USA 2012; 109: 10984–9. doi: 10.1073/pnas.1204073109 - DOI - PMC - PubMed
    1. Ishikawa M, García-Mateo N, Čusak Aet al. Lower ototoxicity and absence of hidden hearing loss point to gentamicin C1a and apramycin as promising antibiotics for clinical use. Sci Rep 2019; 9: 2410. doi: 10.1038/s41598-019-38634-3 - DOI - PMC - PubMed
    1. Becker K, Cao S, Nilsson Aet al. Antibacterial activity of apramycin at acidic pH warrants wide therapeutic window in the treatment of complicated urinary tract infections and acute pyelonephritis. EBioMedicine 2021; 73: 103652. doi: 10.1016/j.ebiom.2021.103652 - DOI - PMC - PubMed
    1. Kang AD, Smith KP, Eliopoulos GMet al. In vitro apramycin activity against multidrug-resistant Acinetobacter baumannii and Pseudomonas aeruginosa. Diagn Microbiol Infect Dis 2017; 88: 188–91. doi: 10.1016/j.diagmicrobio.2017.03.006 - DOI - PubMed

Publication types