. 2022 Aug 12;50(14):8080-8092.
doi: 10.1093/nar/gkac615.

Cap-independent translation and a precisely located RNA sequence enable SARS-CoV-2 to control host translation and escape anti-viral response

Affiliations

Cap-independent translation and a precisely located RNA sequence enable SARS-CoV-2 to control host translation and escape anti-viral response

Boris Slobodin et al. Nucleic Acids Res. .

Abstract

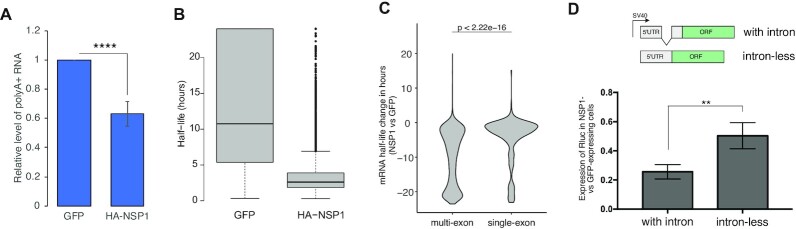
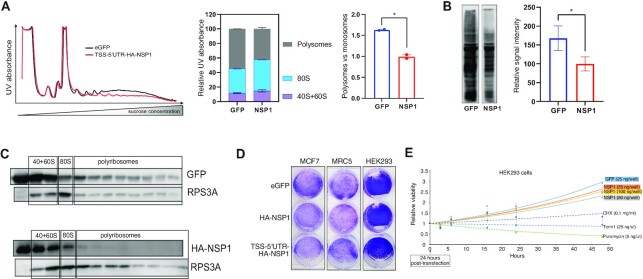
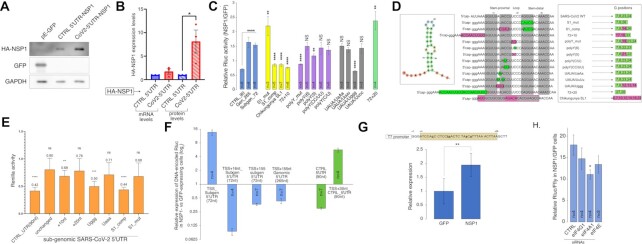
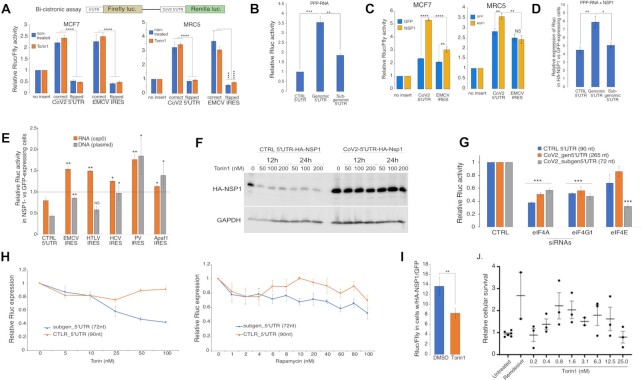
Translation of SARS-CoV-2-encoded mRNAs by the host ribosomes is essential for its propagation. Following infection, the early expressed viral protein NSP1 binds the ribosome, represses translation, and induces mRNA degradation, while the host elicits an anti-viral response. The mechanisms enabling viral mRNAs to escape this multifaceted repression remain obscure. Here we show that expression of NSP1 leads to destabilization of multi-exon cellular mRNAs, while intron-less transcripts, such as viral mRNAs and anti-viral interferon genes, remain relatively stable. We identified a conserved and precisely located cap-proximal RNA element devoid of guanosines that confers resistance to NSP1-mediated translation inhibition. Importantly, the primary sequence rather than the secondary structure is critical for protection. We further show that the genomic 5'UTR of SARS-CoV-2 drives cap-independent translation and promotes expression of NSP1 in an eIF4E-independent and Torin1-resistant manner. Upon expression, NSP1 further enhances cap-independent translation. However, the sub-genomic 5'UTRs are highly sensitive to eIF4E availability, rendering viral propagation partially sensitive to Torin1. We conclude that the combined NSP1-mediated degradation of spliced mRNAs and translation inhibition of single-exon genes, along with the unique features present in the viral 5'UTRs, ensure robust expression of viral mRNAs. These features can be exploited as potential therapeutic targets.


Figures

Figure 1.
Figure 1.
Expression of NSP1 destabilizes host mRNAs. (A) HEK293 cells were transfected with plasmids encoding either eGFP or HA-NSP1 (4 μg DNA per 10-cm dish) and collected after 24 h. Isolated RNA was subjected to poly(A)-dependent enrichment, quantified, and plotted in a relative manner; n = 5, the bar represents SE. (B) Cells transfected as detailed in (A) were treated with Actinomycin D (7.5μg/ml) for 0, 2, 4 and 6 h, harvested and subjected to MARS-seq procedure to determine half-lives of polyadenylated RNAs; n = 2. (C) Changes in half-lives of multi- and single-exon mRNAs upon expression of HA-NSP1; n = 2. (D) HEK293 cells were transfected with plasmids encoding Renilla luciferase (Rluc) reporter genes either with or without intron in the 5′UTR (upper panel) along with plasmids encoding for eGFP or HA-NSP1. After 24 h, the relative expression of both reporters was calculated and plotted; n = 3, bars represent SE.
Figure 2.
Figure 2.
The impact of NSP1 on translation and survival. (A) HEK293 cells were transfected with plasmids encoding HA-NSP1 or eGFP, as a control. After 24 h, the cells were collected, lysed and subjected to polysomal profiling. The left panel displays continuous UV absorbance of both gradients of one out of two independent experiments. The middle panel shows the signal distribution between the different grouped fractions. The right panel directly compares the polysomal vs. monosomal fractions. In all panels, bars are SD of n = 2. See also Figure S2A for analysis of MCF7 cells. (B) HEK293 cells were transfected with plasmids encoding either eGFP or HA-NSP1. After 24 h, puromycin (10 μg/ml) was added for 5 min, and the cells were collected on ice, lysed and 50 μg of total lysates were resolved on 10% SDS-PAGE and probed with anti-puromycin antibodies. The relative signals obtained from the different lanes were analyzed and plotted on the right panel; n = 4, bars represent SD. See also Figure S2B for the original images and S2C for expression of specific proteins. (C) MCF7 cells were transfected with plasmids encoding either eGFP or HA-NSP1 and after 24 h lysed and subjected to polysomal isolation. The total proteins extracted from the collected polysomal fractions were separated on SDS-PAGE and probed to detect the indicated proteins. (D) MCF7, MRC5 and HEK293 cells were grown in 12-well dishes, transfected with either eGFP or HA-NSP1 (200 ng/well) and allowed to grow for additional 2 days, after which they were fixed and stained. These images are representative parts of Figure S2D. (E) HEK293 cells were seeded in 96-well plates and transfected with the indicated amounts of plasmids encoding for either eGFP or HA-NSP1. Twenty-four hours post-transfection (t = 0), the cells were subjected to proliferation assay at the indicated time points. As controls, cells were treated with known translation inhibitors at the indicated concentrations; n = 3, bars represent SE. See also Figure S2E for a similar analysis of MCF7 and Vero cells.
Figure 3.
Figure 3.
Identification of RNA sequence that protects from NSP1-mediated repression. (A) MRC5 cells were transfected with plasmids encoding for eGFP, control 5′UTR-HA-NSP1 or CoV2-5′UTR-HA-NSP1 with its native 5′UTR immediately following the TSS (which is termed HA-NSP1 in this study). After 24 h, the cells were collected and 50 μg from the extracted total proteins were resolved on 9% SDS-PAGE and probed to detect the indicated proteins. (B) MRC5 cells were transfected with plasmids encoding the control 5′UTR-HA-NSP1 or CoV2-5′UTR-HA-NSP1, as detailed in (A), harvested after 24 h and split into two equal parts. One part was subjected to RNA isolation and subsequent RT-qPCR analysis to determine mRNA levels. The second part of each harvest was dedicated to the resolution of total proteins (50 μg) on SDS-PAGE and detection of the indicated proteins. Relative values of each biological repeat (n = 3) were plotted, the bars represent SE. (C) Impact of NSP1 on the expression of reporter mRNAs. MRC5 cells were transfected with plasmids encoding either eGFP or TSS-5′UTR-HA-NSP1. After 20 h, the indicated mRNA reporters bearing both 5′cap and poly(A) tail were transfected, and the luciferase activity was measured 7 h later. The number of independent biological repeats is indicated for each reporter, the bars indicate SE. P-values indicated for the blue columns refer to the reporter bearing the control 5′UTR (CTRL_90), while for the rest of the columns it refers to the reporter encoding the sub-genomic SARS-CoV2 5′UTR (Subgen_72). (D) Detailed representation of the site-directed mutagenesis. The leftmost panel represents the SL1 element's structure, as folded by ViennaRNA software. The middle panel shows detailed schemes representing the manipulations done on the 5′cap-proximal region of the viral 5′UTR. Changed moieties are squared; green squares imply no change to expression, pink squares imply reduced expression, grey shades mark the nucleotides participating in the stem structures. The rightmost panel shows the positions of guanosine moieties within the corresponding sequences relative to the 5′cap. The green color indicates unperturbed expression, while new locations of the ‘G’ moieties that reduce expression are indicated in pink. (E) In-vitro transcribed Rluc mRNA reporters described in (C) bearing both 5′caps and poly(A) tails were added to rabbit reticulocyte lysates (RRL) pre-incubated with either purified HA-NSP1 or BSA. Rluc activity was tested after 60 min of incubation. The graph shows the relative ability of NSP1 to inhibit the different mRNA reporters; n = 3, bars represent SD. (F) MRC5 cells were co-transfected with i) plasmid encoding the indicated configurations of 5′UTRs fused to the reporter Rluc gene and ii) plasmid encoding for either HA-NSP1 or eGFP. The cells were harvested after 48 h and subjected to the examination of Rluc activity; the number of biological repeats (n) is indicated separately for each combination; bars represent SE. (G) DNA template for in vitro transcription encoding the control plasmid-derived 5′UTR was subjected to site-directed mutagenesis in order to create a guanosine-free region, as depicted on the upper panel. mRNAs transcribed from these templates were capped and transfected into MRC5 cells expressing either HA-NSP1 or eGFP. Luciferase activity was measured 7 h later and plotted in a relative manner; n = 6, bars represent SD. (H) MRC5 cells were transfected with the indicated siRNAs and after 48 h transfected again with plasmids encoding (i) either HA-NSP1 or eGFP, (ii) TSS-subgen_5′UTR-Rluc and, (iii) Firefly (Ffly). After additional 24 h, luminescence was tested and Rluc values were normalized by Ffly signal and compared to cells transfected with the control non-targeting siRNAs for statistical analysis; n = 3 or 4, bars represent SE.
Figure 4.
Figure 4.
The translational features of SARS-CoV-2 5′UTRs. (A) Upper panel: schematic representation of the bi-cistronic assay. MCF7 (left panel) or MRC5 (right panel) cells were transfected with bi-cistronic plasmids encoding for the SARS-CoV-2 genomic 5′UTR or EMCV-derived IRES element as a positive control. Both elements were introduced in their correct or flipped (i.e. anti-sense) configuration as a control for non-specific activity. Cells were grown for 24 h in standard medium (NT) or supplied with Torin1 (25 nM), after which Rluc and Ffly activities were assayed; n = 4, bars represent SE. (B) MRC5 cells were transfected with the indicated uncapped (PPP) in-vitro transcribed mRNAs bearing poly(A) tails. Rluc activity was tested 7 h later and is presented relative to the control plasmid-derived 5′UTR; n = 4, the bars represent SE. (C) MCF7 and MRC5 cells were transfected with i) the indicated bi-cistronic plasmids and ii) plasmid encoding either HA-NSP1 or eGFP. Luminescence was assayed 24 h later, n = 4, the bars represent SD. (D) MRC5 cells were transfected with plasmids encoding either HA-NSP1 or eGFP. After 24 h, uncapped RNAs with poly(A) tails encoding for indicated 5′UTRs and a downstream Rluc gene were transfected and Rluc activity was assayed 7 h later; n = 4, bars represent SE. (E) Grey columns: MRC5 cells were co-transfected with plasmids encoding i) either HA-NSP1 or eGFP and ii) indicated IRES sequences cloned before the Rluc reporter gene. Orange columns: MRC5 cells were transfected with plasmids encoding either HA-NSP1 or eGFP and, after 24 h, with capped mRNAs in vitro transcribed from the indicated IRES-containing plasmids; n = 2, bars represent SD. (F) HEK293 cells were transfected with plasmids encoding HA-NSP1 preceded by either control or viral 5′UTR and grown for 40 h post-transfection, out of which Torin1 was added during the last 12 or 24 h at the indicated concentrations. After harvest, total protein lysates were separated on 9% SDS-PAGE and probed with anti-HA and anti-GAPDH antibodies. (G) MRC5 cells were transfected with the indicated siRNAs, and re-transfected after 65 h with in-vitro transcribed mRNA reporters bearing both 5′caps and poly(A) tails. Rluc activity was tested 7 h after the second transfection and presented relatively to the cells expressing the control siRNA; n = 4, bars represent SE. (H) MRC5 cells were transfected with the indicated in-vitro transcribed mRNA reporters bearing both 5′caps and poly(A) tails. After 2 h, Torin1 (left panel) or Rapamycin (right panel) were added to yield the indicated concentrations and Rluc activity was tested after additional 5 h; n = 3, the bars represent SE. (I) MRC5 cells were transfected with the mix of plasmids encoding (i) either HA-NSP1 or eGFP, (ii) TSS-subgen_5′UTR-Rluc and, (iii) Firefly (Ffly). After 4 h of transfection, the medium was replaced and either DMSO or Torin1 (25 nM) were added. The cells were collected after 24 h, lysed and subjected to luminescence analysis. Rluc values were normalized against Ffly signal, n = 3, the bars represent SE. (J) Vero E6 cells were treated with the indicated final concentrations of Torin1 for 1 h, infected with SARS-CoV-2 at MOI = 0.01–0.015 and incubated for 3 days in the presence of Torin1. Following this time, the relative cytopathic effect of the virus was tested. As a positive control, cells were treated with Remdesivir (0.3 mM), for negative relative control cells were not treated prior to infection; n = 2 or 3, bars indicate SE.

References

    1. Schoggins J.W., Wilson S.J., Panis M., Murphy M.Y., Jones C.T., Bieniasz P., Rice C.M.. A diverse range of gene products are effectors of the type I interferon antiviral response. Nature. 2011; 472:481–485. - PMC - PubMed
    1. Slobodin B., Dikstein R.. So close, no matter how far: multiple paths connecting transcription to mRNA translation in eukaryotes. EMBO Rep. 2020; 21:e50799. - PMC - PubMed
    1. Martin S., Saha B., Riley J.L.. The battle over mTOR: an emerging theatre in host-pathogen immunity. PLoS Pathog. 2012; 8:e1002894. - PMC - PubMed
    1. Yokoyama T., Machida K., Iwasaki W., Shigeta T., Nishimoto M., Takahashi M., Sakamoto A., Yonemochi M., Harada Y., Shigematsu H.et al. .. HCV IRES captures an actively translating 80S ribosome. Mol. Cell. 2019; 74:1205–1214. - PubMed
    1. Mariano G., Farthing R.J., Lale-Farjat S.L.M., Bergeron J.R.C.. Structural characterization of SARS-CoV-2: where we are, and where we need to be. Front. Mol. Biosci. 2020; 7:605236. - PMC - PubMed

Publication types