. 2022 Oct;129(5):1104-1143.
doi: 10.1037/rev0000381. Epub 2022 Jul 18.

As within, so without, as above, so below: Common mechanisms can support between- and within-trial category learning dynamics

Affiliations

As within, so without, as above, so below: Common mechanisms can support between- and within-trial category learning dynamics

Emily R Weichart et al. Psychol Rev. 2022 Oct.

Abstract

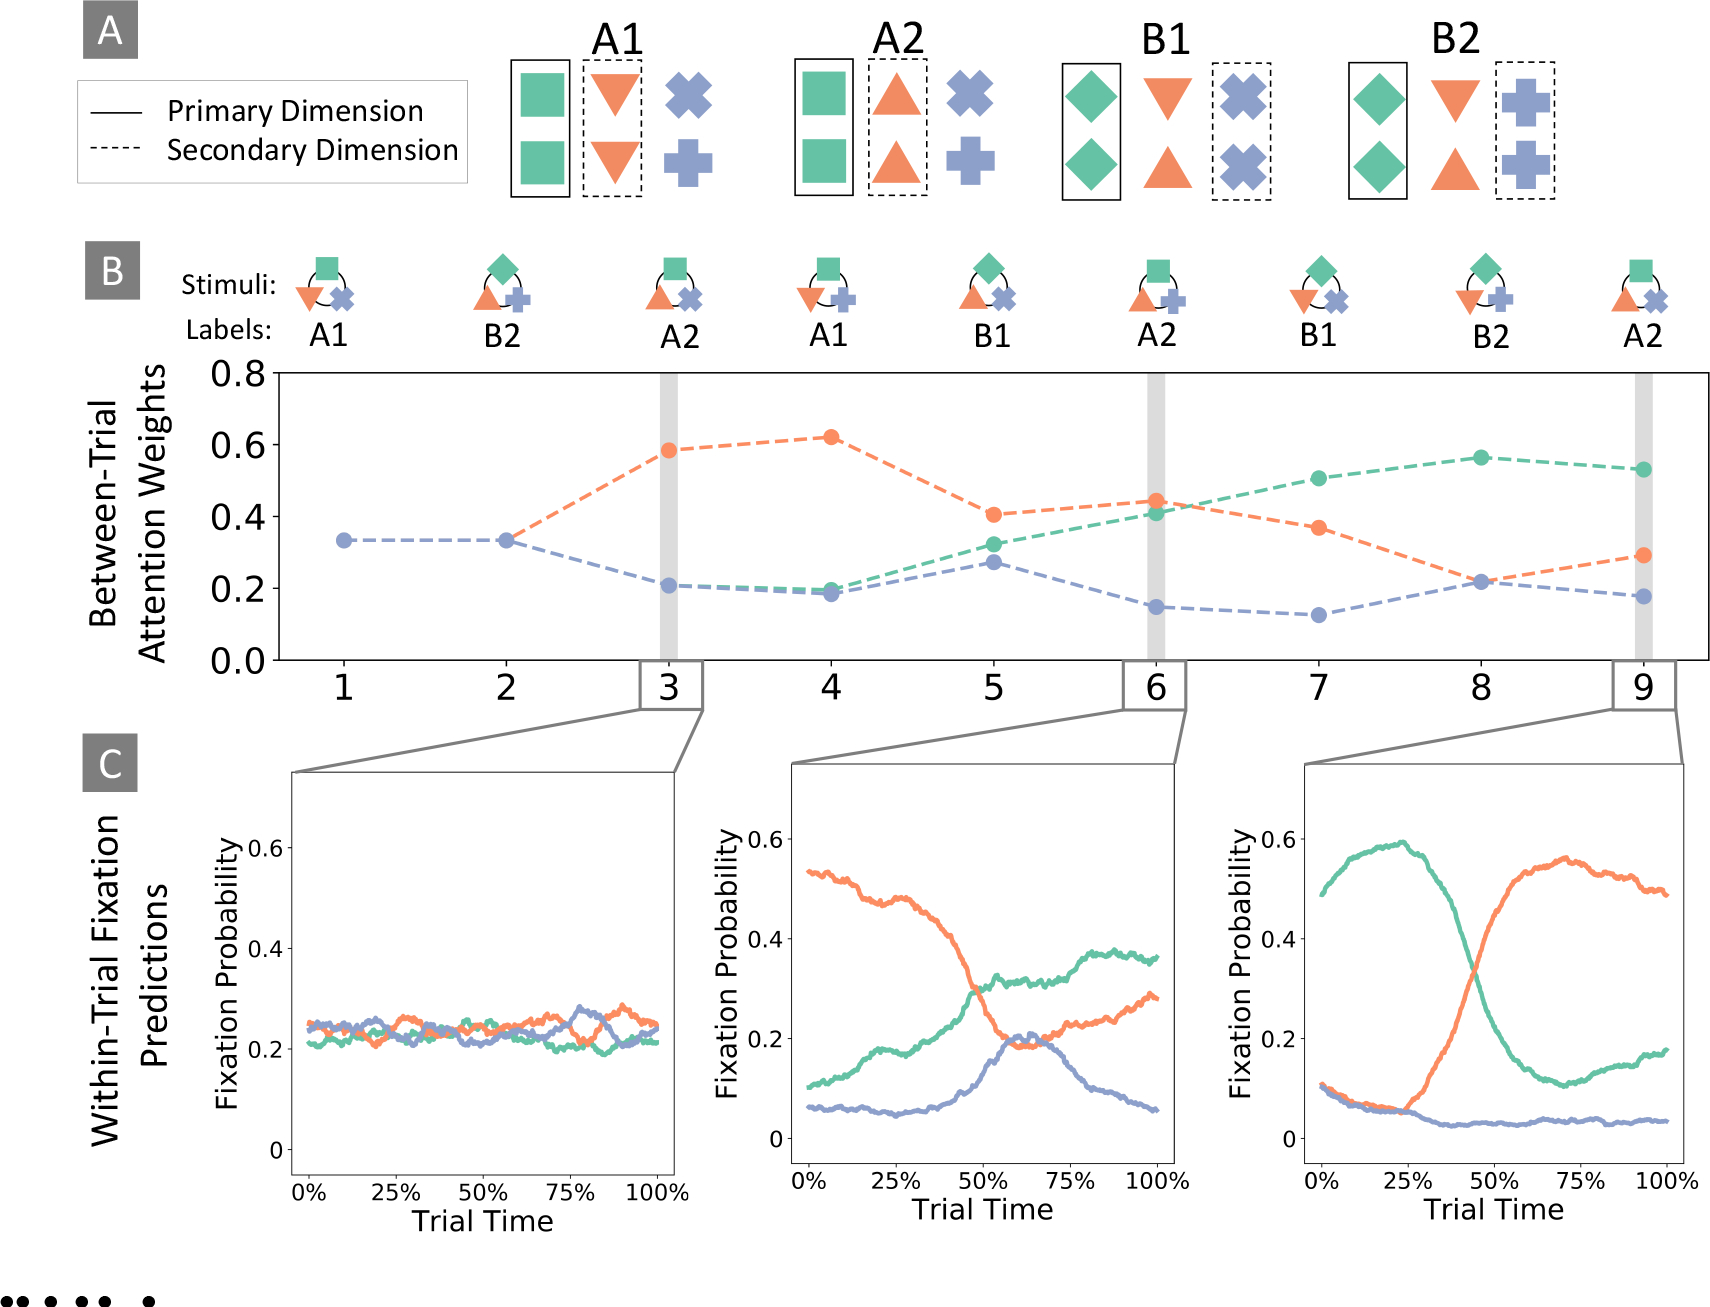
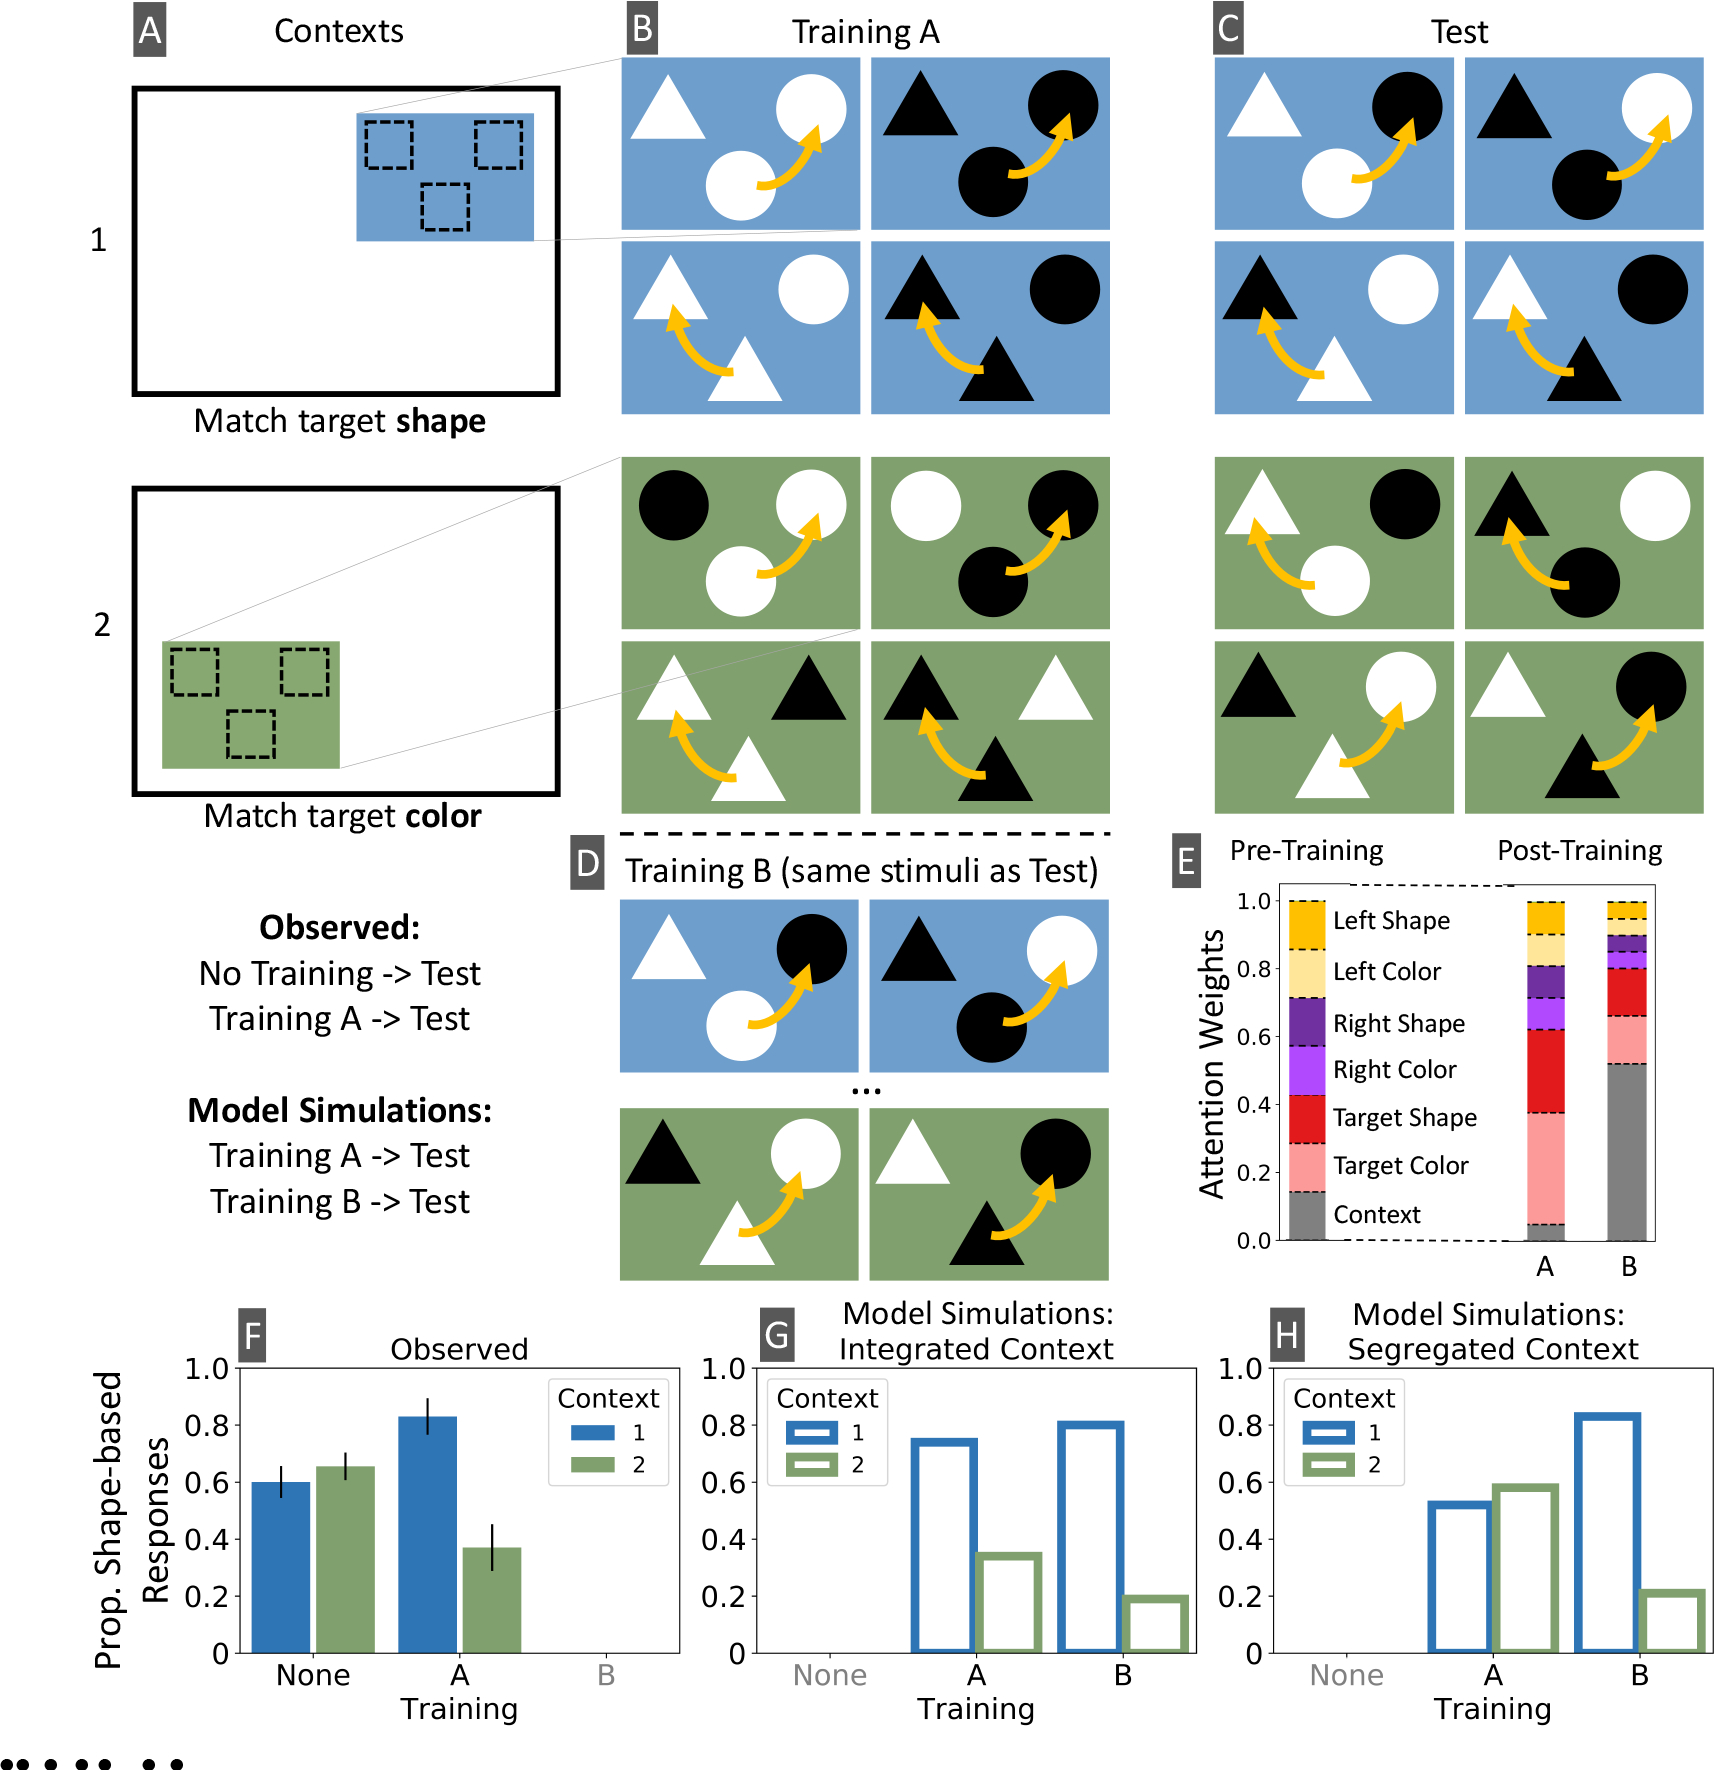
Two fundamental difficulties when learning novel categories are deciding (a) what information is relevant and (b) when to use that information. Although previous theories have specified how observers learn to attend to relevant dimensions over time, those theories have largely remained silent about how attention should be allocated on a within-trial basis, which dimensions of information should be sampled, and how the temporal order of information sampling influences learning. Here, we use the adaptive attention representation model (AARM) to demonstrate that a common set of mechanisms can be used to specify: (a) How the distribution of attention is updated between trials over the course of learning and (b) how attention dynamically shifts among dimensions within a trial. We validate our proposed set of mechanisms by comparing AARM's predictions to observed behavior in four case studies, which collectively encompass different theoretical aspects of selective attention. We use both eye-tracking and choice response data to provide a stringent test of how attention and decision processes dynamically interact during category learning. Specifically, how does attention to selected stimulus dimensions gives rise to decision dynamics, and in turn, how do decision dynamics influence which dimensions are attended to via gaze fixations? (PsycInfo Database Record (c) 2022 APA, all rights reserved).


Figures

Figure 1
Figure 1. Within- and Between-trial Dynamics.
(A) Illustration of a hierarchical stimulus structure. Feature values (i.e.or 45° rotation) in the superordinate dimension (green squares) indicated which of the two subordinate dimensions (orange triangles or purple crosses) were relevant for identifying category membership. (B) Attention weights generated by AARM’s between-trial module, given the sequence of stimuli shown in the top row. Weights were normalized for illustration. Line colors correspond to the colors of the stimulus dimensions. (C) 100 sequences of dimension fixations were generated using the within-trial module. Plots show mean fixation probabilities to each dimension as a function of the percentage of time within-trial, between stimulus onset and self-termination. Within-trial attention weights were initialized according to the outputs of the between-trial module for the relevant stimulus.
Figure 2
Figure 2. Information sampling and decision dynamics
Hypothetical fixation paths were generated by AARM’s within-trial module, such that one of four spatially segregated dimensions was fixated at each timestep up to a response. Left panels show the probabilities of fixating to each dimension (y-axis), plotted as a function of percentage of time within-trial between stimulus onset and response (x-axis). Right panels show the decision evidence for each of two possible category choices as a result of the information sampling behavior (i.e. fixation paths) in corresponding left panels. Choice probability (y-axis) is plotted as a function of absolute time in milliseconds (x-axis). Dotted lines indicate when self-termination (i.e. a response) occurred. Each row shows the timecourses of fixations and decision evidence for: (A) a hypothetical subject who learned to attend to the deterministic (100% predictive of category; D1) dimension; (B) a hypothetical subject who received conflicting evidence across three probabilistic dimensions (D2, D3, and D4). Although each simulation reflects different information sampling behaviors, category A was selected in both examples.
Figure 3
Figure 3. Within- and Between-trial Modules of AARM.
(A) Between-trial updates to the category representation occur via influences of attention and decision components from the previous trial, in the context of feedback. (B) Within-trial updates require dynamic interactions among representation, attention, and decision components. First, the representation guides attention to a relevant dimension (1). Attention drives an encoding process for a fixated feature (2) to then update the amount of evidence (3) for each of a set of category responses. The representation is consulted (4) to guide subsequent attentional deployment.
Figure 4
Figure 4. Illustration of Within-trial Dynamics.
(A) An example stimulus is presented on the screen, and a stimulus dimension is sampled for processing (e.g. prioritized from the between-trial module). (B) The observer generates a working representation of the stimulus and predicts what features might occur in each dimension. As a feature is attended, predictions are replaced with true feature values. (C) Previously-stored exemplars are activated in proportion to their similarity to the probe. (F) The category labels associated with retrieved exemplars accrue noisy response evidence. (E) Attention updates to discriminate among the currently most active category options. (D) Gaze fixations are determined from the attention process, resulting in reorientation to new dimensions as needed to sample more category-relevant information.
Figure 5
Figure 5. Illustration of Attention Gradient.
(A) Heatmaps show the activation of each unique exemplar in the task paradigm shown in Figure 1. Y-axis labels show trial numbers and the feedback associated with each exemplar. Activation at 4 different time points within an individual trial are shown, given a probe with a true category label of A2. (B) The plot shows the progression of within-trial attention weights assigned to dimensions D1 and D2, which are the relevant dimensions for determining the category membership of the given stimulus. As time progresses (as indicated by black arrows), the attention weights (x- and y-axis values) move in a direction to support a category response (contour values).
Figure 6
Figure 6. Paradigm and Stimuli used in Case Study 1.
(A) Illustration of stimuli, which participants were asked to sort into fictional “Flurp” and “Jalet” species types. Each stimulus contained seven dimensions (antennae, head, button, body, hands, feet, and tail). In Phase 1, one dimension (e.g. feet; outlined by solid box) was deterministic, one was irrelevant (e.g. button; outlined by dashed box), and five were probabilistic (all un-outlined features) in their mappings to category labels. After an undisclosed “switch,” the deterministic dimension from Phase 1 became irrelevant in Phase 2 and the irrelevant dimension became deterministic. (B) Characteristics of stimuli presented at test. Match items were drawn directly from the training set, such that deterministic and probabilistic dimensions carried the same feature-to-category mappings. Conflict items contained novel configurations of features, such that the deterministic and probabilistic dimensions were associated with opposite category mappings. In the table, unique feature values within each dimension are indicated by 0s, 1s and 2s.
Figure 7
Figure 7. Case Study 1A: Conflicting information
(A) Subject-level mean proportions of fixations to the deterministic dimension. (B-D) Left panels show mean proportions of fixations (y-axis) to each of the seven dimensions through time. Right panels show observed means and 95% CIs of proportions of rule-based (i.e. responses consistent with the deterministic feature) responses across match and conflict trials. (E-F) Fixation and response data were generated using AARM’s within-trial module. (H-J) Mean proportions of fixations to the deterministic, probabilistic, and irrelevant dimensions across observed (filled bars) and model-generated (unfilled bars) trials, collapsing across groups. (H) Fixation proportions across match trials. (I) Fixation proportions across conflict trials on which responses were consistent with the deterministic dimension. (J) Fixation proportions across conflict trials on which responses were consistent with the majority of probabilistic dimensions.
Figure 8
Figure 8. Case Study 1B: Shifting Information Relevance.
The final trial of Phase 1 and the first three trials of Phase 2 are of primary interest. In all panels, the vertical black bar represents the “switch” from Phase 1 (left) to Phase 2 (right). (A) Between-trial module-generated attention weights (points) for unique stimulus configurations. (B) 100 sequences of within-trial fixation and decision behaviors were generated by the within-trial module, using the specific sequence of stimulus configurations that each participant experienced. (C) Within-trial probabilities of fixating to each dimension were aggregated across subjects, and plotted as a function of percentage of observed response time. (D-H) Data and simulations for two groups, specified according to the proportion of fixations to D dimensions during the latter 10 trials of Phase 1 test. Group 1 showed a looking preference for D, whereas Group 2 showed a looking preference for P. Probabilities of fixating to the deterministic (D and G), or any of the five probabilistic (E and H) dimensions were averaged across observed (filled bars) and model-generated (unfilled bars) sequences.
Figure 9
Figure 9. Case Study 2: Hierarchical Category Structures.
(A) Observed fixation data from Experiment 2 (1:1 condition) from Meier and Blair (2013) while participants categorized stimuli that belonged to categorized A (left panel) and B (right panel). (B) Within-trial fixation predictions generated by AARM, aggregated across 1000 probes from categories A (left panel) and B (right panel). (C) Means and 95%CIs of dwell times to each stimulus dimension in milliseconds, calculated across category A (left set of bars) and B (right set of bars) trials. Filled bars show observed data and unfilled bars show model predictions.
Figure 10
Figure 10. Case Study 3: Task Cueing.
(A) Illustration of stimuli and category delineations from four sub-tasks of a hypothetical experiment. Points represent Gabor patch stimuli that each take on a frequency value (x-axis) and a rotation angle value (y-axis). Background colors served as an indicator of the categorization rule for each sub-task: frequency distinguished between categories A and B in Context 1 (rule-based), angle distinguished between categories C and D in Context 2 (rule-based), and both frequency and angle were necessary for distinguishing between categories E and F in Context 3, and categories G and H in Context 4 (information integration). (B) Mean encoding probabilities of each dimension (y-axis) plotted as a function of the percentage of time in between stimulus onset and response (x-axis). Solid, dotted, and dashed lines represent context, frequency, and angle dimensions, respectively. (C) Probabilities of making an A-H response (y-axis) plotted as a function of the percentage of time within-trial between stimulus onset and response (x-axis). Each color represents an available category label, as shown in panel A.
Figure 11
Figure 11. Case Study 4: Incidental Context.
Figure adapted with permission from Child Development. (A) Illustration of contexts. (B) Training stimuli. Stimuli were triads of items, and the task was to select one of the two choice options (top two items) that matched the target (bottom item) according to a rule. Yellow arrows indicate a path from the target to the correct choice option. (C) Test stimuli. Note that identical stimulus configurations were shown in Contexts 1 and 2, but yellow arrows indicate that different responses are appropriate according to the context. (D) Hypothetical training stimuli for simulation purposes. (E) Attention weights generated by the between-trial module of AARM before (left bar) and after exposure to each set of training stimuli and their category labels. Each color represents a stimulus dimension, and larger segment heights correspond to larger attention weights. (F) Observed proportions of shape-based responses in each context. (G-H) Model-generated proportions of shape-based responses in each context at test, following Training A and B. The context dimension in our simulations was either considered to be integrated (perceptually overlapping) with the dimensions of the stimulus triad (G) or segregated (separate in space and requiring independent perceptual processing) from the dimensions of the stimulus triad (H).

Similar articles

Cited by

References

    1. Addleman D, Tao J, Remington R, & Jiang Y (2018). Explicit goal-driven attention, unlike implicitly learned attention, spreads to secondary tasks. Journal of Experimental Psychology: Human Perception and Performance, 44(3), 356. - PMC - PubMed
    1. Allport A, Styles E, & Hsieh S (1994). Shifting intentional set: Exploring the dynamic control of tasks. In Umilta C & Moscovitch M (Eds.), Attention and performance xv: Conscious and nonconscious information processing (p. 421–452). Cambridge, MA: MIT Press.
    1. Anderson B, Laurent P, & Yantis S (2011). Value-driven attentional capture. Proceedings of the National Academy of Sciences, 108(25), 10367–10371. - PMC - PubMed
    1. Anderson J (1991a). The adaptive nature of human categorization. Psychological Review, 98, 409–429.
    1. Anderson J (1991b). Is human cognition adaptive? Behavioral & Brain Sciences, 14, 471–484.

Publication types