. 2022 Sep;48(9):913-925.
doi: 10.1037/xhp0001037. Epub 2022 Jul 18.

Phonetic category activation predicts the direction and magnitude of perceptual adaptation to accented speech

Affiliations

Phonetic category activation predicts the direction and magnitude of perceptual adaptation to accented speech

Yunan Charles Wu et al. J Exp Psychol Hum Percept Perform. 2022 Sep.

Abstract

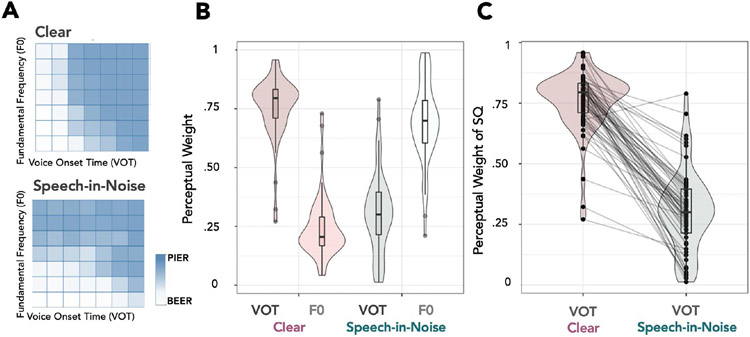
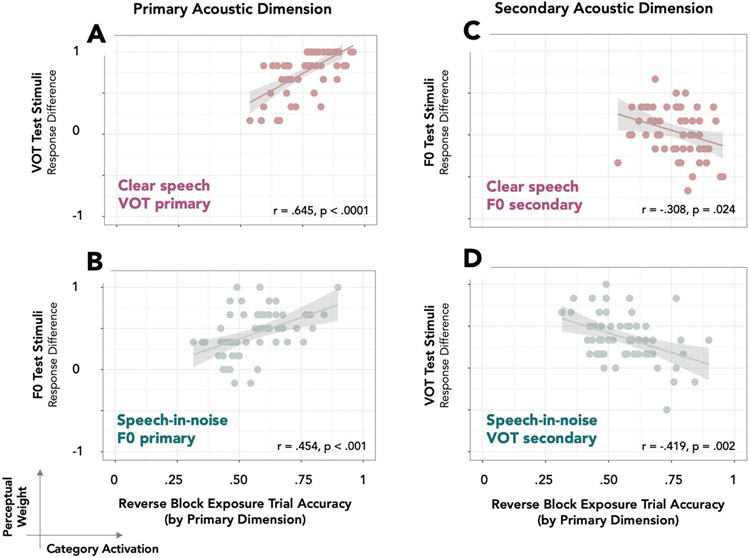
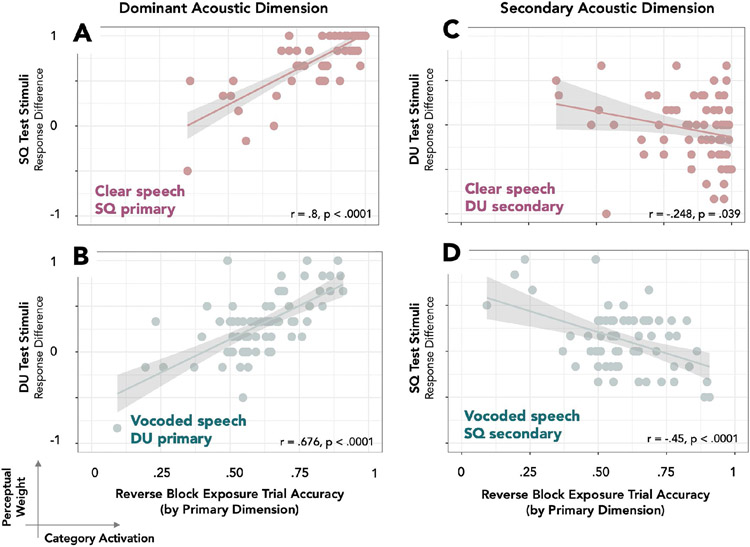
Unfamiliar accents can systematically shift speech acoustics away from community norms and reduce comprehension. Yet, limited exposure improves comprehension. This perceptual adaptation indicates that the mapping from acoustics to speech representations is dynamic, rather than fixed. But, what drives adjustments is debated. Supervised learning accounts posit that activation of an internal speech representation via disambiguating information generates predictions about patterns of speech input typically associated with the representation. When actual input mismatches predictions, the mapping is adjusted. We tested two hypotheses of this account across consonants and vowels as listeners categorized speech conveying an English-like acoustic regularity or an artificial accent. Across conditions, signal manipulations impacted which of two acoustic dimensions best conveyed category identity, and predicted which dimension would exhibit the effects of perceptual adaptation. Moreover, the strength of phonetic category activation, as estimated by categorization responses reliant on the dominant acoustic dimension, predicted the magnitude of adaptation observed across listeners. The results align with predictions of supervised learning accounts, suggesting that perceptual adaptation arises from speech category activation, corresponding predictions about the patterns of acoustic input that align with the category, and adjustments in subsequent speech perception when input mismatches these expectations. (PsycInfo Database Record (c) 2022 APA, all rights reserved).


Figures

Figure 1.
Figure 1.. Experiment 1 and Experiment 2 stimulus distributions.
Across panels, each open circle represents a unique stimulus. The grey highlighted area indicates exposure stimuli sampled for a particular task. The Baseline block samples stimuli equiprobably to estimate baseline perceptual weights. The Canonical block samples stimuli according to a dimension correlation that aligns with English whereas the Reverse block presents the opposite correlation as an ‘accent.’ The large colored circles indicate test stimuli, which are present across blocks and provide a measure of the perceptual weight of a single dimension as the other dimension is held constant and perceptually ambiguous. A. Voice onset time (VOT) and fundamental frequency (F0) vary across beer-pier stimuli in Experiment 1. B. Spectral quality (SQ) and duration (DU) vary across set-sat stimuli in Experiment 2.
Figure 2.
Figure 2.. Experiment 1 baseline perceptual weights.
A. Heat maps of beer-pier consonant categorization across the voice onset time (VOT) and fundamental frequency (F0) acoustic input dimensions for clear speech (top) and speech-in-noise (bottom). Darker blue indicates more pier responses and lighter blue indicates more beer responses. B. The data from (A) are summarized as violin and box plots of average normalized perceptual weights for VOT and F0 across clear speech and speech-in-noise. C. The same data are plotted as violin and box plots for VOT perceptual weights to illustrate that almost all listeners (99.4%) relied less on VOT in noise than in clear speech.
Figure 3.
Figure 3.. The direction and magnitude of perceptual adaptation are predicted by the dominant acoustic dimension, Experiment 1.
The top two panels (red, A and C) present data from clear speech. The bottom panels (blue, B and D) present the same participants’ responses to speech-in-noise. Each plot shows the relationship of category activation, defined as the accuracy of exposure trial categorization in the Reverse block defined according to the primary dimension estimated at baseline on the x-axis. The y-axis plots corresponding perceptual weights for the primary (A and B) or secondary acoustic dimension (C and D). [FDR-corrected statistics]
Figure 4.
Figure 4.. Experiment 2 baseline perceptual weights.
A. Heat maps of vowel categorization across the spectral quality (SQ) and duration (DU) acoustic input dimensions for clear speech (top) and vocoded speech (bottom). Darker blue indicates more sat responses and lighter blue indicates more set responses. B. The data from (A), presented as violin and box plots for average normalized perceptual weights across SQ and DU and for clear speech and vocoded speech. C. The data from (A), plotted as violin and box plots for SQ weights only illustrate that almost all listeners (98.57%) relied less on SQ in vocoded speech compared to clear speech.
Figure 5.
Figure 5.. The direction and magnitude of perceptual adaptation are predicted by the dominant acoustic dimension, Experiment 2.
The top two panels (red, A and C) present data from clear speech. The bottom panels (blue, B and D) present data from the same participants’ responses to vocoded speech. Each plot illustrates the relationship of category activation, defined as the accuracy of exposure trial categorization in the Reverse block defined according to the primary dimension estimated at baseline on the x-axis. The y-axis plots corresponding perceptual weights for the primary (A and B) or secondary acoustic dimension (C and D). [Statistics FDR-corrected.]

Similar articles

Cited by

References

    1. Abramson A, & Lisker L (1985). Relative power of cues: F0 shift versus voice timing. In: Fromkin V, editor. Phonetic linguistics: Essays in honor of Peter Ladefoged. New York, NY: Academic; 1985. pp. 25–33.
    1. Anwyl-Irvine AL, Massonnié J, Flitton A, Kirkham N, & Evershed JK (2020). Gorilla in our midst: An online behavioral experiment builder. Behavior Research Methods, 52(1), 388–407. 10.3758/s13428-019-01237-x - DOI - PMC - PubMed
    1. Bertelson P, Vroomen J, & Gelder B (2003). Visual recalibration of auditory speech identification: a McGurk aftereffect. Psychological Science, 14(6), 592–597. 10.1046/j.0956-7976.2003.psci_1470.x - DOI - PubMed
    1. Boersma P (2006). Praat: doing phonetics by computer.
    1. Bradlow AR, & Bent T (2008). Perceptual adaptation to non-native speech. Cognition, 106(2), 707–729. 10.1016/j.cognition.2007.04.005 - DOI - PMC - PubMed