

Causal factors affecting gross motor function in children diagnosed with cerebral palsy
- PMID: 35849563
- PMCID: PMC9292109
- DOI: 10.1371/journal.pone.0270121
Causal factors affecting gross motor function in children diagnosed with cerebral palsy
Abstract
Background: Cerebral palsy (CP) is a complex neuromuscular condition that may negatively influence gross motor function. Children diagnosed with CP often exhibit spasticity, weakness, reduced motor control, contracture, and bony malalignment. Despite many previous association studies, the causal impact of these impairments on motor function is unknown.
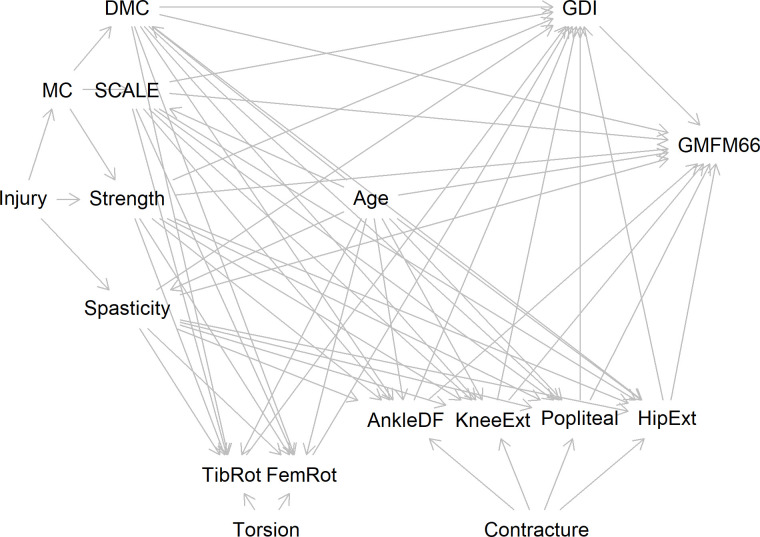
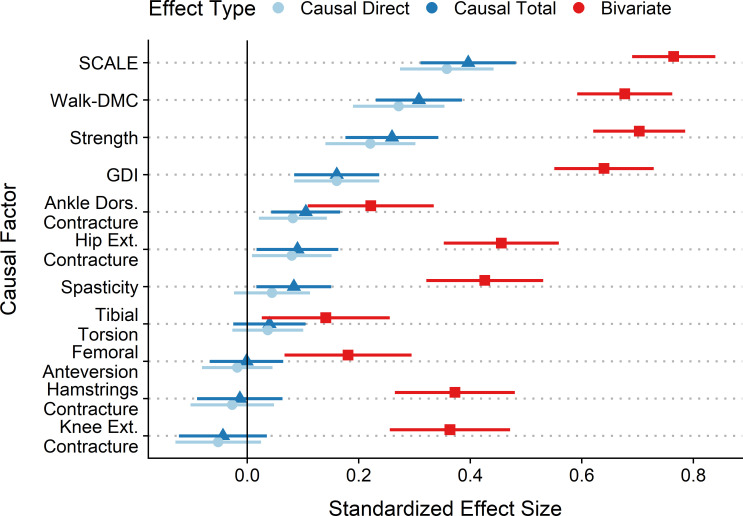
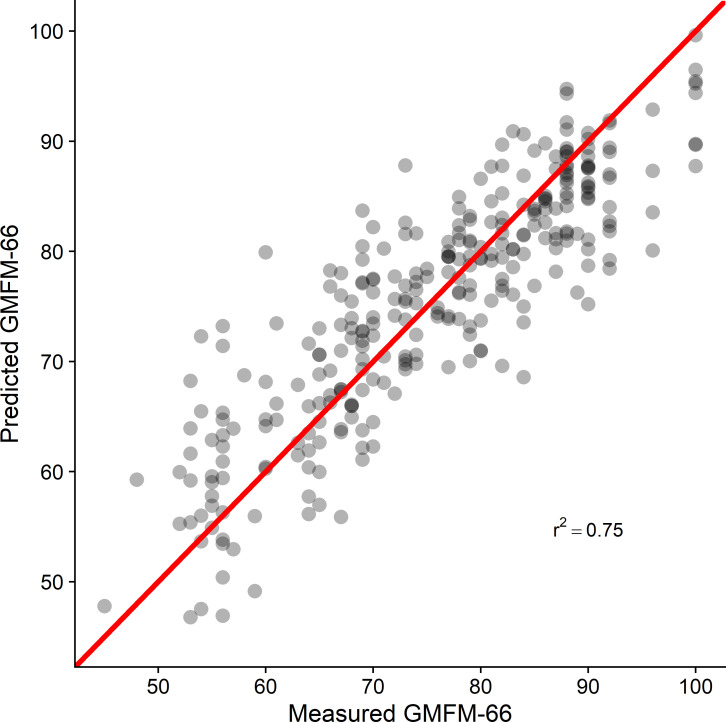
Aim: In this study, we proposed a causal model which estimated the effects of common impairments on motor function in children with spastic CP as measured by the 66-item Gross Motor Function Measure (GMFM-66). We estimated both direct and total effect sizes of all included variables using linear regression based on covariate adjustment sets implied by the minimally sufficient adjustment sets. In addition, we estimated bivariate effect sizes of all measures for comparison.
Method: We retrospectively evaluated 300 consecutive subjects with spastic cerebral palsy who underwent routine clinical gait analysis. Model data included standard information collected during this analysis.
Results: The largest causal effect sizes, as measured by standardized regression coefficients, were found for selective voluntary motor control and dynamic motor control, followed by strength, then gait deviations. In contrast, common treatment targets, such as spasticity and orthopedic deformity, had relatively small effects. Effect sizes estimated from bivariate models, which cannot appropriately adjust for other causal factors, substantially overestimated the total effect of spasticity, strength, and orthopedic deformity.
Interpretation: Understanding the effects of impairments on gross motor function will allow clinicians to direct treatments at those impairments with the greatest potential to influence gross motor function and provide realistic expectations of the anticipated changes.
Conflict of interest statement
The authors have declared that no competing interests exist.
Figures
Similar articles
-
Relationships between spasticity, strength, gait, and the GMFM-66 in persons with spastic diplegia cerebral palsy.Arch Phys Med Rehabil. 2007 Sep;88(9):1114-20. doi: 10.1016/j.apmr.2007.06.011. Arch Phys Med Rehabil. 2007. PMID: 17826455
-
Path analysis of strength, spasticity, gross motor function, and health-related quality of life in children with spastic cerebral palsy.Health Qual Life Outcomes. 2018 Apr 19;16(1):70. doi: 10.1186/s12955-018-0891-1. Health Qual Life Outcomes. 2018. PMID: 29673348 Free PMC article.
-
The relationship between spasticity and gross motor capability in nonambulatory children with spastic cerebral palsy.Int J Rehabil Res. 2013 Sep;36(3):205-10. doi: 10.1097/MRR.0b013e32835d0b11. Int J Rehabil Res. 2013. PMID: 23282668
-
The efficacy of GMFM-88 and GMFM-66 to detect changes in gross motor function in children with cerebral palsy (CP): a literature review.Disabil Rehabil. 2014;36(8):617-27. doi: 10.3109/09638288.2013.805820. Epub 2013 Jun 26. Disabil Rehabil. 2014. PMID: 23802141 Review.
-
Effect of ankle-foot orthoses on gait, balance and gross motor function in children with cerebral palsy: a systematic review and meta-analysis.Clin Rehabil. 2018 Sep;32(9):1175-1188. doi: 10.1177/0269215518771824. Epub 2018 May 1. Clin Rehabil. 2018. PMID: 29714066
Cited by
-
Effectiveness of Game-Based Training of Selective Voluntary Motor Control in Children With Upper Motor Neuron Lesions: Randomized Multiple Baseline Design Study.JMIR Form Res. 2024 Nov 18;8:e47754. doi: 10.2196/47754. JMIR Form Res. 2024. PMID: 39556826 Free PMC article. Clinical Trial.
-
Selective Motor Control is a Clinical Correlate of Brain Motor Tract Impairment in Children with Spastic Bilateral Cerebral Palsy.AJNR Am J Neuroradiol. 2021 Nov;42(11):2054-2061. doi: 10.3174/ajnr.A7272. Epub 2021 Sep 30. AJNR Am J Neuroradiol. 2021. PMID: 34593378 Free PMC article.
-
Changes in Lower Extremity Passive Range of Motion and Muscle Strength After Selective Percutaneous Myofascial Lengthening and Functional Physiotherapy in Children With Cerebral Palsy.Cureus. 2024 Aug 20;16(8):e67325. doi: 10.7759/cureus.67325. eCollection 2024 Aug. Cureus. 2024. PMID: 39301341 Free PMC article.
-
Causal modelling demonstrates metabolic power is largely affected by gait kinematics and motor control in children with cerebral palsy.PLoS One. 2023 May 24;18(5):e0285667. doi: 10.1371/journal.pone.0285667. eCollection 2023. PLoS One. 2023. PMID: 37224117 Free PMC article.
-
Causal Effects of Motor Control on Gait Kinematics After Orthopedic Surgery in Cerebral Palsy: A Machine-Learning Approach.Front Hum Neurosci. 2022 Jun 3;16:846205. doi: 10.3389/fnhum.2022.846205. eCollection 2022. Front Hum Neurosci. 2022. PMID: 35721346 Free PMC article.
References
-
- Lee B-H. Relationship between gross motor function and the function, activity and participation components of the International Classification of Functioning in children with spastic cerebral palsy. Journal of Physical Therapy Science. 2017;29: 1732–1736. doi: 10.1589/jpts.29.1732 - DOI - PMC - PubMed
MeSH terms
LinkOut - more resources
Full Text Sources
Medical
Miscellaneous
