. 2022 Jul 18;17(7):e0271279.
doi: 10.1371/journal.pone.0271279. eCollection 2022.

A groupwise registration and tractography framework for cardiac myofiber architecture description by diffusion MRI: An application to the ventricular junctions

Affiliations

A groupwise registration and tractography framework for cardiac myofiber architecture description by diffusion MRI: An application to the ventricular junctions

Julie Magat et al. PLoS One. .

Abstract

Background: Knowledge of the normal myocardial-myocyte orientation could theoretically allow the definition of relevant quantitative biomarkers in clinical routine to diagnose heart pathologies. A whole heart diffusion tensor template representative of the global myofiber organization over species is therefore crucial for comparisons across populations. In this study, we developed a groupwise registration and tractography framework to resolve the global myofiber arrangement of large mammalian sheep hearts. To demonstrate the potential application of the proposed method, a novel description of sub-regions in the intraventricular septum is presented.

Methods: Three explanted sheep (ovine) hearts (size ~12×8×6 cm3, heart weight ~ 150 g) were perfused with contrast agent and fixative and imaged in a 9.4T magnet. A group-wise registration of high-resolution anatomical and diffusion-weighted images were performed to generate anatomical and diffusion tensor templates. Diffusion tensor metrics (eigenvalues, eigenvectors, fractional anisotropy …) were computed to provide a quantitative and spatially-resolved analysis of cardiac microstructure. Then tractography was performed using deterministic and probabilistic algorithms and used for different purposes: i) Visualization of myofiber architecture, ii) Segmentation of sub-area depicting the same fiber organization, iii) Seeding and Tract Editing. Finally, dissection was performed to confirm the existence of macroscopic structures identified in the diffusion tensor template.

Results: The template creation takes advantage of high-resolution anatomical and diffusion-weighted images obtained at an isotropic resolution of 150 μm and 600 μm respectively, covering ventricles and atria and providing information on the normal myocardial architecture. The diffusion metric distributions from the template were found close to the one of the individual samples validating the registration procedure. Small new sub-regions exhibiting spatially sharp variations in fiber orientation close to the junctions of the septum and ventricles were identified. Each substructure was defined and represented using streamlines. The existence of a fiber-bundles in the posterior junction was validated by anatomical dissection. A complex structural organization of the anterior junction in comparison to the posterior junction was evidenced by the high-resolution acquisition.

Conclusions: A new framework combining cardiac template generation and tractography was applied on the whole sheep heart. The framework can be used for anatomical investigation, characterization of microstructure and visualization of myofiber orientation across samples. Finally, a novel description of the ventricular junction in large mammalian sheep hearts was proposed.


Conflict of interest statement

The authors have declared that no competing interests exist.

Figures

Fig 1
Fig 1. Block diagram of the processing steps.
A) Anatomical and DW images were first handled separately with a B1 inhomogeneity field correction. Then, anatomical images were manually aligned along the long axis using ITK-snap while diffusion tensor calculations were performed before any registration. Secondly, DW images were registered to the anatomical images. Model generation was performed using the symmetric normalization transformation (SyN) model using the anatomical and FA images. B) The individual diffusion tensors were then deformed into the template space and an average diffusion tensor was created. After this step, the diffusion tensors and maps and streamlines are spatially normalized and available individually or jointly (averaged). Manual steps are indicated (*), all other steps are fully automatic, reproducible and executed using shell scripts.
Fig 2
Fig 2. Impact of the transformation model during the registration on anatomical and FA template.
Sagittal coronal and transverse view of anatomical (left) and FA (right) template using Rigid (top row), Affine (middle Row), SyN (bottom row). Mis-registration areas using Rigid or Affine transform are visible in the basal part of the sample, at the apex or on the papillary muscle.
Fig 3
Fig 3. Impact of the transformation model during the registration on the anatomical template in five different regions.
Zoom-view in the IVS (A), near the division of the His bundle in left and right bundles (B), in the RV wall (C), in the posterior papillary muscle of the LV (D) and on the anterior leaflet of the tricuspid valve (TV) (E and F) using Rigid (top row), Affine (middle Row), SyN (bottom row) transformation models, The misregistration areas visible using Rigid and Affine transformation are less pronounced using SyN for the large or small structures like the conduction system (yellow arrow) or the leaflets of the valve (orange arrows).
Fig 4
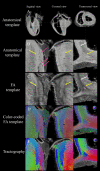
Fig 4. Visualization of the posterior RVIP in the basal area using anatomical, FA and diffusion tensor templates in sagittal, coronal and transverse view.
(A) Large view and (B) zoom-view of the anatomical template on the posterior RVIP in the basal area. Myocardium with different gray levels and epicardial fat are visible. (C) FA template. Lower fractional anisotropy value is noticeable. (D) cFA maps overlaid on anatomical data. Smooth transition of fiber orientation is visible (gradient of green to purple) in the endocardial part of the LV while fiber orientation changes abruptly between adjacent voxels in the IVS and in the middle of the RVIP (yellow arrow) depicting a triangular shape in the coronal view. (E) streamlines with the color-coding of the cFA maps (D). Note the presence of a channel or fascicles of streamlines going from the RV to the IVS (in green).
Fig 5
Fig 5. Streamlines of the posterior singularity with different tracking techniques on template and individual diffusion tensors.
For each representation, the anatomical template is inserted for reference. Top) Streamlines were computed using a masking region of interest and the FACT algorithm on the primary eigenvector of the average tensor in template space and displayed in coronal (A) and sagittal view (B). Down) A different tracking technique is shown. Few seeds were manually defined, then streamlines were generated for sample #1 (C), #2 (D), #3 (E) using the Tensor_Det algorithm on each individual tensor in native space and warped into template space without ROI restriction.
Fig 6
Fig 6. Macroscopic structural organization of the posterior junction.
A) Anatomical Transversal images of sheep heart #2 of the posterior junction close to the base-ventricular level. B) Photography of the dissected heart #4. Corresponding view using anatomical images from sample #2 after rigid registration. C) Overlay of A) over B). D) Another transversal view of the posterior junction. A coronal cut was performed on a line (yellow line) ranging from the RV cavities to the LV posterior wall going through the suspected region. E to I) Visualization of the structural organization is presented by slightly rotating the sample while the surgical light highlights the macroscopic structural organization. J) Tractography in short axis view taken from sample #2 in a selected slice in the basal area K) Tractography in a long-axis view corresponding to the plane drawn by the yellow line. L) Another picture was taken in a long-axis view. Original photos are available to the reviewers.
Fig 7
Fig 7. Tractography of the anterior junction.
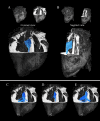
A) and B) zoom-view of the cFA maps of sample #1 in the anterior junction in the basal area in transversal and sagittal orientation, respectively. Three regions of interest are identified: a fascicle of streamlines coming from the IVS splits into two branches going on one side to the wall of the pulmonary artery (purple arrow) and, on the other side to the wall of the aorta (yellow arrow). The third fascicle of streamlines, located in the LV, goes from the aorta to the papillary muscles (pink arrow). C & D) 3D rendered images of the anatomical template with the superimposed mesh of the PA (white) and the AO (gray) Note that the volume was flipped and this orientation was kept for all following representations. E, F, G, H) For each region, seeds were manually defined, then streamlines were computed using the template diffusion tensor without ROI restriction.
Fig 8
Fig 8. Tractography of the junction obtained with a seeding performed in the mid-ventricular area.
Left windows: four cylindrical ROIs: R1 (red), R2 (yellow), R3 (light yellow), R4 (white) were manually defined at the RVIP in the basal area of the anterior (top) and posterior (down) junction. Three arbitrary pathways: A (from ROI R1 to R2) B (from ROI R1 to R2 to R3) C (from ROI R1 to R2 to R4) were also defined as input for computing the streamlines. ROIs and pathways were overlaid on anatomical template images. The other windows correspond to the resulting streamlines in 3D view for each pathway. Anterior (Top) Streamlines split into two output tracts. The fascicle of streamlines going to the IVS leaves the image plane and goes to the wall of the pulmonary artery as described in Fig 6. Pathway (B) and (C) were found connecting. Posterior (Down) Streamlines split into two output tracks located in the IVS, in the free wall (A) but do not cross the posterior singularity. Pathways (B) and (C) were found connecting.

Similar articles

Cited by

References

    1. Hooks DA, Trew ML, Caldwell BJ, Sands GB, LeGrice IJ, Smaill BH. Laminar arrangement of ventricular myocytes influences electrical behavior of the heart. Circ Res. 2007;101(10):e103–12. doi: 10.1161/CIRCRESAHA.107.161075 . - DOI - PubMed
    1. Buckberg G, Hoffman JI, Mahajan A, Saleh S, Coghlan C. Cardiac mechanics revisited: the relationship of cardiac architecture to ventricular function. Circulation. 2008;118(24):2571–87. doi: 10.1161/CIRCULATIONAHA.107.754424 . - DOI - PubMed
    1. Hasaballa AI, Wang VY, Sands GB, Wilson AJ, Young AA, LeGrice IJ, et al.. Microstructurally Motivated Constitutive Modeling of Heart Failure Mechanics. Biophys J. 2019;117(12):2273–86. doi: 10.1016/j.bpj.2019.09.038 ; PubMed Central PMCID: PMC6990375. - DOI - PMC - PubMed
    1. Mann DL, Bristow MR. Mechanisms and models in heart failure: the biomechanical model and beyond. Circulation. 2005;111(21):2837–49. doi: 10.1161/CIRCULATIONAHA.104.500546 . - DOI - PubMed
    1. Allessie MA, de Groot NM, Houben RP, Schotten U, Boersma E, Smeets JL, et al.. Electropathological substrate of long-standing persistent atrial fibrillation in patients with structural heart disease: longitudinal dissociation. Circ Arrhythm Electrophysiol. 2010;3(6):606–15. doi: 10.1161/CIRCEP.109.910125 . - DOI - PubMed

Publication types