

Geospatial modeling of pre-intervention nodule prevalence of Onchocerca volvulus in Ethiopia as an aid to onchocerciasis elimination
- PMID: 35849615
- PMCID: PMC9333447
- DOI: 10.1371/journal.pntd.0010620
Geospatial modeling of pre-intervention nodule prevalence of Onchocerca volvulus in Ethiopia as an aid to onchocerciasis elimination
Abstract
Background: Onchocerciasis is a neglected tropical filarial disease transmitted by the bites of blackflies, causing blindness and severe skin lesions. The change in focus for onchocerciasis management from control to elimination requires thorough mapping of pre-control endemicity to identify areas requiring interventions and to monitor progress. Onchocerca volvulus nodule prevalence in sub-Saharan Africa is spatially continuous and heterogeneous, and highly endemic areas may contribute to transmission in areas of low endemicity or vice-versa. Ethiopia is one such onchocerciasis-endemic country with heterogeneous O. volvulus nodule prevalence, and many districts are still unmapped despite their potential for onchocerciasis transmission.
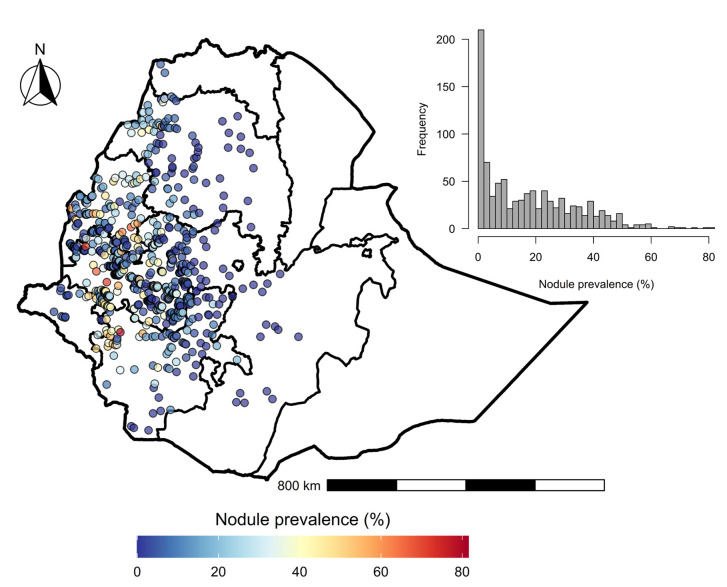
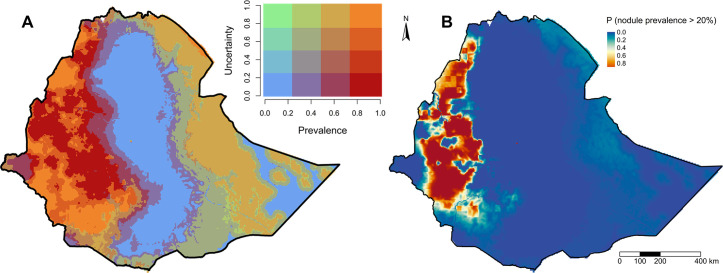
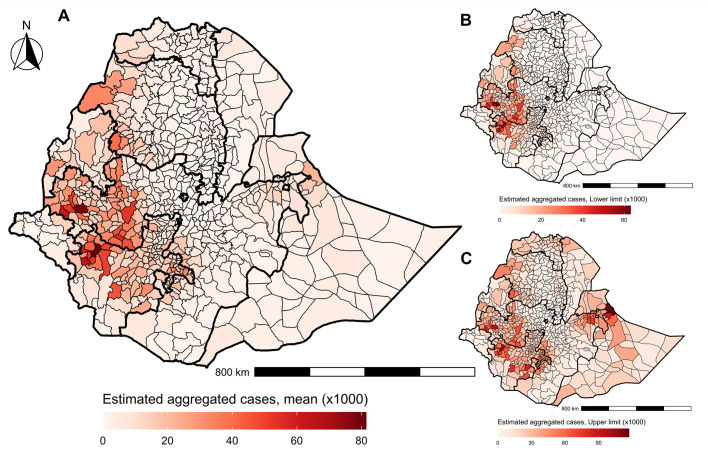
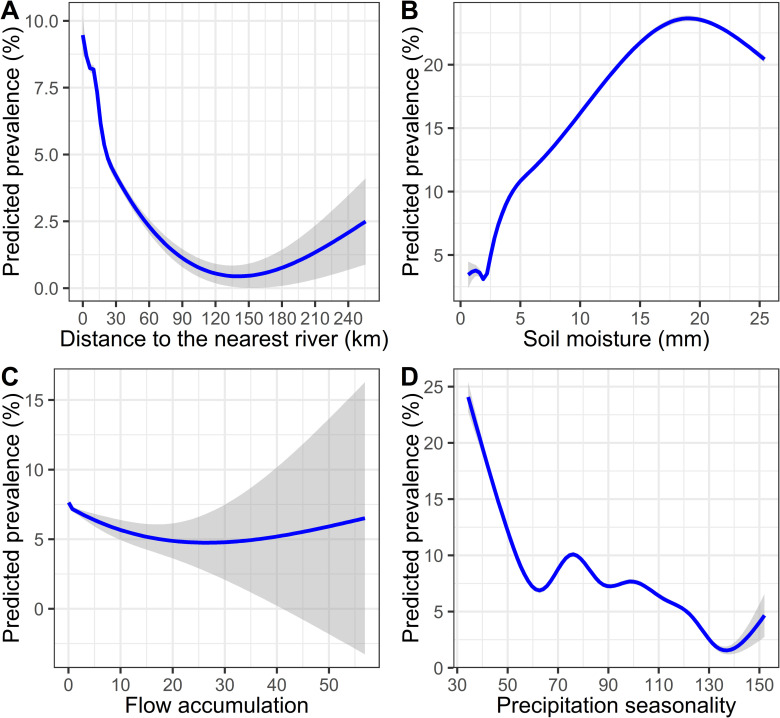
Methodology/principle findings: A Bayesian geostatistical model was fitted for retrospective pre-intervention nodule prevalence data collected from 916 unique sites and 35,077 people across Ethiopia. We used multiple environmental, socio-demographic, and climate variables to estimate the pre-intervention prevalence of O. volvulus nodules across Ethiopia and to explore their relationship with prevalence. Prevalence was high in southern and northwestern Ethiopia and low in Ethiopia's central and eastern parts. Distance to the nearest river (RR: 0.9850, 95% BCI: 0.9751-0.995), precipitation seasonality (RR: 0.9837, 95% BCI: 0.9681-0.9995), and flow accumulation (RR: 0.9586, 95% BCI: 0.9321-0.9816) were negatively associated with O. volvulus nodule prevalence, while soil moisture (RR: 1.0218, 95% BCI: 1.0135-1.0302) was positively associated. The model estimated the number of pre-intervention cases of O. volvulus nodules in Ethiopia to be around 6.48 million (95% BCI: 3.53-13.04 million).
Conclusions/significance: Nodule prevalence distribution was correlated with habitat suitability for vector breeding and associated biting behavior. The modeled pre-intervention prevalence can be used as a guide for determining priorities for elimination mapping in regions of Ethiopia that are currently unmapped, most of which have comparatively low infection prevalence.
Conflict of interest statement
The authors have declared that no competing interests exist.
Figures

Similar articles
-
Model-Based Geostatistical Mapping of the Prevalence of Onchocerca volvulus in Cameroon between 1971 and 2020.PLoS Negl Trop Dis. 2025 Mar 28;19(3):e0012250. doi: 10.1371/journal.pntd.0012250. eCollection 2025 Mar. PLoS Negl Trop Dis. 2025. PMID: 40153441 Free PMC article.
-
Onchocerca volvulus-specific antibody and cellular responses in onchocerciasis patients treated annually with ivermectin for 30 years and exposed to parasite transmission in central Togo.PLoS Negl Trop Dis. 2022 May 3;16(5):e0010340. doi: 10.1371/journal.pntd.0010340. eCollection 2022 May. PLoS Negl Trop Dis. 2022. PMID: 35503786 Free PMC article.
-
A community-based cross-sectional study of the epidemiology of onchocerciasis in unmapped villages for community directed treatment with ivermectin in Jimma Zone, southwestern Ethiopia.BMC Public Health. 2015 Jul 1;15:595. doi: 10.1186/s12889-015-1888-x. BMC Public Health. 2015. PMID: 26130117 Free PMC article.
-
Advancing a Human Onchocerciasis Vaccine From Antigen Discovery to Efficacy Studies Against Natural Infection of Cattle With Onchocerca ochengi.Front Cell Infect Microbiol. 2022 Apr 4;12:869039. doi: 10.3389/fcimb.2022.869039. eCollection 2022. Front Cell Infect Microbiol. 2022. PMID: 35444961 Free PMC article. Review.
-
Neurological manifestations in Onchocerca volvulus infection: A review.Brain Res Bull. 2019 Feb;145:39-44. doi: 10.1016/j.brainresbull.2018.08.024. Epub 2018 Nov 17. Brain Res Bull. 2019. PMID: 30458251 Free PMC article. Review.
Cited by
-
Geospatial distribution and predictive modeling of onchocerciasis in Ogun State, Nigeria.PLoS One. 2023 Mar 1;18(3):e0281624. doi: 10.1371/journal.pone.0281624. eCollection 2023. PLoS One. 2023. PMID: 36857325 Free PMC article.
-
Impact of Environmental Factors on the Distribution Patterns of Nephropathia Epidemica Cases in Western Europe.Environ Health Perspect. 2025 May;133(5):57023. doi: 10.1289/EHP15457. Epub 2025 May 27. Environ Health Perspect. 2025. PMID: 40261974 Free PMC article.
-
Model-Based Geostatistical Mapping of the Prevalence of Onchocerca volvulus in Cameroon between 1971 and 2020.PLoS Negl Trop Dis. 2025 Mar 28;19(3):e0012250. doi: 10.1371/journal.pntd.0012250. eCollection 2025 Mar. PLoS Negl Trop Dis. 2025. PMID: 40153441 Free PMC article.
References
-
- Diggle P, Ribeiro PJ. Model-based geostatistics. New York, NY: Springer; 2007.
-
- Moraga P. Geospatial health data: modeling and visualization with R-INLA and Shiny. Boca Raton: CRC Press; 2020.
-
- Diggle P. Model-based geostatistics for global public health: methods and applications. Boca Raton: Taylor & Francis; 2019.
Publication types
MeSH terms
Substances
LinkOut - more resources
Full Text Sources
