. 2023 Jan 10;7(1):60-72.
doi: 10.1182/bloodadvances.2021006870.

Membrane curvature and PS localize coagulation proteins to filopodia and retraction fibers of endothelial cells

Affiliations

Membrane curvature and PS localize coagulation proteins to filopodia and retraction fibers of endothelial cells

Christopher V Carman et al. Blood Adv. .

Abstract

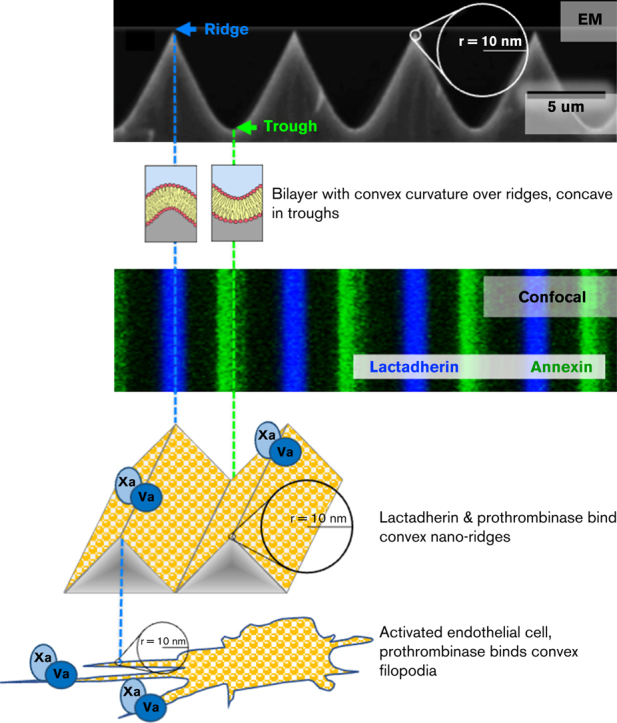
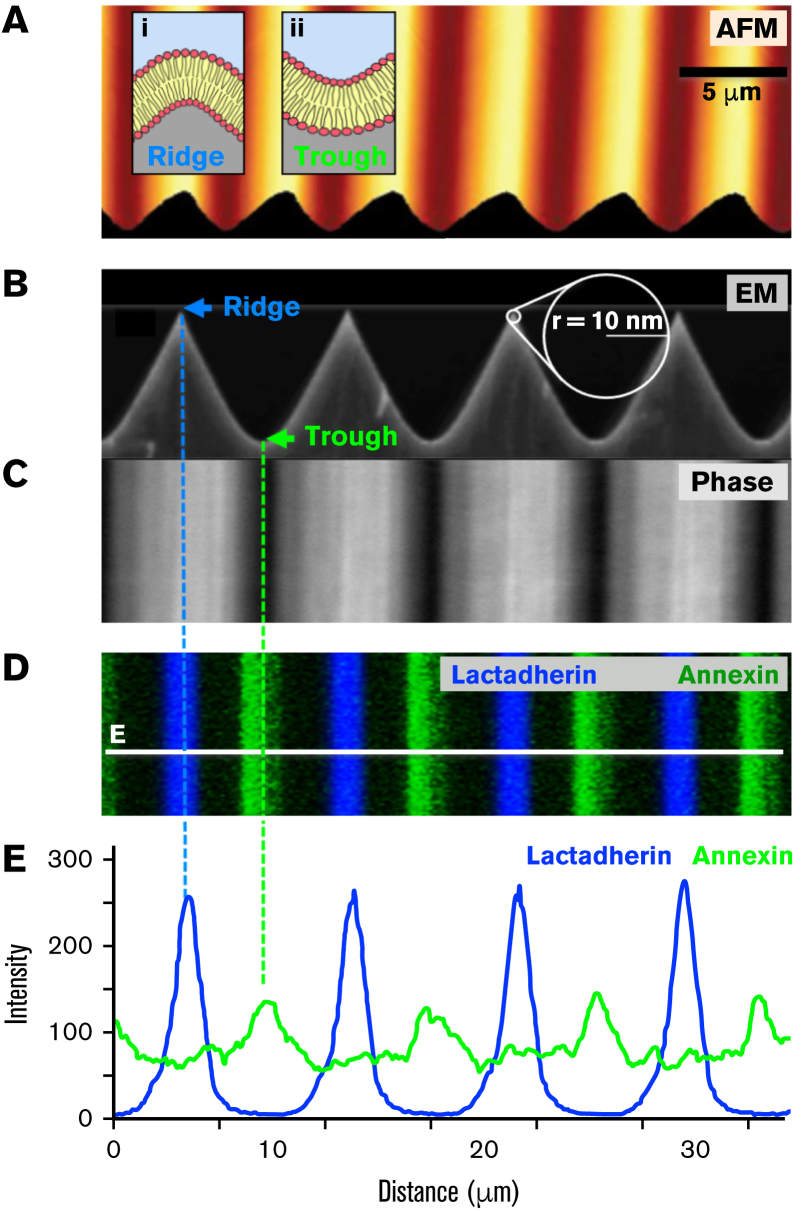
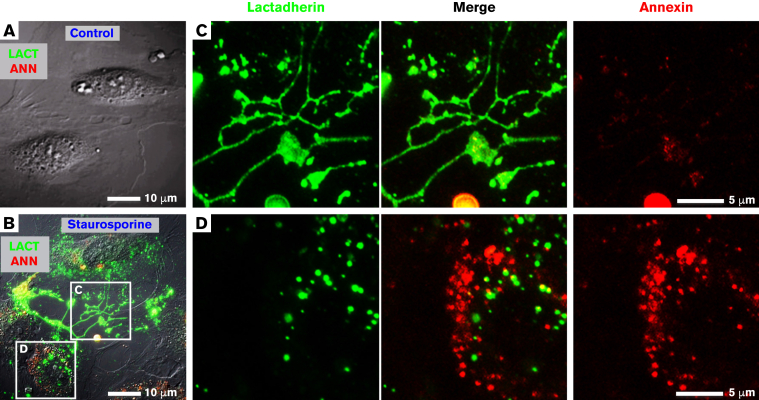
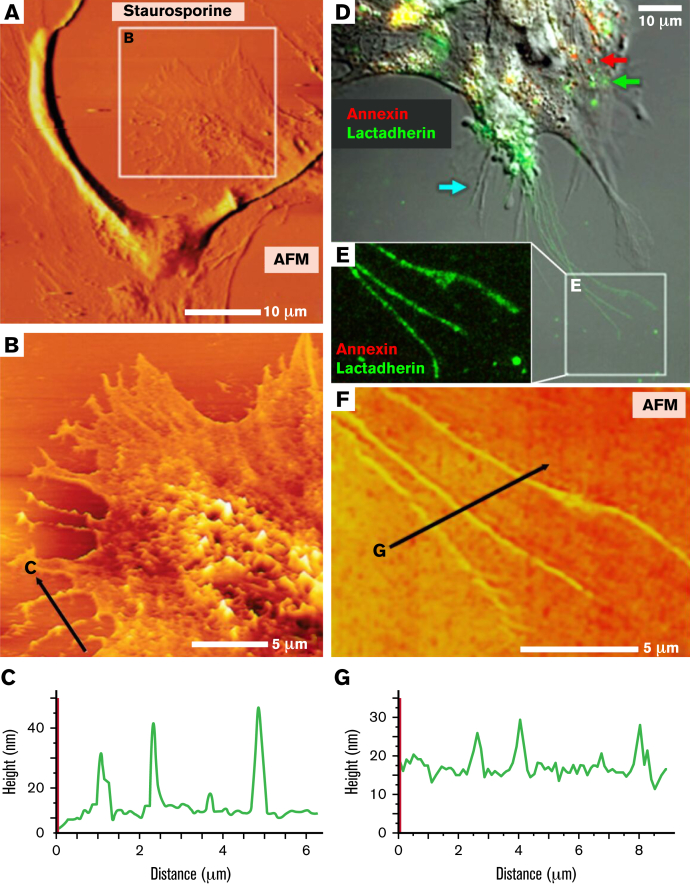
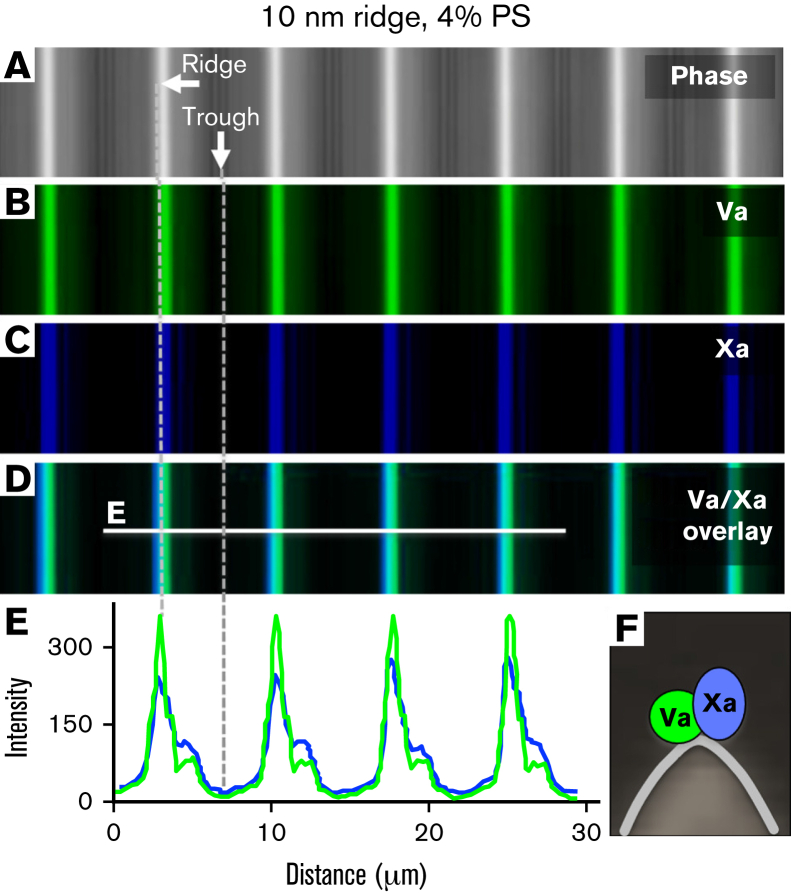
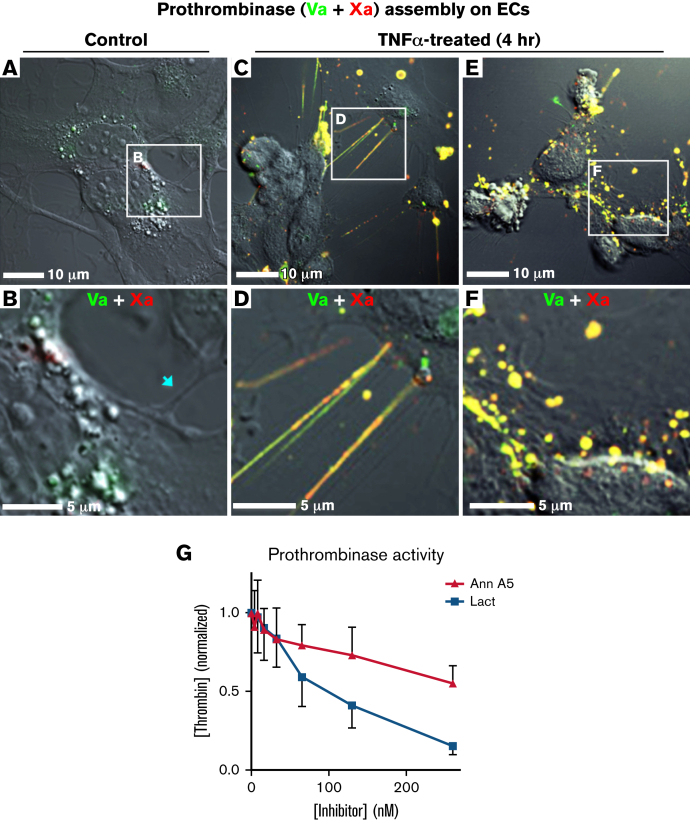
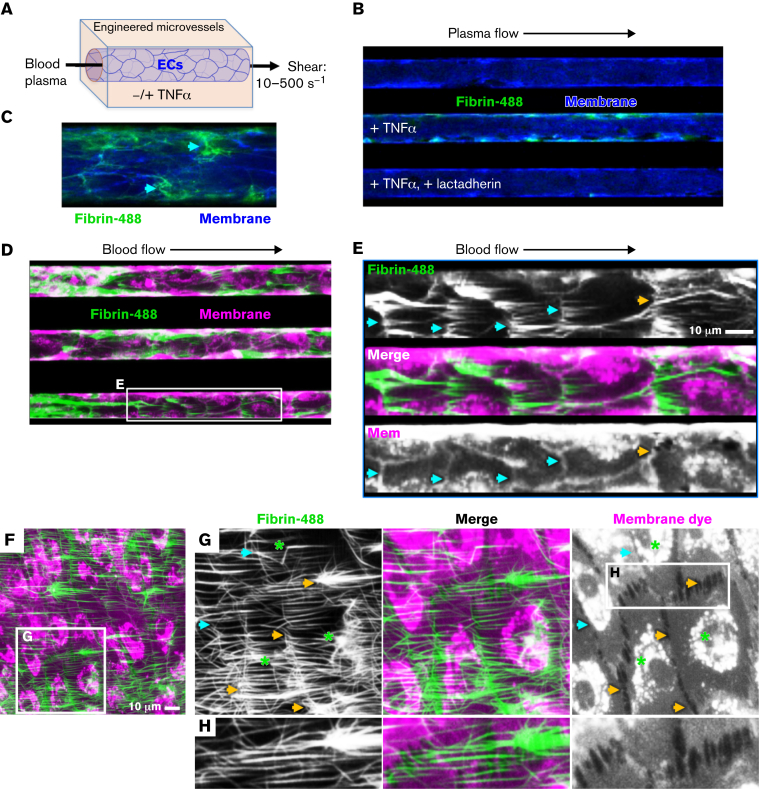
Prior reports indicate that the convex membrane curvature of phosphatidylserine (PS)-containing vesicles enhances formation of binding sites for factor Va and lactadherin. Yet, the relationship of convex curvature to localization of these proteins on cells remains unknown. We developed a membrane topology model, using phospholipid bilayers supported by nano-etched silica substrates, to further explore the relationship between curvature and localization of coagulation proteins. Ridge convexity corresponded to maximal curvature of physiologic membranes (radii of 10 or 30 nm) and the troughs had a variable concave curvature. The benchmark PS probe lactadherin exhibited strong differential binding to the ridges, on membranes with 4% to 15% PS. Factor Va, with a PS-binding motif homologous to lactadherin, also bound selectively to the ridges. Bound factor Va supported coincident binding of factor Xa, localizing prothrombinase complexes to the ridges. Endothelial cells responded to prothrombotic stressors and stimuli (staurosporine, tumor necrosis factor-α [TNF- α]) by retracting cell margins and forming filaments and filopodia. These had a high positive curvature similar to supported membrane ridges and selectively bound lactadherin. Likewise, the retraction filaments and filopodia bound factor Va and supported assembly of prothrombinase, whereas the cell body did not. The perfusion of plasma over TNF-α-stimulated endothelia in culture dishes and engineered 3-dimensional microvessels led to fibrin deposition at cell margins, inhibited by lactadherin, without clotting of bulk plasma. Our results indicate that stressed or stimulated endothelial cells support prothrombinase activity localized to convex topological features at cell margins. These findings may relate to perivascular fibrin deposition in sepsis and inflammation.


Conflict of interest statement

Conflict-of-interest disclosure: The authors declare no competing financial interests.

Figures

None
Graphical abstract
Figure 1.
Figure 1.
Lactadherin binds convex ridges of supported membranes and annexin A5 binds concave valleys. We fabricated chemically etched silica nano-ridge/-trough substrates as described in “Materials and methods.” (A) Color-coded AFM topographic image of a representative substrate containing ridges (yellow) and troughs (orange/brown) with radii of curvature of +10 and −300 nm, respectively. Insets i and ii: schematics of the expected positively and negatively curved lipid bilayers formed on the ridges and troughs, respectively. (B) A high-resolution scanning electron microscopy side-view image of the substrate. (C) Top-down phase images of the substrate showing brightly reflective ridges and dark troughs. (D) Substrates were overlaid with lipid bilayers containing 4% PS, 20% PE, and 76% PC followed by incubation with 10 nM lactadherin-alexa-647 (blue pseudocolor) and 10 nM annexin A5-FITC (green) in the presence of calcium and imaged by serial-section confocal microscopy. Compressed z stacks are represented as a maximum-intensity projection image. (E) Fluorescence intensity profiles corresponding to the white line in panel D. Lactadherin preferentially bound to the positively curved ridges, whereas annexin A5 selectively bound to the negatively curved troughs (dashed lines). Additional quantitative evaluatit of Medicine,Brigham andon displayed in supplemental Figure 1.
Figure 2.
Figure 2.
PS-containing features on staurosporine-treated HUVECs bind lactadherin or annexin A5. Staurosporine-treated HUVECs were incubated with 10 nM lactadherin-488 (green) and annexin A5-Cy3 (red) and visualized with live-cell imaging. (A) Representative image of control, vehicle-treated HUVECs with differential interference contrast (gray scale) and fluorescence lactadherin (green) and annexin A5 (red) overlaid. Note the absence of either green or red fluorescence. (B) HUVECs pretreated for 15 minutes with 0.5 μM staurosporine before incubation with lactadherin and annexin A5. The representative image shows strong binding of lactadherin and annexin A5 to submicrometer scale structures with filopodialike (C) and punctate (D) structures. (C-D) Enlarged views of boxed regions in panel B showing individual and merged fluorescence signals.
Figure 3.
Figure 3.
AFM topographic and fluorescence imaging of PS-containing domains on stressed HUVECs. (A) HUVECs grown on glass substrates and treated with staurosporine as in Figure 2 (0.5 μM, 15 minutes) followed by topographic AFM imaging, as described in “Materials and methods.” The representative micrograph shows a cell undergoing retraction with filopodialike protrusions. (B) High-resolution scan of the boxed region in panel A. (C) Topographic profile of the retracted portion of the cell along the black line in panel B indicating that the heights of 3 individual filopodialike structures varied between ∼20 and 30 nm. (D) HUVECs were treated with staurosporine, then incubated live with 10 nM lactadherin-488 (green) and annexin A5-Cy3 (red) and imaged by confocal and differential interference contrast (grayscale) microscopy. A representative image shows that the cell body contained punctate structures that preferentially bound either lactadherin or annexin A5 (eg, green and red arrows), though some areas of apparently coincident (yellow) binding were also noted. Thin filopodialike structures were at the periphery and a subset strongly bound lactadherin, but not annexin A5 (see box in panel E). Some filopodia bound neither lactadherin nor annexin A5 (cyan arrow). (E) A higher magnification fluorescent image of the area indicated in panel D. (F) High resolution AFM topographical scanning image of the cells protrusions shown by fluorescence in panel E. (G) Topographic profile of the protrusions along the line indicated in panel F, with a mean diameter of ∼15 nm.
Figure 4.
Figure 4.
Factor Va binding sites and prothrombinase assembly localize to convex membrane ridges. Lipid bilayers containing 4% PS, 20% PE, and 76% PC were prepared on substrates with 10-nm radii ridges. Factor Va-Alexa 488, 10 nM (green) and 10 nM factor Xa-Alexa 647 (factor Xa-Glu-Gly-Arg-biotin/streptavidin-Alexa 647; blue) were incubated in the buffer overlaying the membrane ridges. (A) Differential interference contrast imaging mode localizes ridges (white) and troughs (dark) of the silica substrate. (B-C) Fluorescence images of bound factor Va–Alexa 488 and factor Xa–Alexa 647, respectively. (D) Overlay of images in panels A to C. (E) Fluorescence intensity line scans of the line in panel D shows that factors Va and Xa exhibited coincident and preferential binding to the convex ridges. See scheme in panel F.
Figure 5.
Figure 5.
Topology-related assembly of prothrombinase complexes on TNF-α–activated HUVECs. Subconfluent HUVECs were treated with TNF-α (50 ng/mL, 4 hours) and then incubated with factor Va-Alexa 488, 10 nM (green) and 10 nM factor Xa-647 (red). They were then imaged, live, with differential interference contrast and confocal fluorescence. (A-B) Representative wide and enlarged views of a field of HUVECs with low levels of factor Va and Xa binding. Thin cellular projections did not have visible staining (arrow). (C-D) Representative wide and enlarged views of a field of HUVECs containing colocalized factors Va and Xa on filaments and filopodialike structures at the cell periphery. (E-F). Representative wide and enlarged views of a field of HUVECs showing colocalized binding of factor Va and Xa on punctate structures of the cell body. (G) HUVECs were cultured in 96-well plates in the presence of TNF-α. Prothrombinase activity was measured in a discontinuous assay with a chromogenic thrombin substrate. Prothrombinase activity was inhibited to a greater degree by lactadherin compared with annexin A5. Data are mean ± standard deviation for 2 experiments, each performed in triplicate.
Figure 6.
Figure 6.
Fibrin deposition around TNF-α–treated endothelial cells under flow conditions. (A) Engineered microvessel setup. HUVECs were grown to confluence on engineered microfluidic substrate and pretreated with TNF-α (100 ng/mL), overnight (B-C) or for 4 hours (D-H). The cell layer was stained with CellMask Orange or Deep Red to visualize the plasma membrane (pseudocolor blue B, C; magenta D-H). Fresh plasma (B, C) was supplemented with corn trypsin inhibitor and fluorescein-labeled fibrinogen (green) and passed through the microfluidic with a sheer of 500 seconds−1 for 30 minutes. The microvessels were imaged with fluorescence microscopy. (B) Representative image of fibrin definition in TNF-α–treated microvessel perfused with plasma at 500 seconds−1. Fibrin deposition was not observed in the control channel and was prevented by lactadherin in TNF-α–treated microvessels. (C) Enlarged view of TNF-α–treated microvessel with arrows identifying fibrin deposition at cell junctions or intercellular gaps. (D) Fibrin deposition was also evaluated after perfusion of fresh whole blood, supplemented with corn trypsin inhibitor and fluorescein-fibrinogen at sheer of 100 seconds−1. Fibrin accumulated at cellular junctions (magenta pseudocolor) in a reticular pattern (magenta) as well as in strands in the direction of flow. (E) Enlarged view of boxed region in panel D with fibrin staining shown as white in the top panel, membrane staining as white in the bottom panel, and merged image in the middle. Arrows highlight junctional deposition of fibrin coincident with intact junctions (cyan) or gaps containing junctions with filament-/filopodia-like structures (yellow). (F) Representative field of view under conditions as in panel D, at higher magnification. (G) Enlarged view of boxed region in F with fibrin shown in white (left) membrane in white (right) and merged (middle). Arrows (G-H) highlight junctional deposition of fibrin coincident with intact junctions (cyan) or gaps containing junctions with filament-/filopodia-like structures (yellow). Asterisks indicate occasional fibrin depositions initiated at discrete locations on the cell body. (H) Further enlargement of the boxed region in panel G.

Similar articles

Cited by

References

    1. Shi J, Shi Y, Waehrens LN, Rasmussen JT, Heegaard CW, Gilbert GE. Lactadherin detects early phosphatidylserine exposure on immortalized leukemia cells undergoing programmed cell death. Cytometry A. 2006;69A(12):1193–1201. - PubMed
    1. Waehrens LN, Heegaard CW, Gilbert GE, Rasmussen JT. Bovine lactadherin as a calcium-independent imaging agent of phosphatidylserine expressed on the surface of apoptotic HeLa cells. J Histochem Cytochem. 2009;57(10):907–914. - PMC - PubMed
    1. Zhou J, Shi J, Hou J, et al. Phosphatidylserine exposure and procoagulant activity in acute promyelocytic leukemia. J Thromb Haemost. 2010;8(4):773–782. - PubMed
    1. Sakurai Y, Hardy ET, Ahn B, et al. A microengineered vascularized bleeding model that integrates the principal components of hemostasis. Nat Commun. 2018;9(1):509. - PMC - PubMed
    1. van den Eijnde SM, van den Hoff MJ, Reutelingsperger CP, et al. Transient expression of phosphatidylserine at cell-cell contact areas is required for myotube formation. J Cell Sci. 2001;114(Pt 20):3631–3642. - PubMed

Publication types