. 2022 Oct 5;12(10):2330-2349.
doi: 10.1158/2159-8290.CD-21-1248.

Single-Cell Sequencing Reveals Trajectory of Tumor-Infiltrating Lymphocyte States in Pancreatic Cancer

Affiliations

Single-Cell Sequencing Reveals Trajectory of Tumor-Infiltrating Lymphocyte States in Pancreatic Cancer

Aislyn Schalck et al. Cancer Discov. .

Abstract

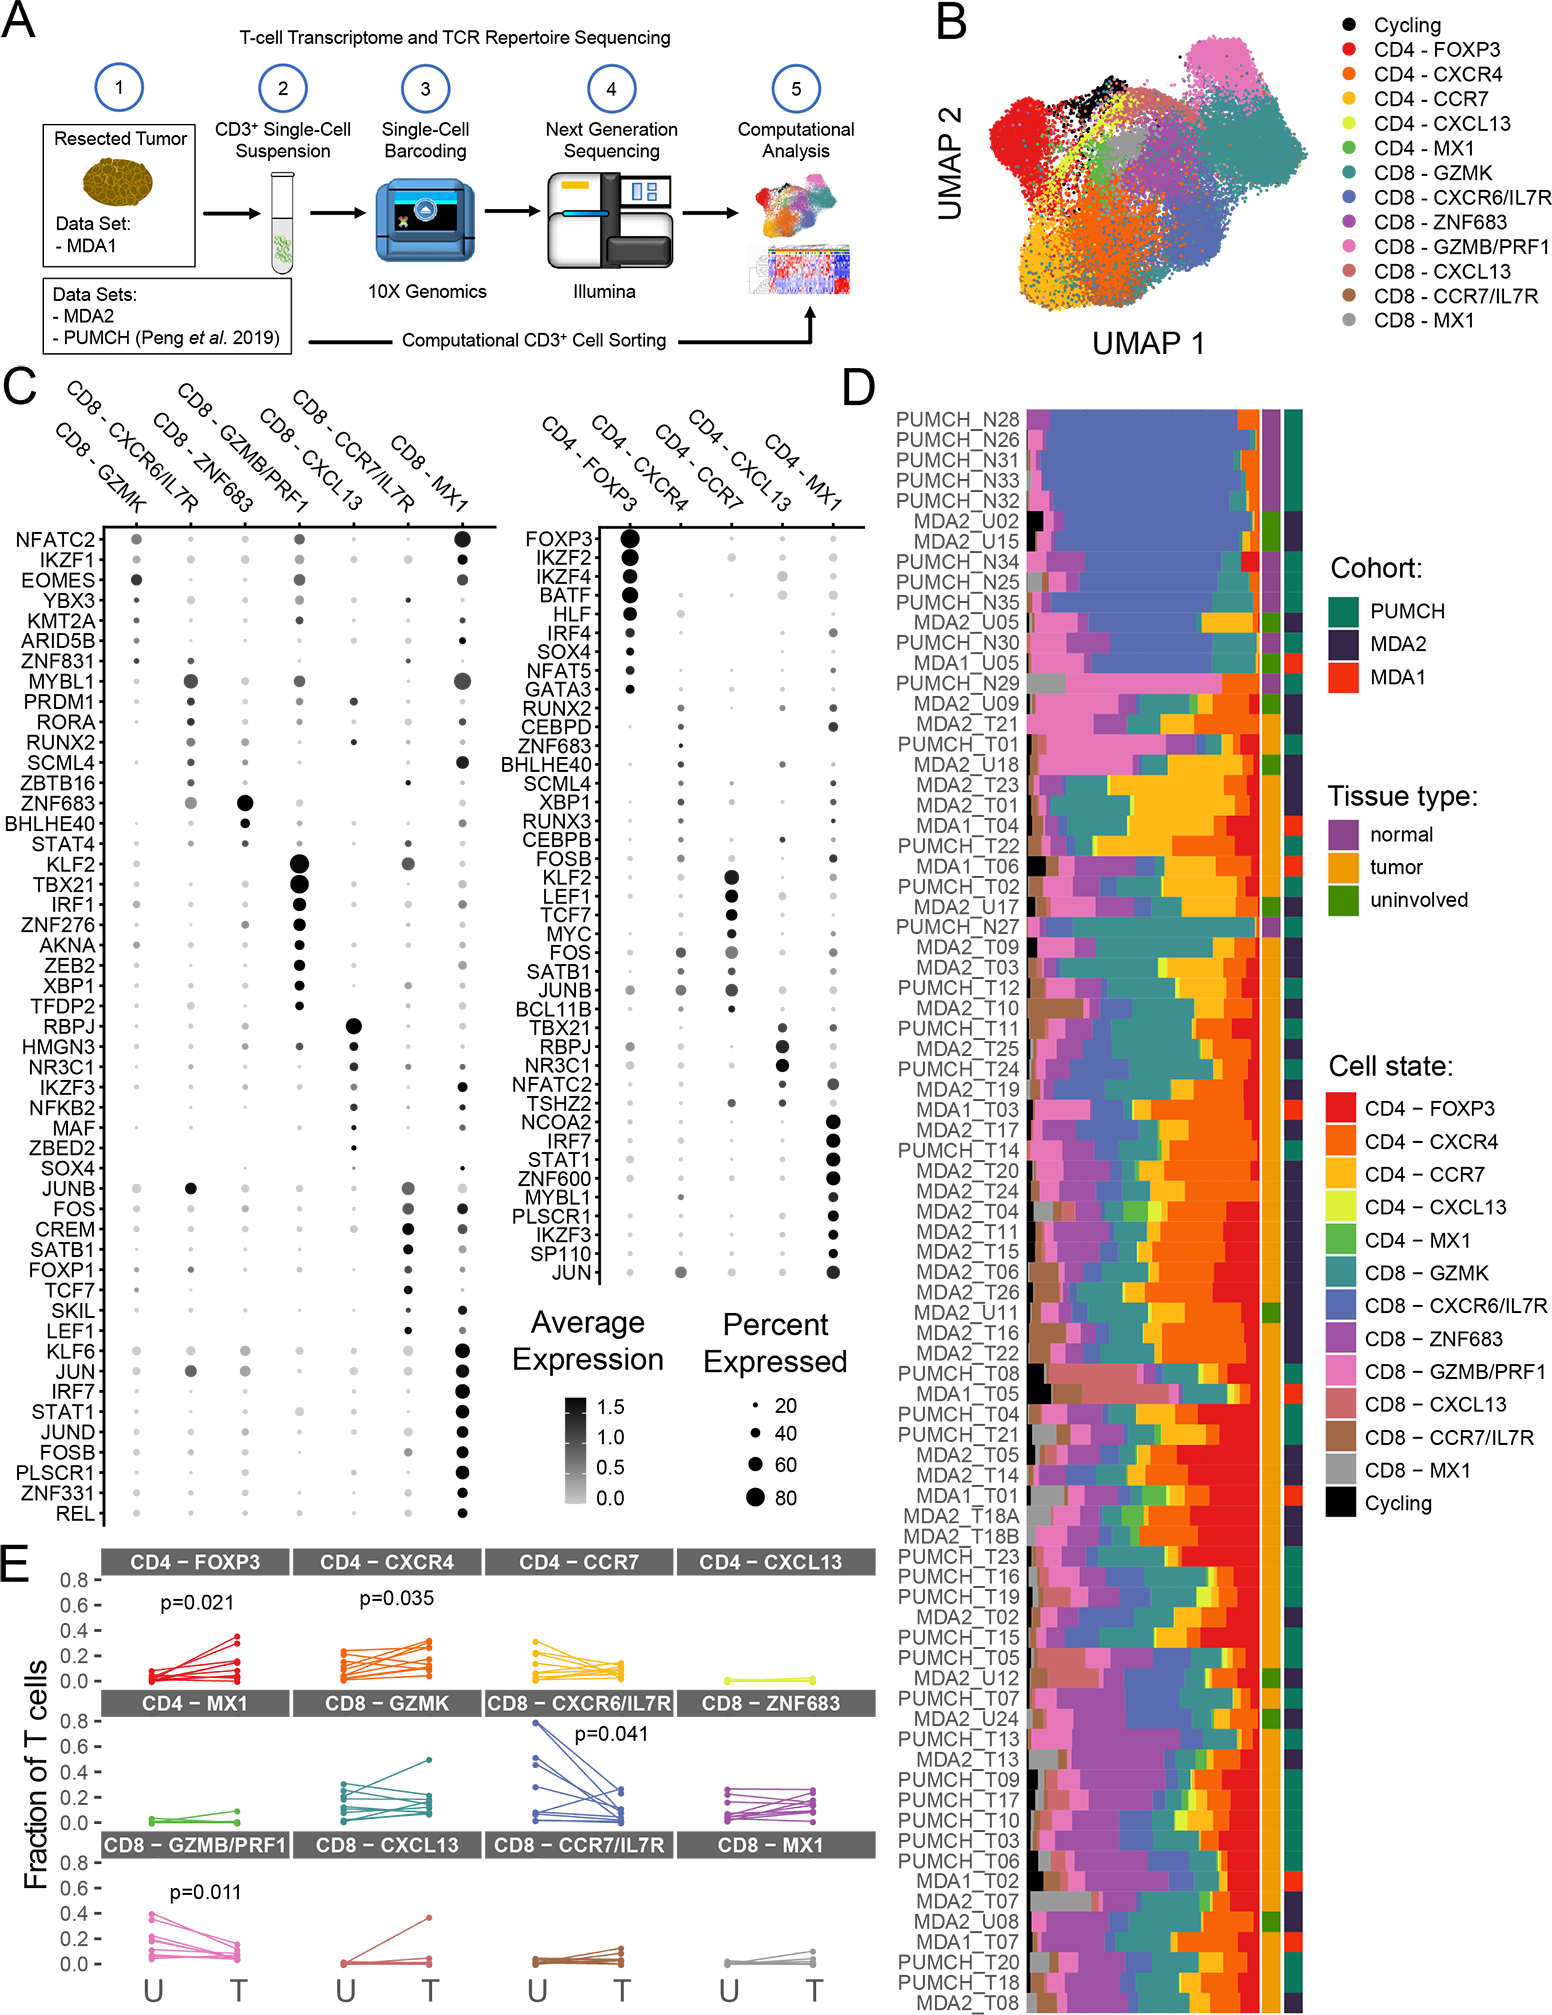
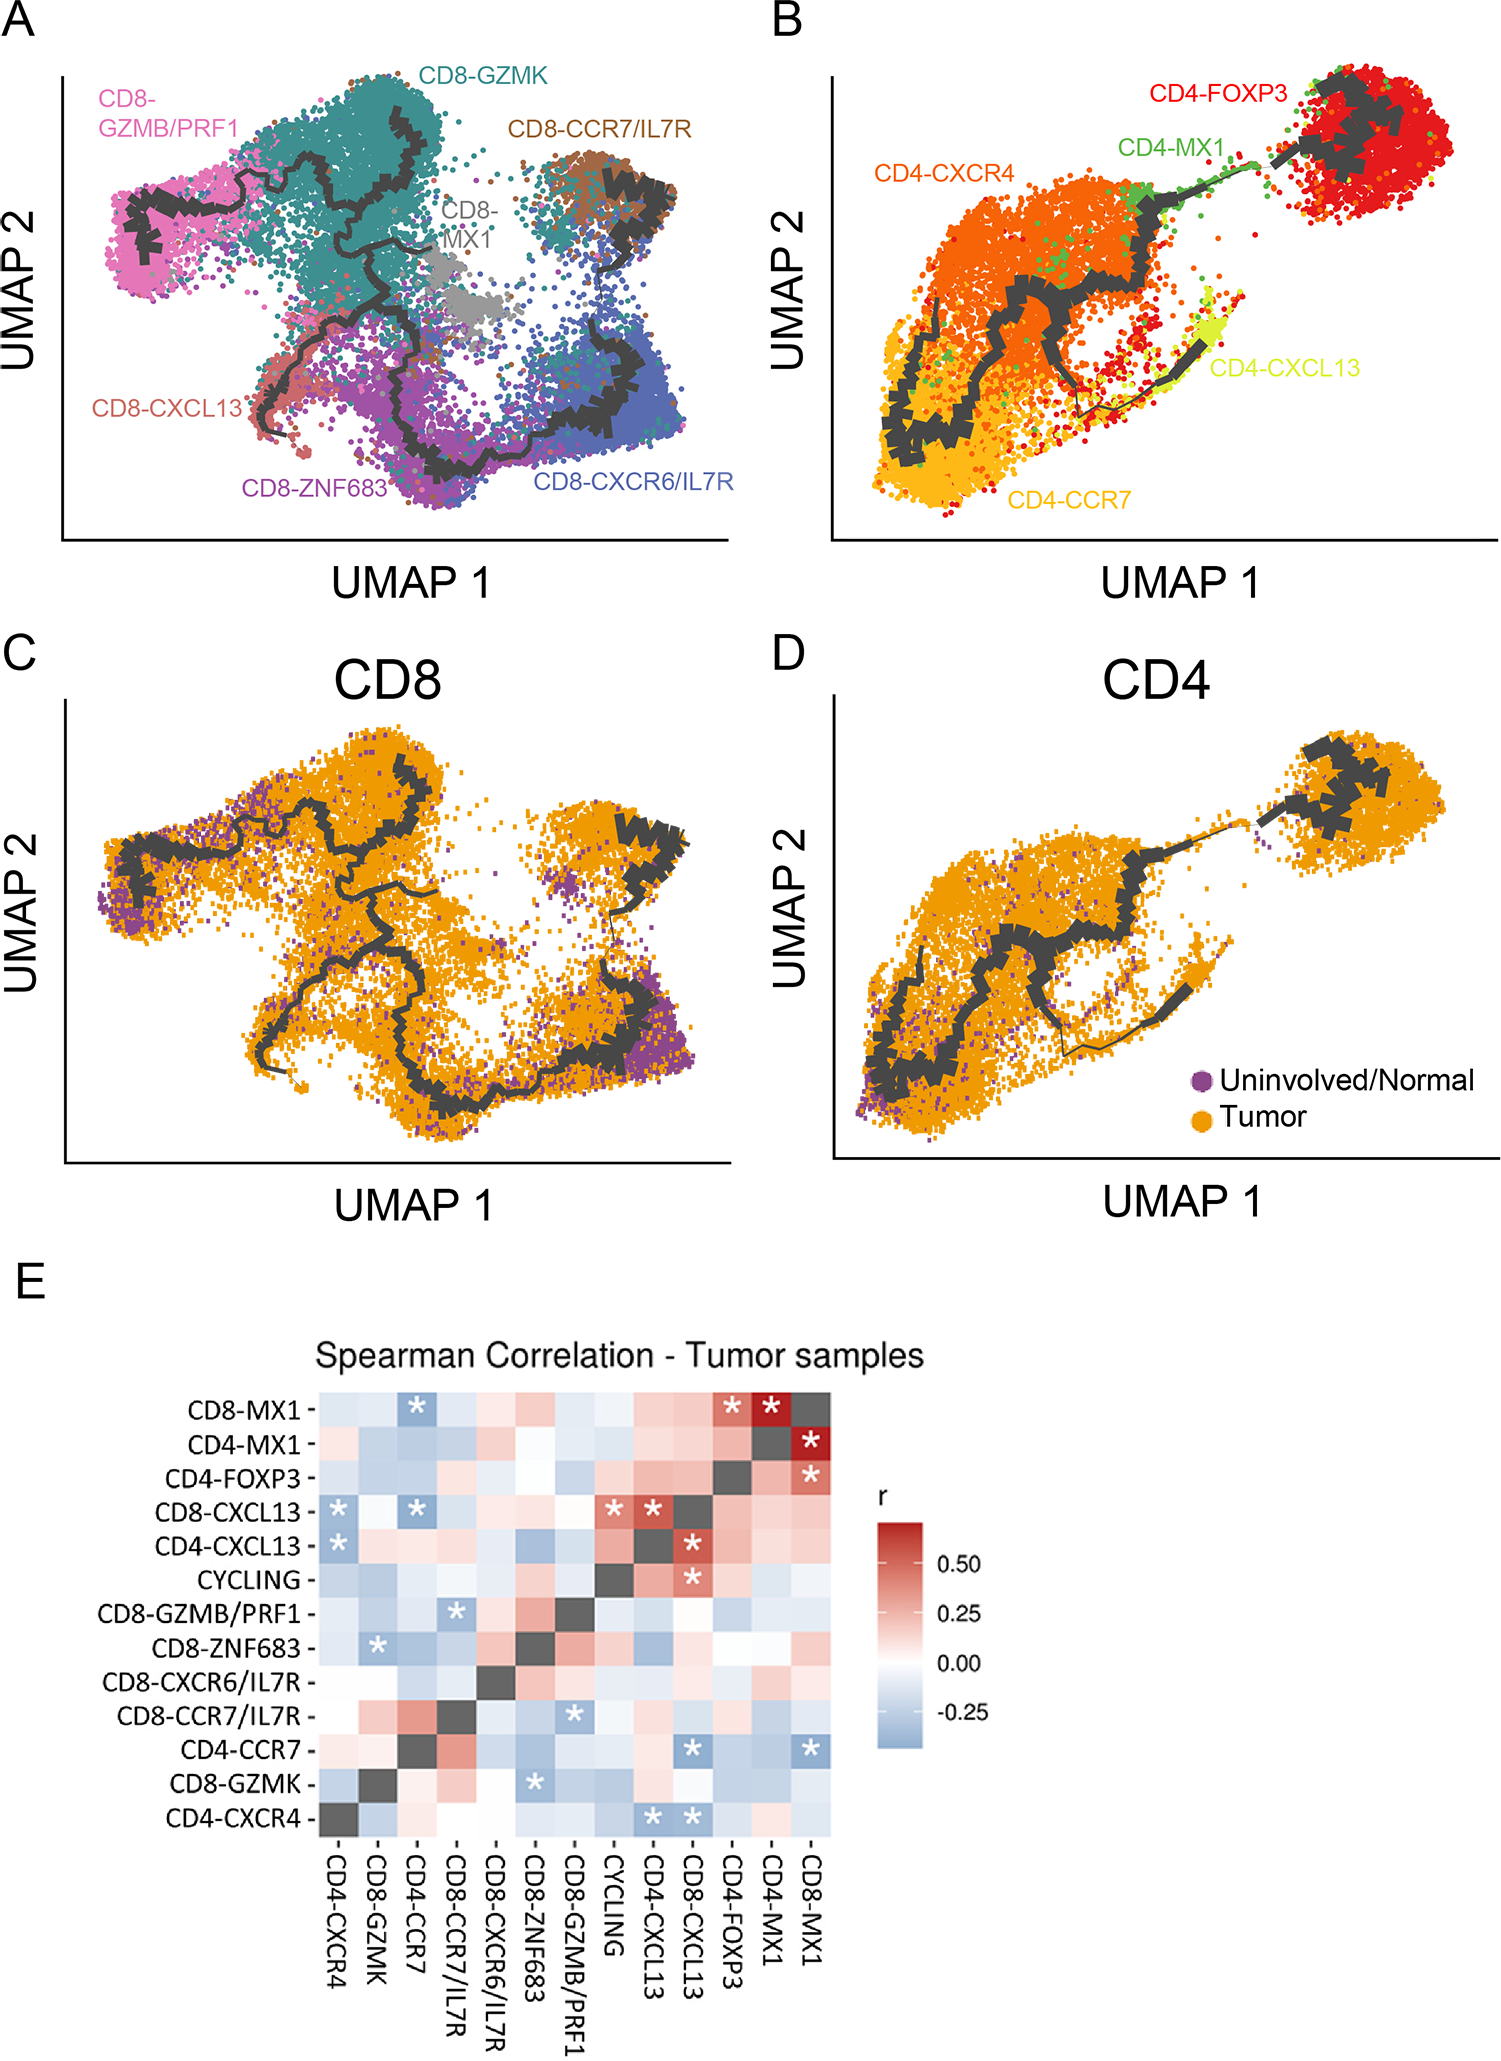
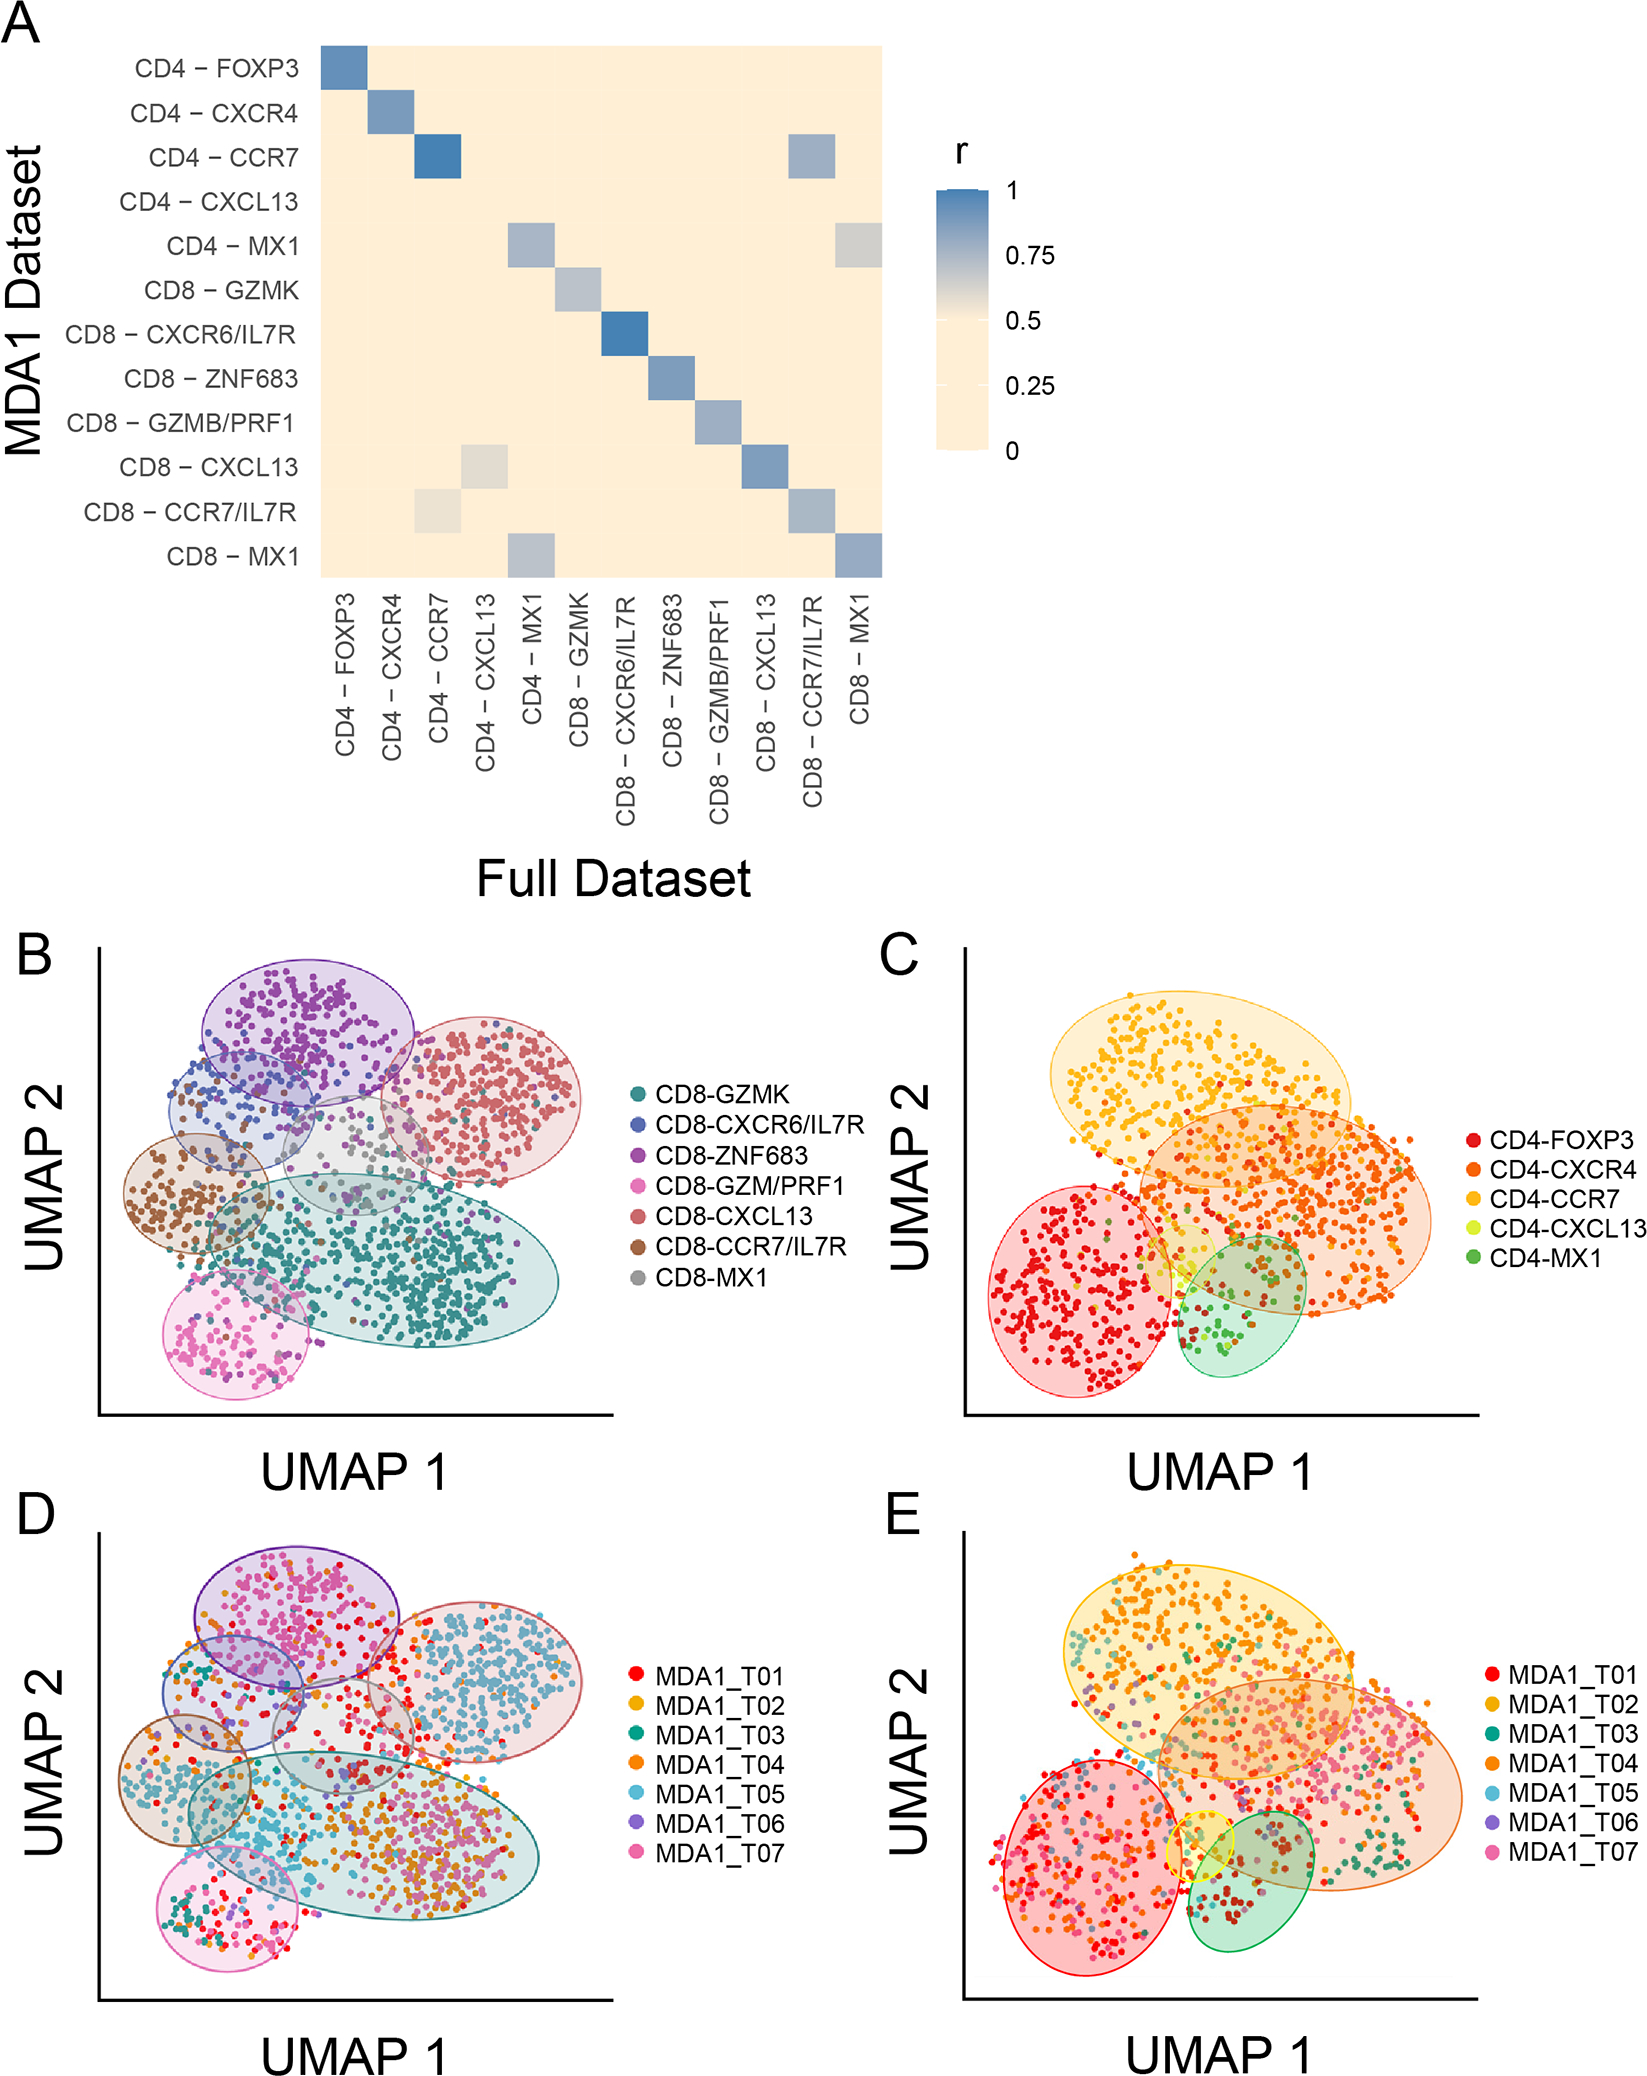
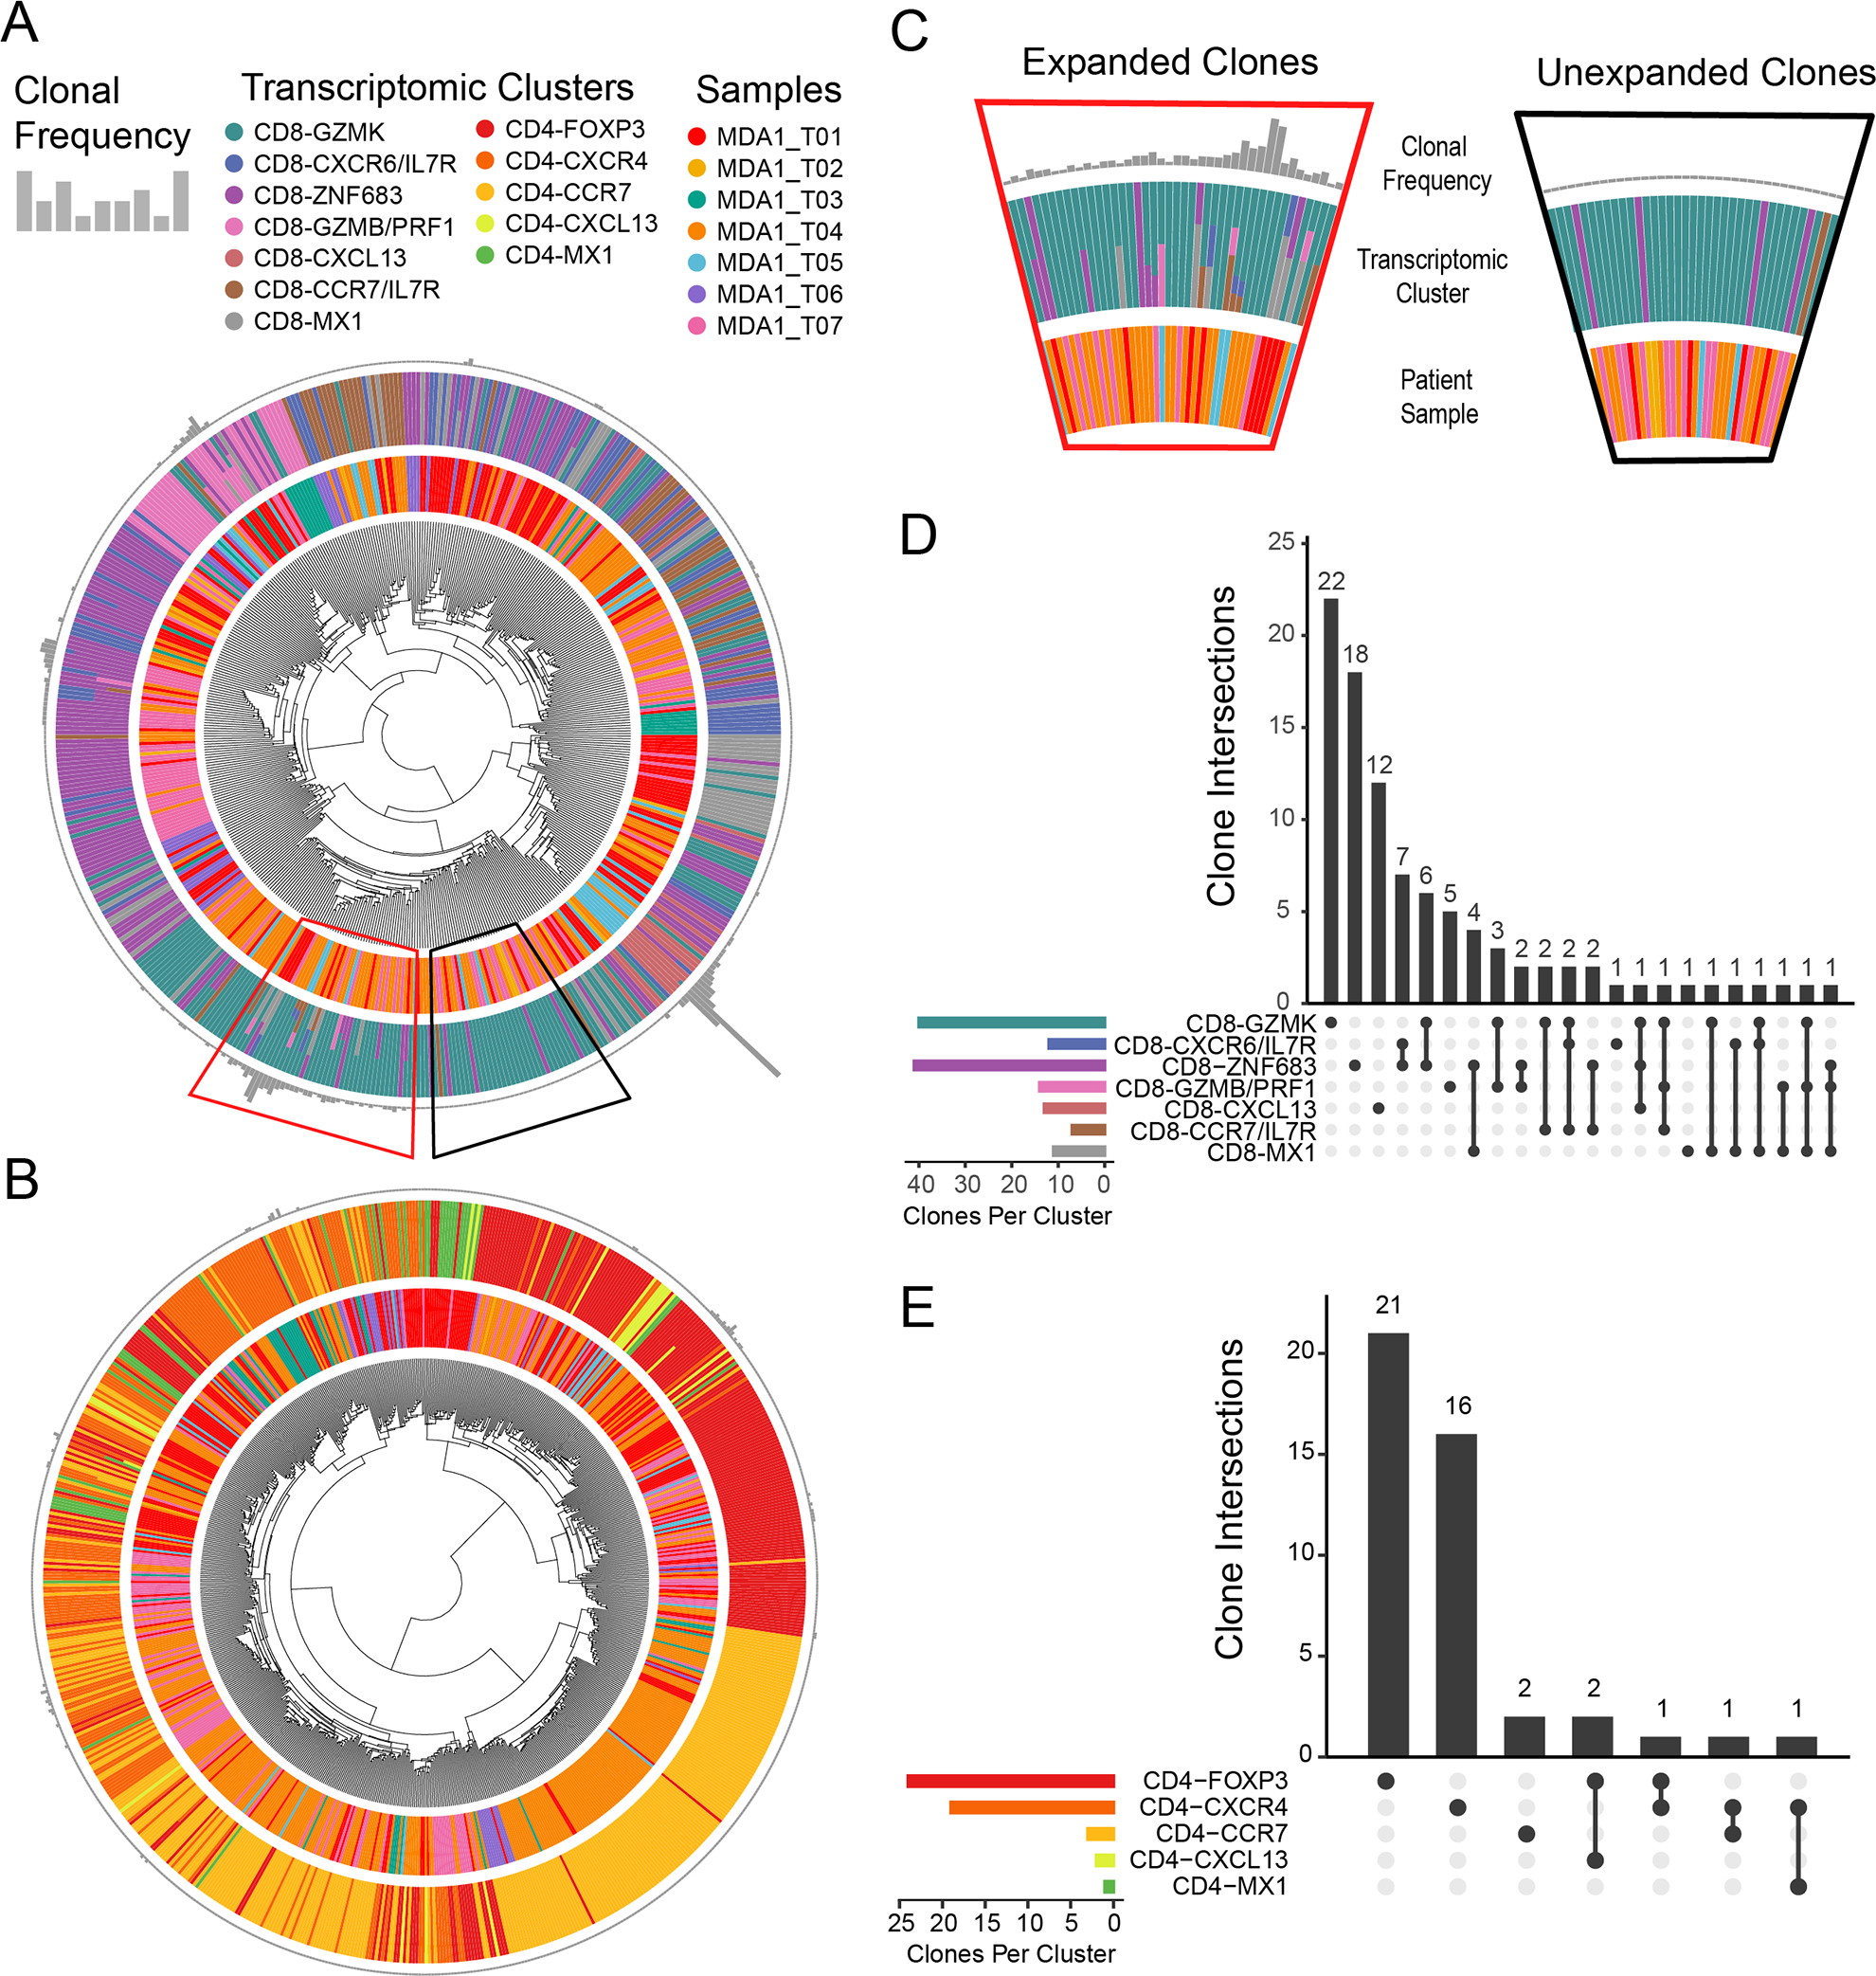
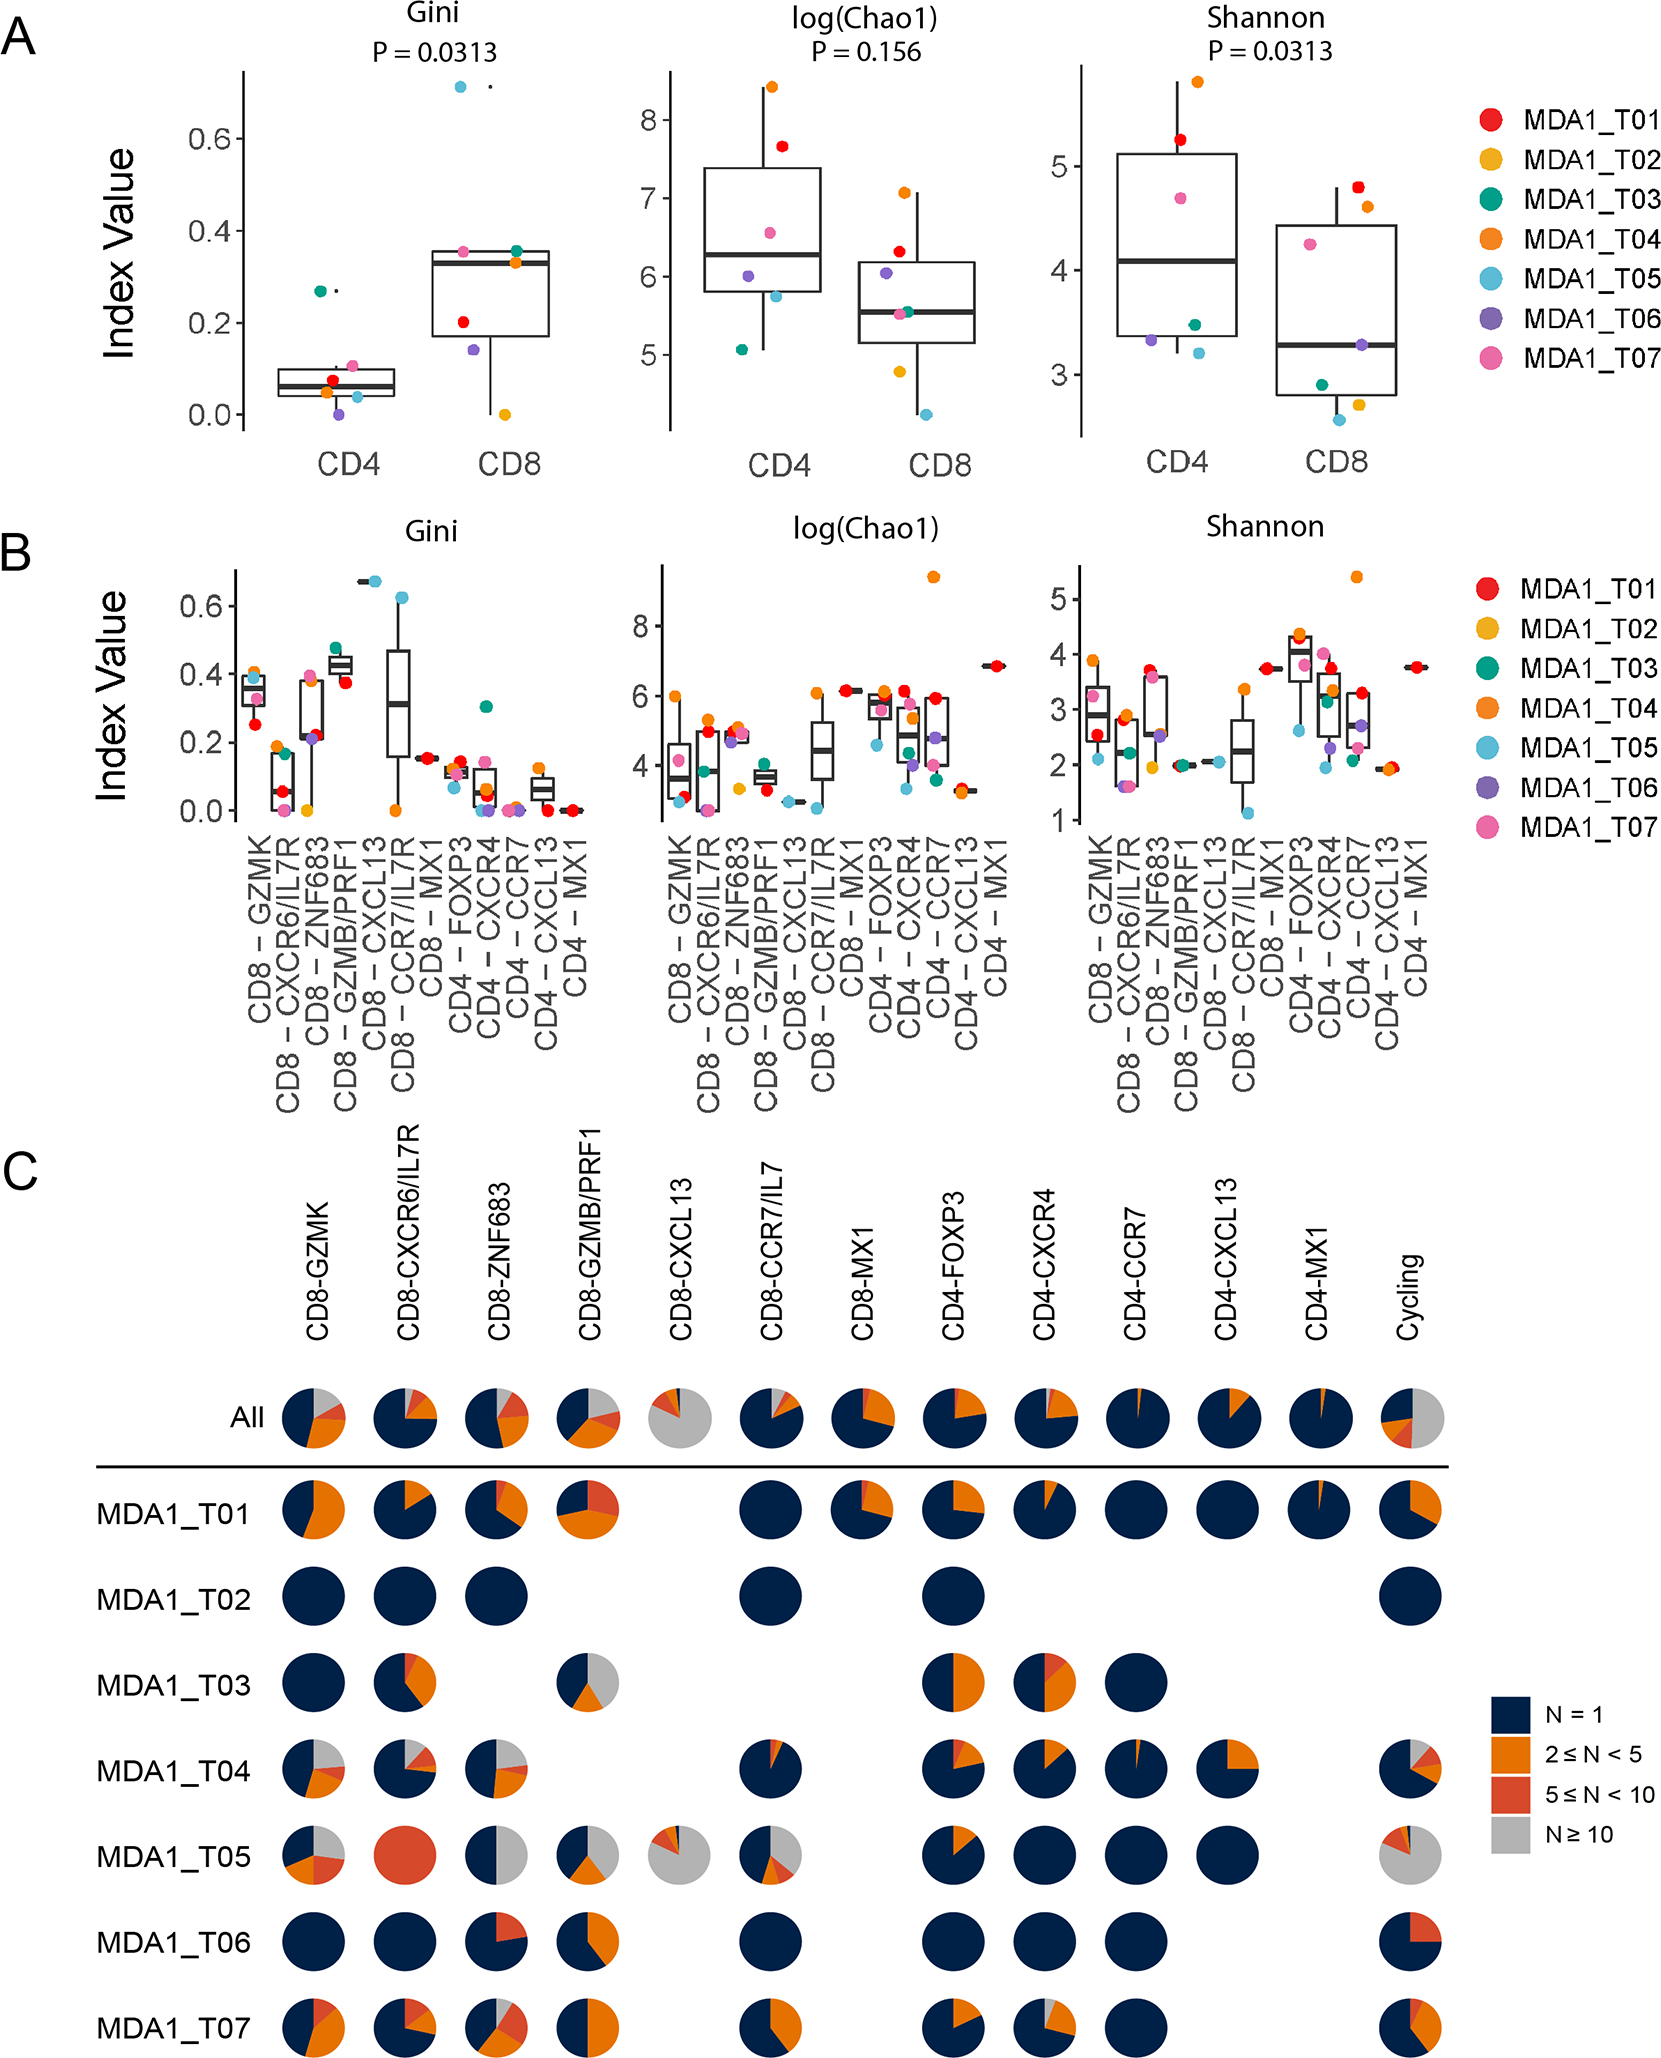
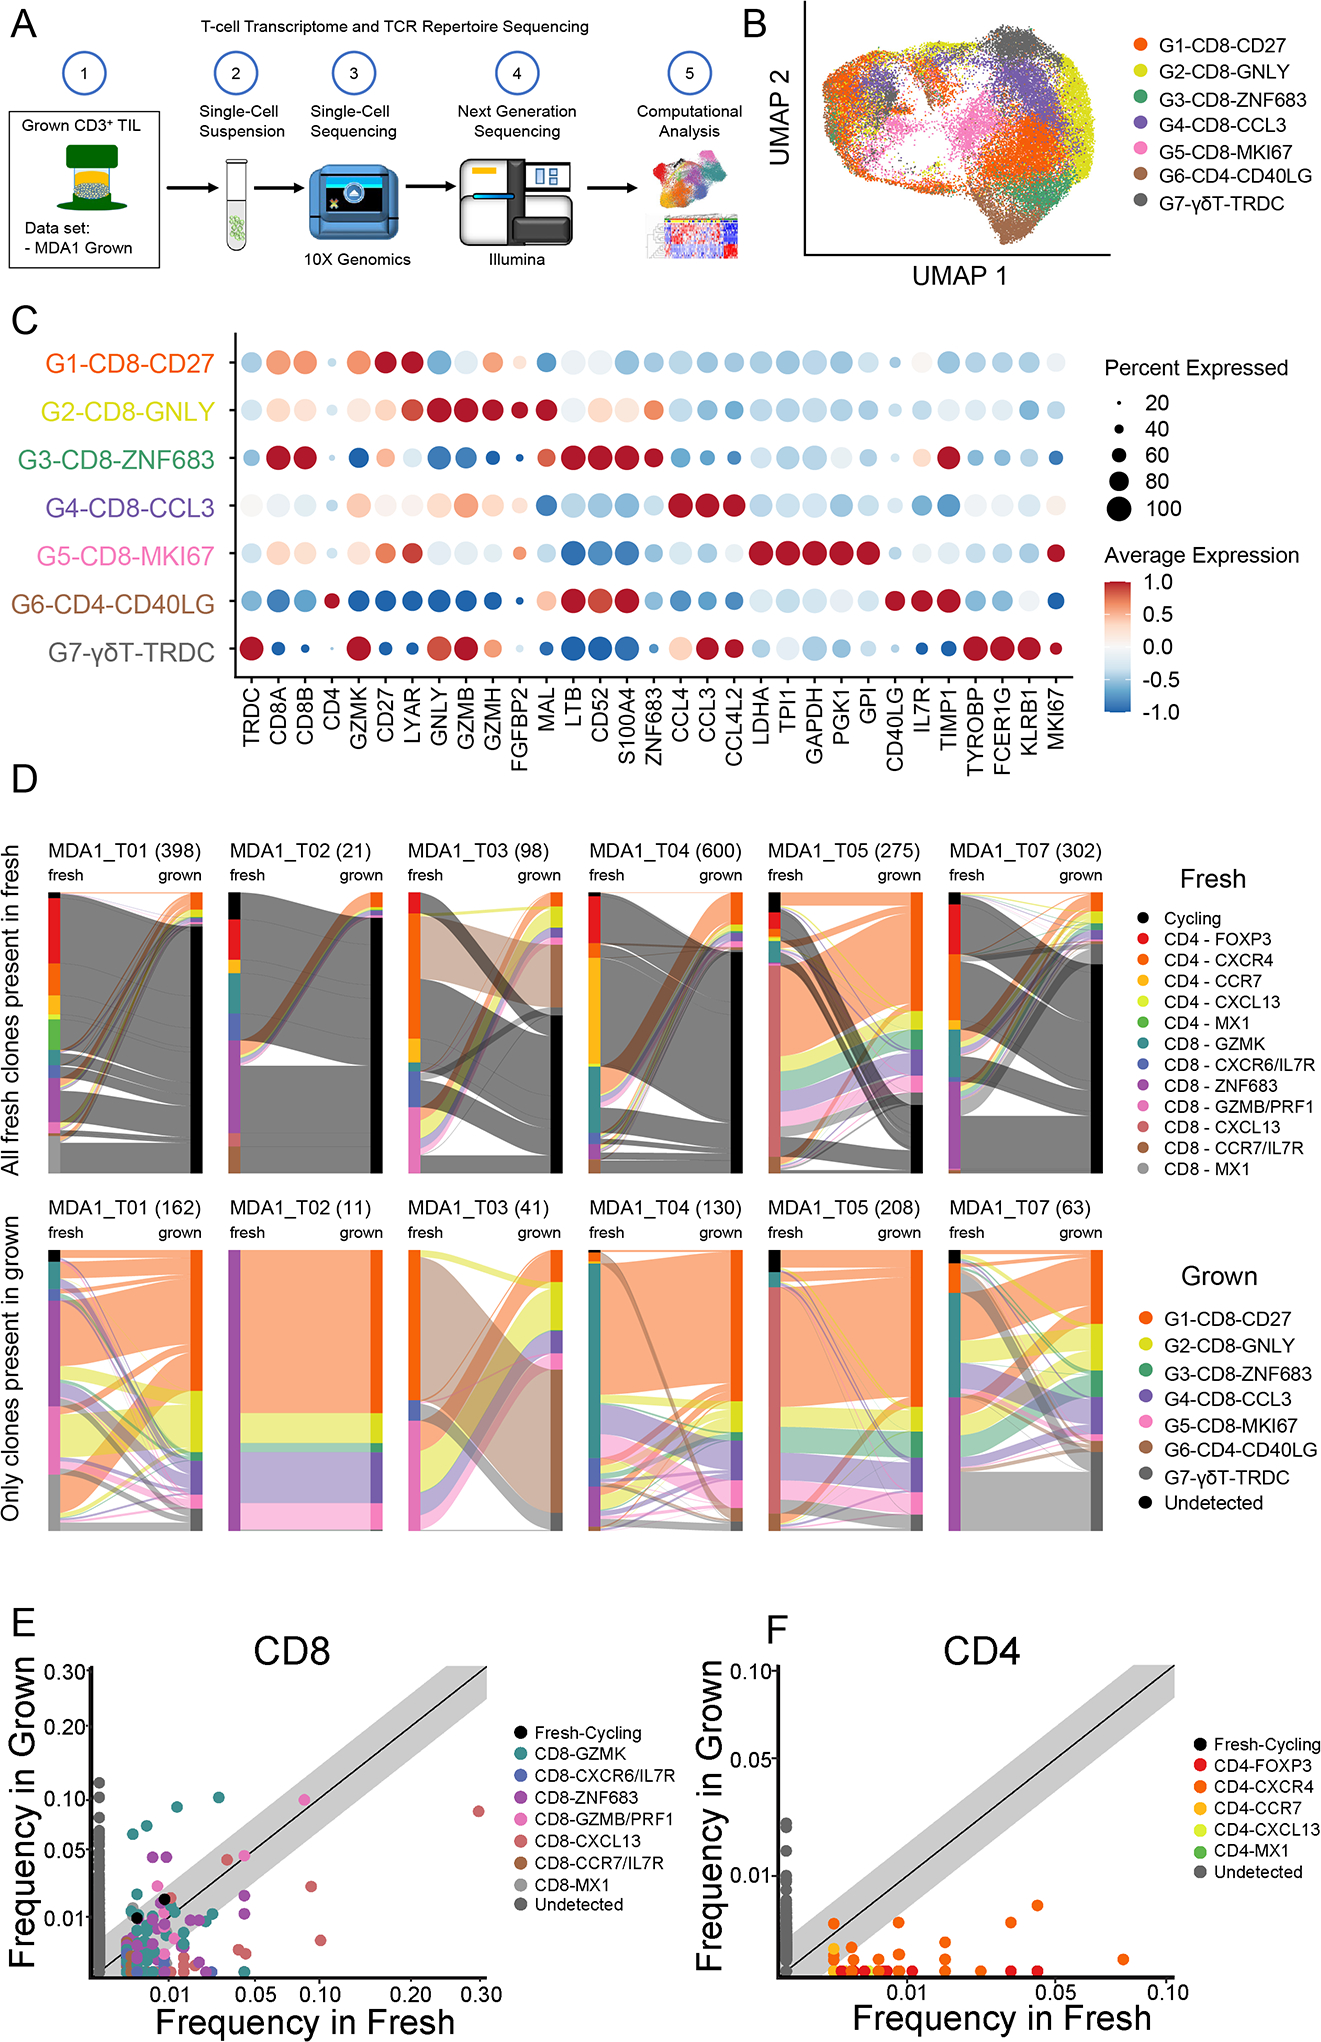
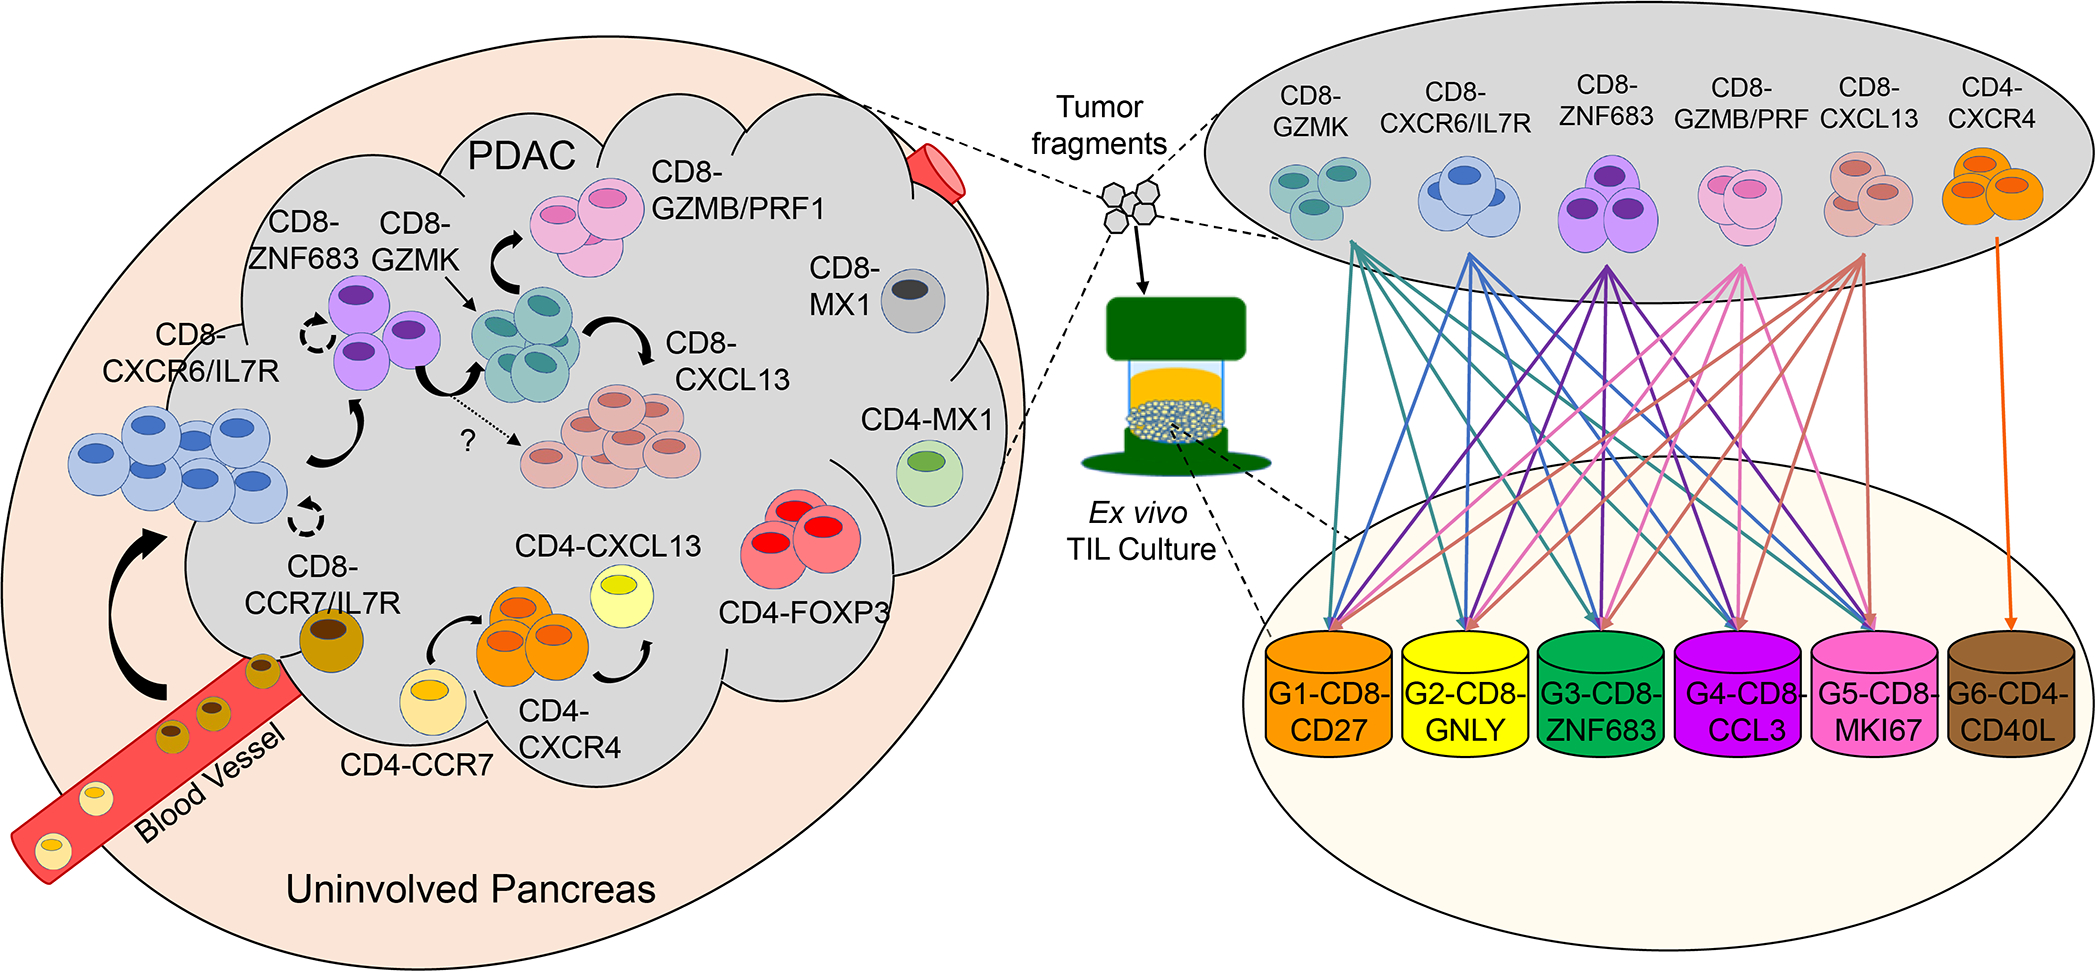
Pancreatic ductal adenocarcinoma (PDAC) has few effective treatments. Immunotherapy, an attractive alternative strategy, remains challenging with the lack of knowledge on the tumor-infiltrating lymphocyte (TIL) landscape in PDAC. To generate a reference of T-cell subpopulations, we profiled 80,000 T cells from 57 PDAC samples, 22 uninvolved/normal samples, and cultured TIL using single-cell transcriptomic and T-cell receptor analysis. These data revealed 20 cell states and heterogeneous distributions of TIL populations. The CD8+ TIL contained a putative transitional GZMK+ population based on T-cell receptor clonotype sharing, and cell-state trajectory analysis showed similarity to a GZMB+PRF1+ cytotoxic and a CXCL13+ dysfunctional population. Statistical analysis suggested that certain TIL states, such as dysfunctional and inhibitory populations, often occurred together. Finally, analysis of cultured TIL revealed that high-frequency clones from effector populations were preferentially expanded. These data provide a framework for understanding the PDAC TIL landscape for future TIL use in immunotherapy for PDAC.

Significance: To improve the efficacy of immunotherapy in PDAC, there is a great need to understand the PDAC TIL landscape. This study represents a reference of PDAC TIL subpopulations and their relationships and provides a foundation upon which to base future immunotherapeutic efforts. This article is highlighted in the In This Issue feature, p. 2221.


Conflict of interest statement

Conflict of Interest: A.M. receives royalties for a pancreatic cancer biomarker test from Cosmos Wisdom Biotechnology, and this financial relationship is managed and monitored by the UTMDACC Conflict of Interest Committee. A.M. also receives royalties as an inventor on a patent that has been licensed by Johns Hopkins University to Thrive Earlier Detection (an Exact Sciences Company).

Figures

Figure 1.
Figure 1.. Clustering and differential gene expression analysis of pancreatic ductal adenocarcinoma (PDAC) tumor-infiltrating lymphocytes (TIL).
(A) Scheme of overall study in which TIL from three cohorts (two internal and one previously published) from PDAC and uninvolved/normal tissue underwent single-cell RNA sequencing analysis, and the data generated were used for transcriptomic and TCR sequencing analyses. (B) The uniform manifold approximation and projection (UMAP) projection of 39,694 single T cells from 57 PDAC samples and 22 uninvolved samples, showing seven CD8+ and five CD4+ cell state populations identified by shared nearest neighbor clustering. Each dot is a single cell and is colored according to transcriptomic state. (C) Top differentially expressed transcription factors for CD8+ and CD4+ TIL. Expression is marked by appearance of a circle, where greater the size indicates a greater percentage of cells express this gene and a color gradient that indicates higher level of expression as it moves from light gray to black. (D) A breakdown of the cell states within each patient sample is shown, where the samples are ordered by hierarchical tree. The fraction of T cells within each transcriptomic cell state is indicated by the size of the colored segments of each horizontal bar. Each horizontal bar represents an individual patient sample. Starting from the right side of the graph to the left side, the cohort, the tissue type, and cell state for each sample are indicated by colored squares. (E) Comparison of T-cell state frequencies between matched tumor and uninvolved samples (n=10). Only P values < 0.05 are displayed and were generated using a paired Wilcoxon statistical test, but no significant correlation was maintained after P value correction for multiple-testing.
Figure 2.
Figure 2.. Relationship between pancreatic ductal adenocarcinoma (PDAC) tumor-infiltrating lymphocyte (TIL) cell states inferred from pseudotime analysis and correlation of co-occurrence.
Monocle 3 pseudotime trajectory inference analysis for (A) CD8+ TIL and (B) CD4+ TIL. The thickness of the connecting lines is weighted based on the density of cells at that node, which is proportional to the amount of support for the trajectory. Each dot is a single cell and cell states are colored by transcriptional cell state. The same pseudotime plots are presented for (C) CD8+ TIL and (D) CD4+ TIL, again with the connecting lines weighted by cell density, but now colored by whether that cell came from a tumor sample or uninvolved/normal sample. (E) The degree and significance to which cell states co-occur with each other was computed using Spearman correlation. The matrix pits each cell state against every other transcriptomic state. Red squares indicate positive correlation, blue squares indicate negative correlation, and asterisks denote statistical significance (P < 0.05).
Figure 3.
Figure 3.. Features of multi-cohort data set are retained within subset of samples used to model the original data set.
(A) The degree to which the top genes in the tumor-infiltrating lymphocyte (TIL) cell states in the full data set (MDA1, MDA2, and PUMCH) overlap with the those in the MDA1 data set are visualized in a gene overlap matrix. Blue indicates a high degree of overlap, and beige indicates a low degree. Each cell-state has at least 70% of the top (P ≤ 0.05 and fold change ≥ 0.2) genes overlapping, except for CD4-CXCL13, which was hardly detected in the MDA1 data set. (B-E) The seven-sample MDA1 data set is represented using uniform manifold approximation and projection (UMAP) plots. The (B) CD8+ TIL and (C) CD4+ TIL states are labeled and colored using the same scheme as the larger data set, showing that co-localization of the original cell states is maintained. Colored ovals are used to indicate the position of each cell state. (D) and (E) represent the same UMAP plot for CD8 and CD4, respectively, but now colored by patient sample. The same colored ovals from (B) and (C) are used to indicate in which cell states each patient falls.
Figure 4.
Figure 4.. Single-cell T-cell receptor (TCR) sequencing reveals certain T-cell clonotypes are shared among multiple transcriptional cell states.
Circos plots are used for (A) CD8+ tumor-infiltrating lymphocytes (TIL) and (B) CD4+ TIL in order to combine the TCR sequencing data with the transcriptomic data. The outer ring constituted of gray bar graphs indicates TCR frequency, where each bar represents one TIL clonotype found in the tumor of a patient. The adjacent, middle ring is colored by the assigned transcriptomic states, where the corresponding TIL clonotype is found for that particular patient sample. When a clonotype is found in multiple transcriptomic cell states, the bar in the middle ring is comprised of several, smaller colored segments. Finally, the inner ring is colored by patient sample. Hence, one patient sample can encompass multiple clonotypes. (C) Trapezoidal segments of the CD8 Circos plot were selected and enlarged to show the detail of cell state sharing found in expanded clones, which is in contrast to that of the unexpanded clones. Upset plots for (D) CD8+ TIL and (E) CD4+ TIL show the degree to which TCR clones are shared between multiple cell states. The vertical, black bars indicate the number of times an intersection is detected. Underneath each bar, the cell states in which at least one expanded clonotype (>2 cells) is detected are symbolized by a solid, black circle. If clones are present in multiple cell states, a line is drawn between those states. If there is no sharing, only a single black dot is shown. The horizontal bars are colored by transcriptomic cell states and indicate the number of TCR clones per cell state.
Figure 5.
Figure 5.. CD8+ tumor-infiltrating lymphocytes (TIL) show a greater degree of oligoclonality than CD4+ TIL.
(A-B) The Gini index (left panel), Chao 1 index (middle pannel), and Shannon diversity index (right panel) were applied to measure clonal evenness and diversity within (A) the bulk CD4 and CD8 TIL for each patient and (B) for each cell state within the CD8 and CD4 populations for each patient. The p-values for the bulk comparisons in (A) were obtained following a paired Wilcox analysis. Only those samples with ≥5 cells detected for a cell state are displayed. (C) Pie charts showing the fraction of clonally expanded clonotypes per cell state along the top and broken down by patient underneath. The colors indicate how many times that clonotype was detected (i.e., the number of TIL with that TCR), where blue = 1, orange = 2 ≤ N < 5, red = 5 ≤ N < 10, and gray ≥ 10. Missing pie charts indicate that the cell state was not detected in that patient sample.
Figure 6.
Figure 6.. Transcriptomic and T-cell receptor (TCR) sequencing of cultured tumor-infiltrating lymphocytes (TIL) shows preferential expansion of specific TIL states.
(A) From the same samples that make up the MDA1 data set, tissue was also used to generate TIL. The scheme is shown, in which TIL grown from these samples were sent for single-cell RNA sequencing to generate transcriptomic and TCR analyses. (B) The uniform manifold approximation and projection (UMAP) projection of 40,605 single T cells from six pancreatic ductal adenocarcinoma (PDAC) TIL cultures, showing five CD8, one CD4, and one γδ T-cell cell states. Each dot is a single cell and is colored according to transcriptomic state. (C) Top differentially expressed genes for each cell state are shown. Expression is marked by a circle, where greater size indicates a greater percentage of cells expressing this gene and the color gradient indicates a higher level of expression as it moves from blue to red. (D) Sankey plot visualization shows the transcriptomic cell state in which the TCR initially started in the tissue and where it finished in the culture (fresh tissue on left and grown TIL on right). Clonotypes are classified by the cell state the majority of that clonotype is found. For each sample/graph, two plots are shown with the upper row of graphs showing all clones detected in the fresh tissue and the bottom row showing only those clones detected in both the fresh tissue and grown TIL. Total number of clones are shown in parentheses. Scatter plot for (E) CD8+ TIL and (F) CD4+ TIL comparing the relative frequency of T-cell clones in the fresh pancreatic ductal adenocarcinoma (PDAC) tissue versus the grown TIL. Each dot is a single clonotype and is colored by the transcriptomic state from the fresh TIL. Clonotypes that were not detected in both the fresh tissue and grown culture are colored gray. The diagonal line indicates a 1:1 relative frequency, where clones above the line are found at greater relative frequency in the grown than in the fresh tissue and vice versa.
Fig. 7.
Fig. 7.. Model summary of pancreatic ductal adenocarcinoma (PDAC) tumor-infiltrating lymphocyte (TIL) states initially in patient-tissue samples and following in vitro cell culture.
Based on data presented in this paper, this model depicts the TIL differentiation states in PDAC and the suggested transitional relationship between them in the tumor (left side) and following cell culture (right side).

References

    1. Siegel RL, Miller KD, Jemal A. Cancer statistics, 2019. CA Cancer J Clin 2019;69(1):7–34 doi 10.3322/caac.21551. - DOI - PubMed
    1. Ryan DP, Hong TS, Bardeesy N. Pancreatic Adenocarcinoma. New England Journal of Medicine 2014;371(11):1039–49 doi 10.1056/NEJMra1404198. - DOI - PubMed
    1. Kleeff J, Korc M, Apte M, La Vecchia C, Johnson CD, Biankin AV, et al. Pancreatic cancer. Nat Rev Dis Primers 2016;2:16022 doi 10.1038/nrdp.2016.22. - DOI - PubMed
    1. Larkin J, Chiarion-Sileni V, Gonzalez R, Grob JJ, Cowey CL, Lao CD, et al. Combined Nivolumab and Ipilimumab or Monotherapy in Untreated Melanoma. N Engl J Med 2015;373(1):23–34 doi 10.1056/NEJMoa1504030. - DOI - PMC - PubMed
    1. Antonia S, Goldberg SB, Balmanoukian A, Chaft JE, Sanborn RE, Gupta A, et al. Safety and antitumour activity of durvalumab plus tremelimumab in non-small cell lung cancer: a multicentre, phase 1b study. The Lancet Oncology 2016;17(3):299–308 doi 10.1016/s1470-2045(15)00544-6. - DOI - PMC - PubMed

Publication types

MeSH terms

Substances