. 2022 Jul 28;65(14):9918-9938.
doi: 10.1021/acs.jmedchem.2c00582. Epub 2022 Jul 18.

Design, Synthesis, and Biological Activity of New CB2 Receptor Ligands: from Orthosteric and Allosteric Modulators to Dualsteric/Bitopic Ligands

Affiliations

Design, Synthesis, and Biological Activity of New CB2 Receptor Ligands: from Orthosteric and Allosteric Modulators to Dualsteric/Bitopic Ligands

Francesca Gado et al. J Med Chem. .

Abstract

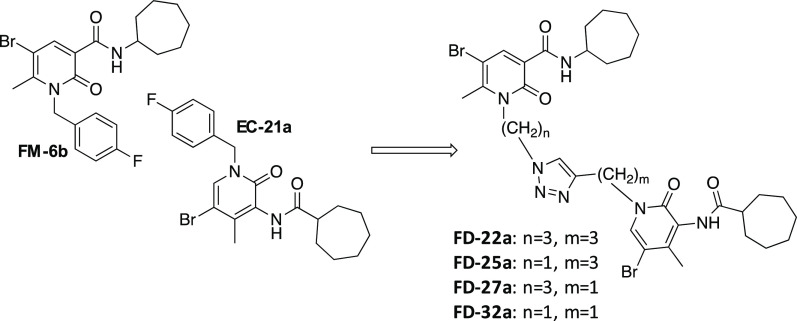
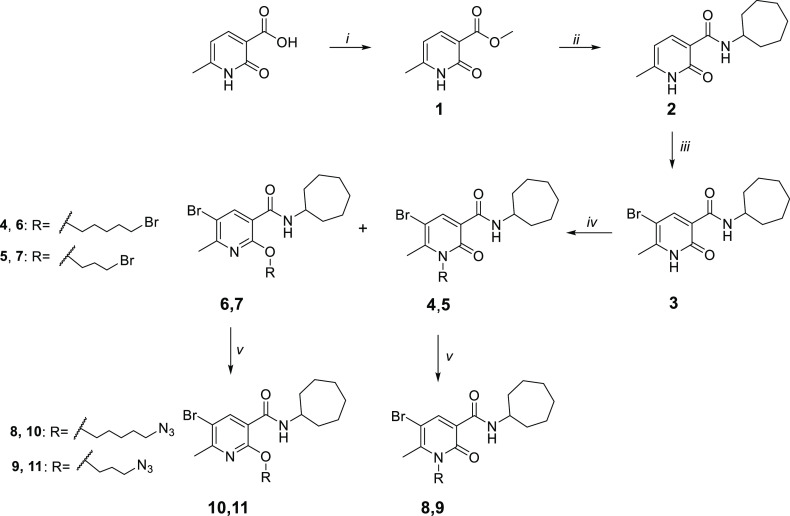
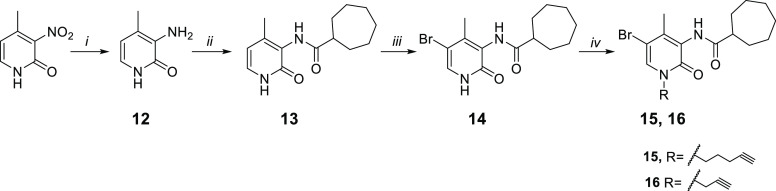
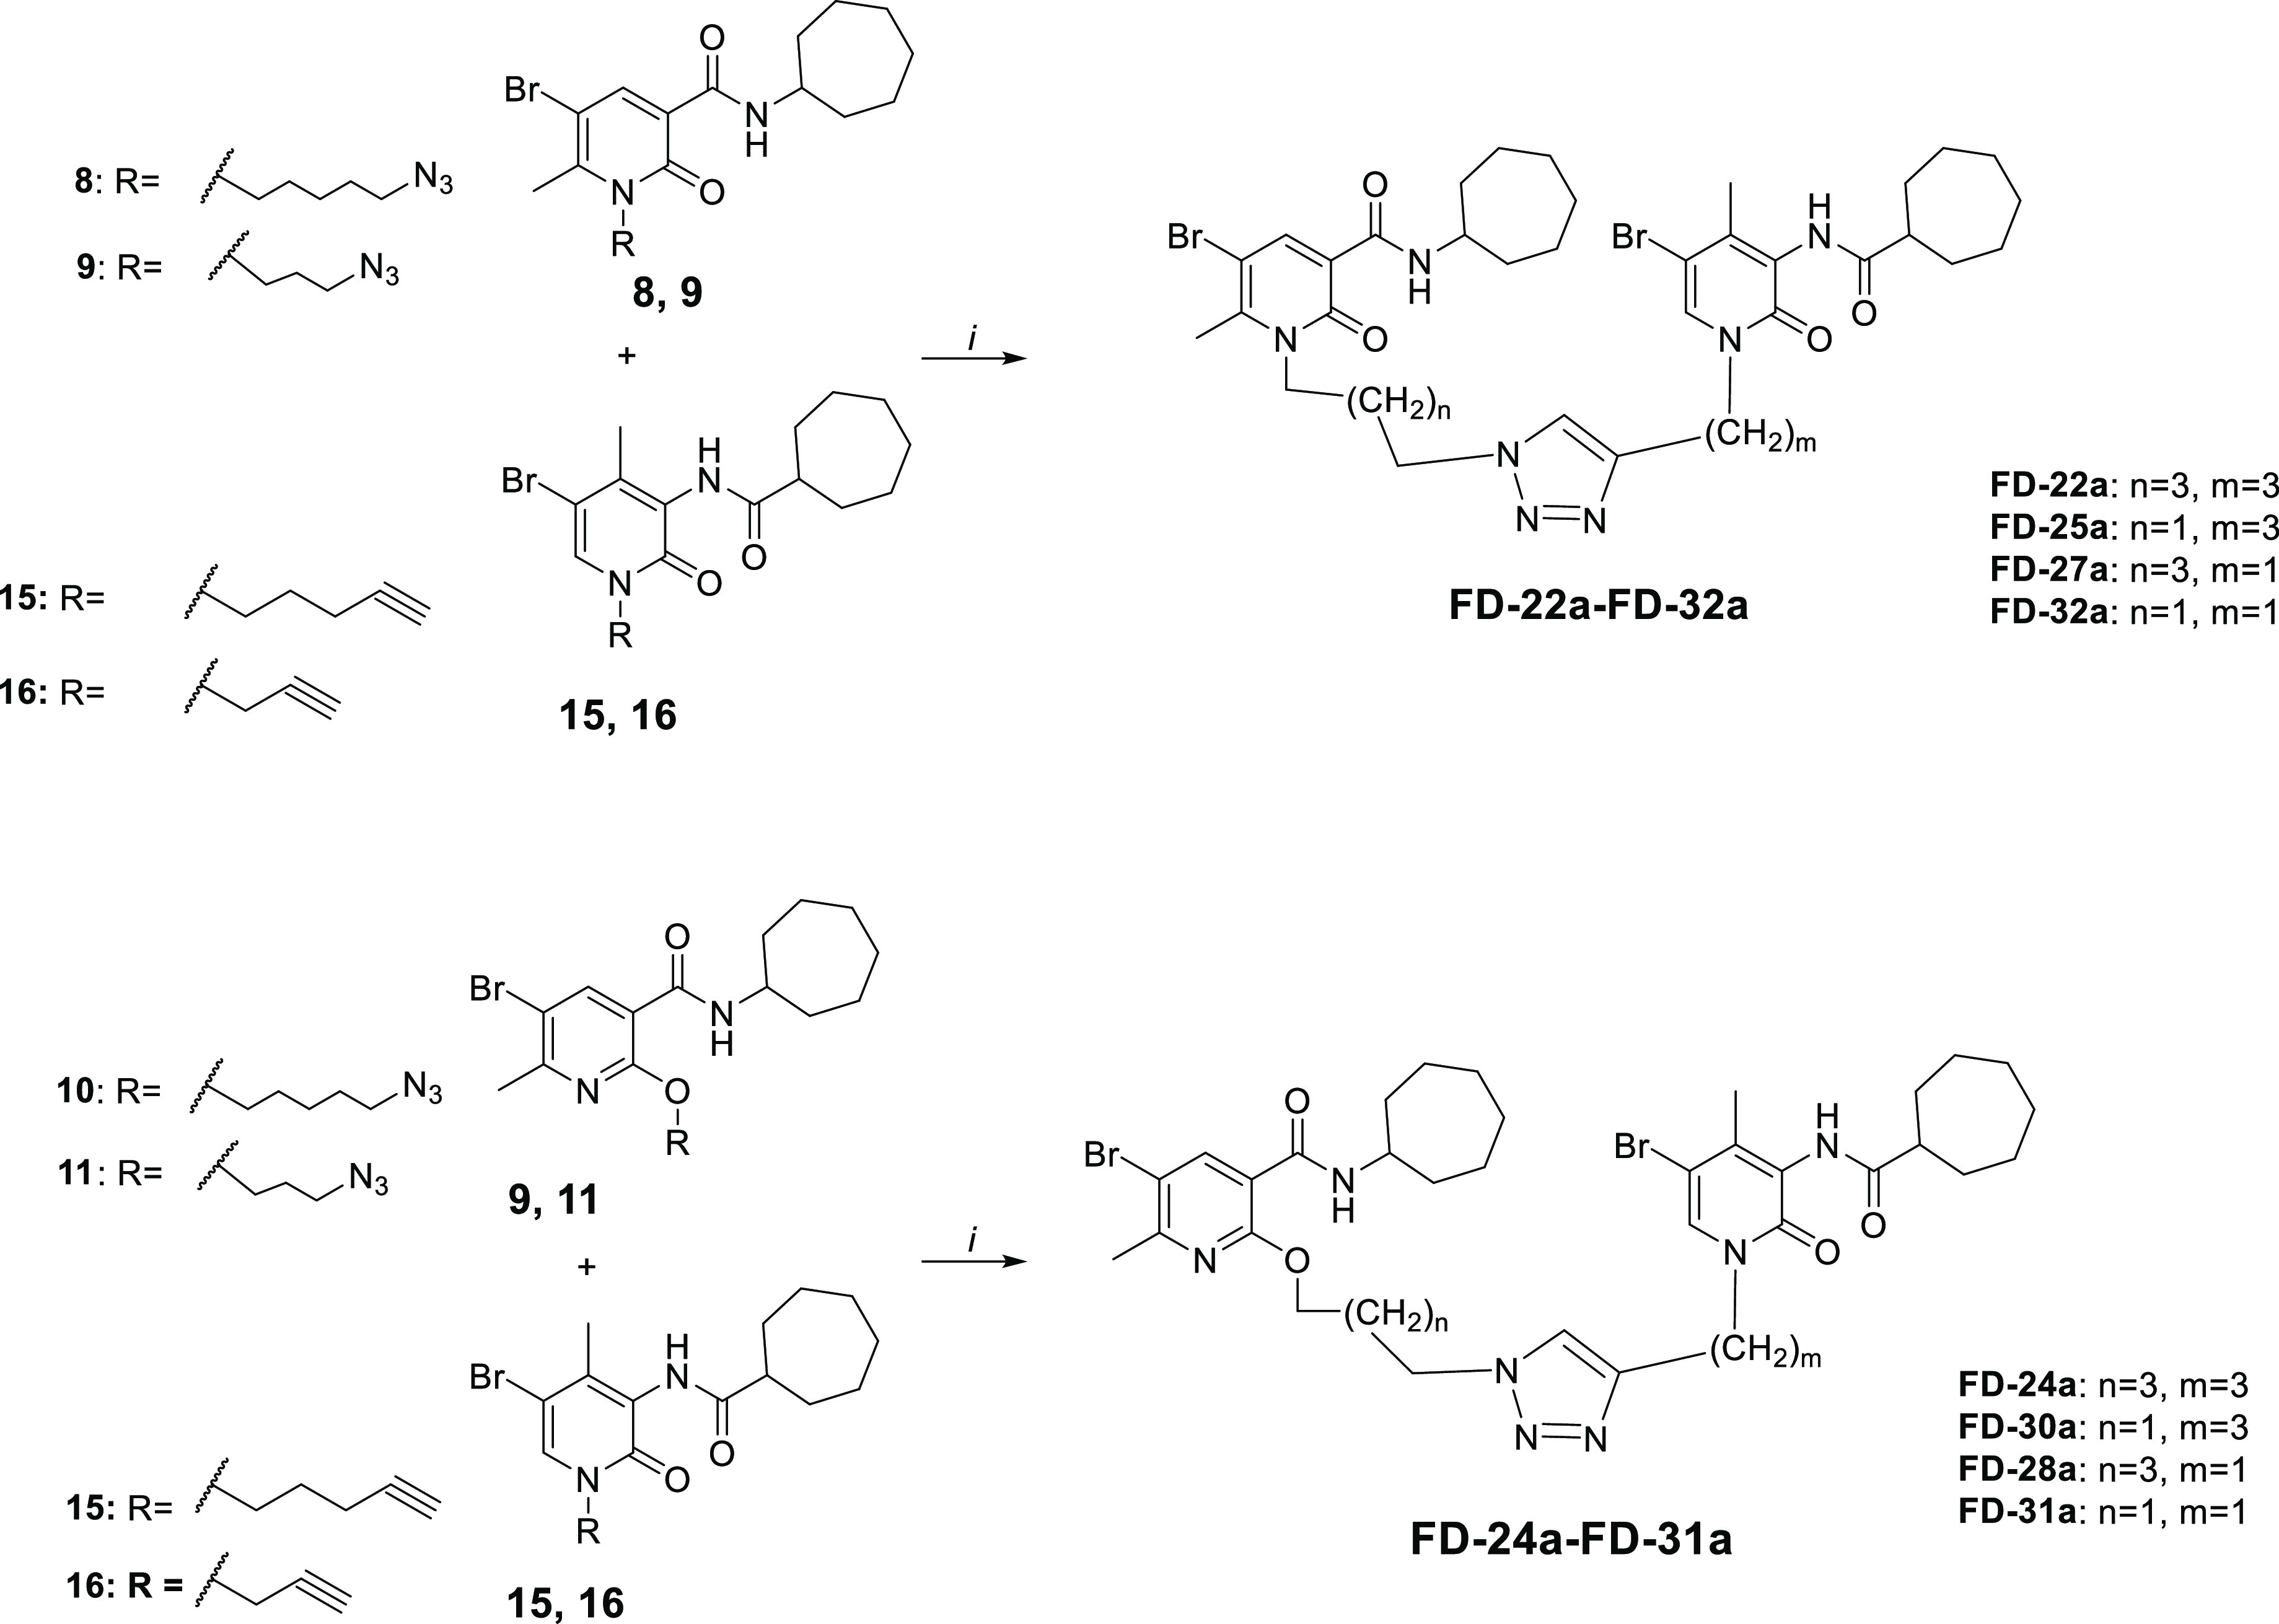
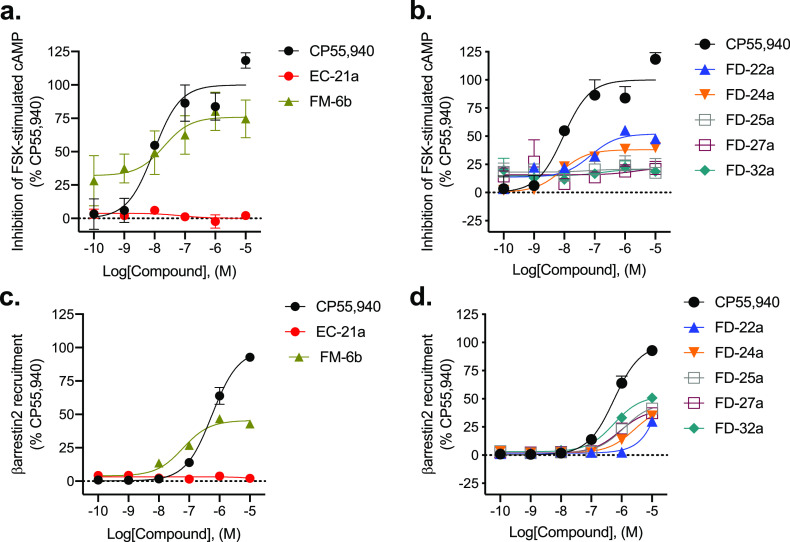
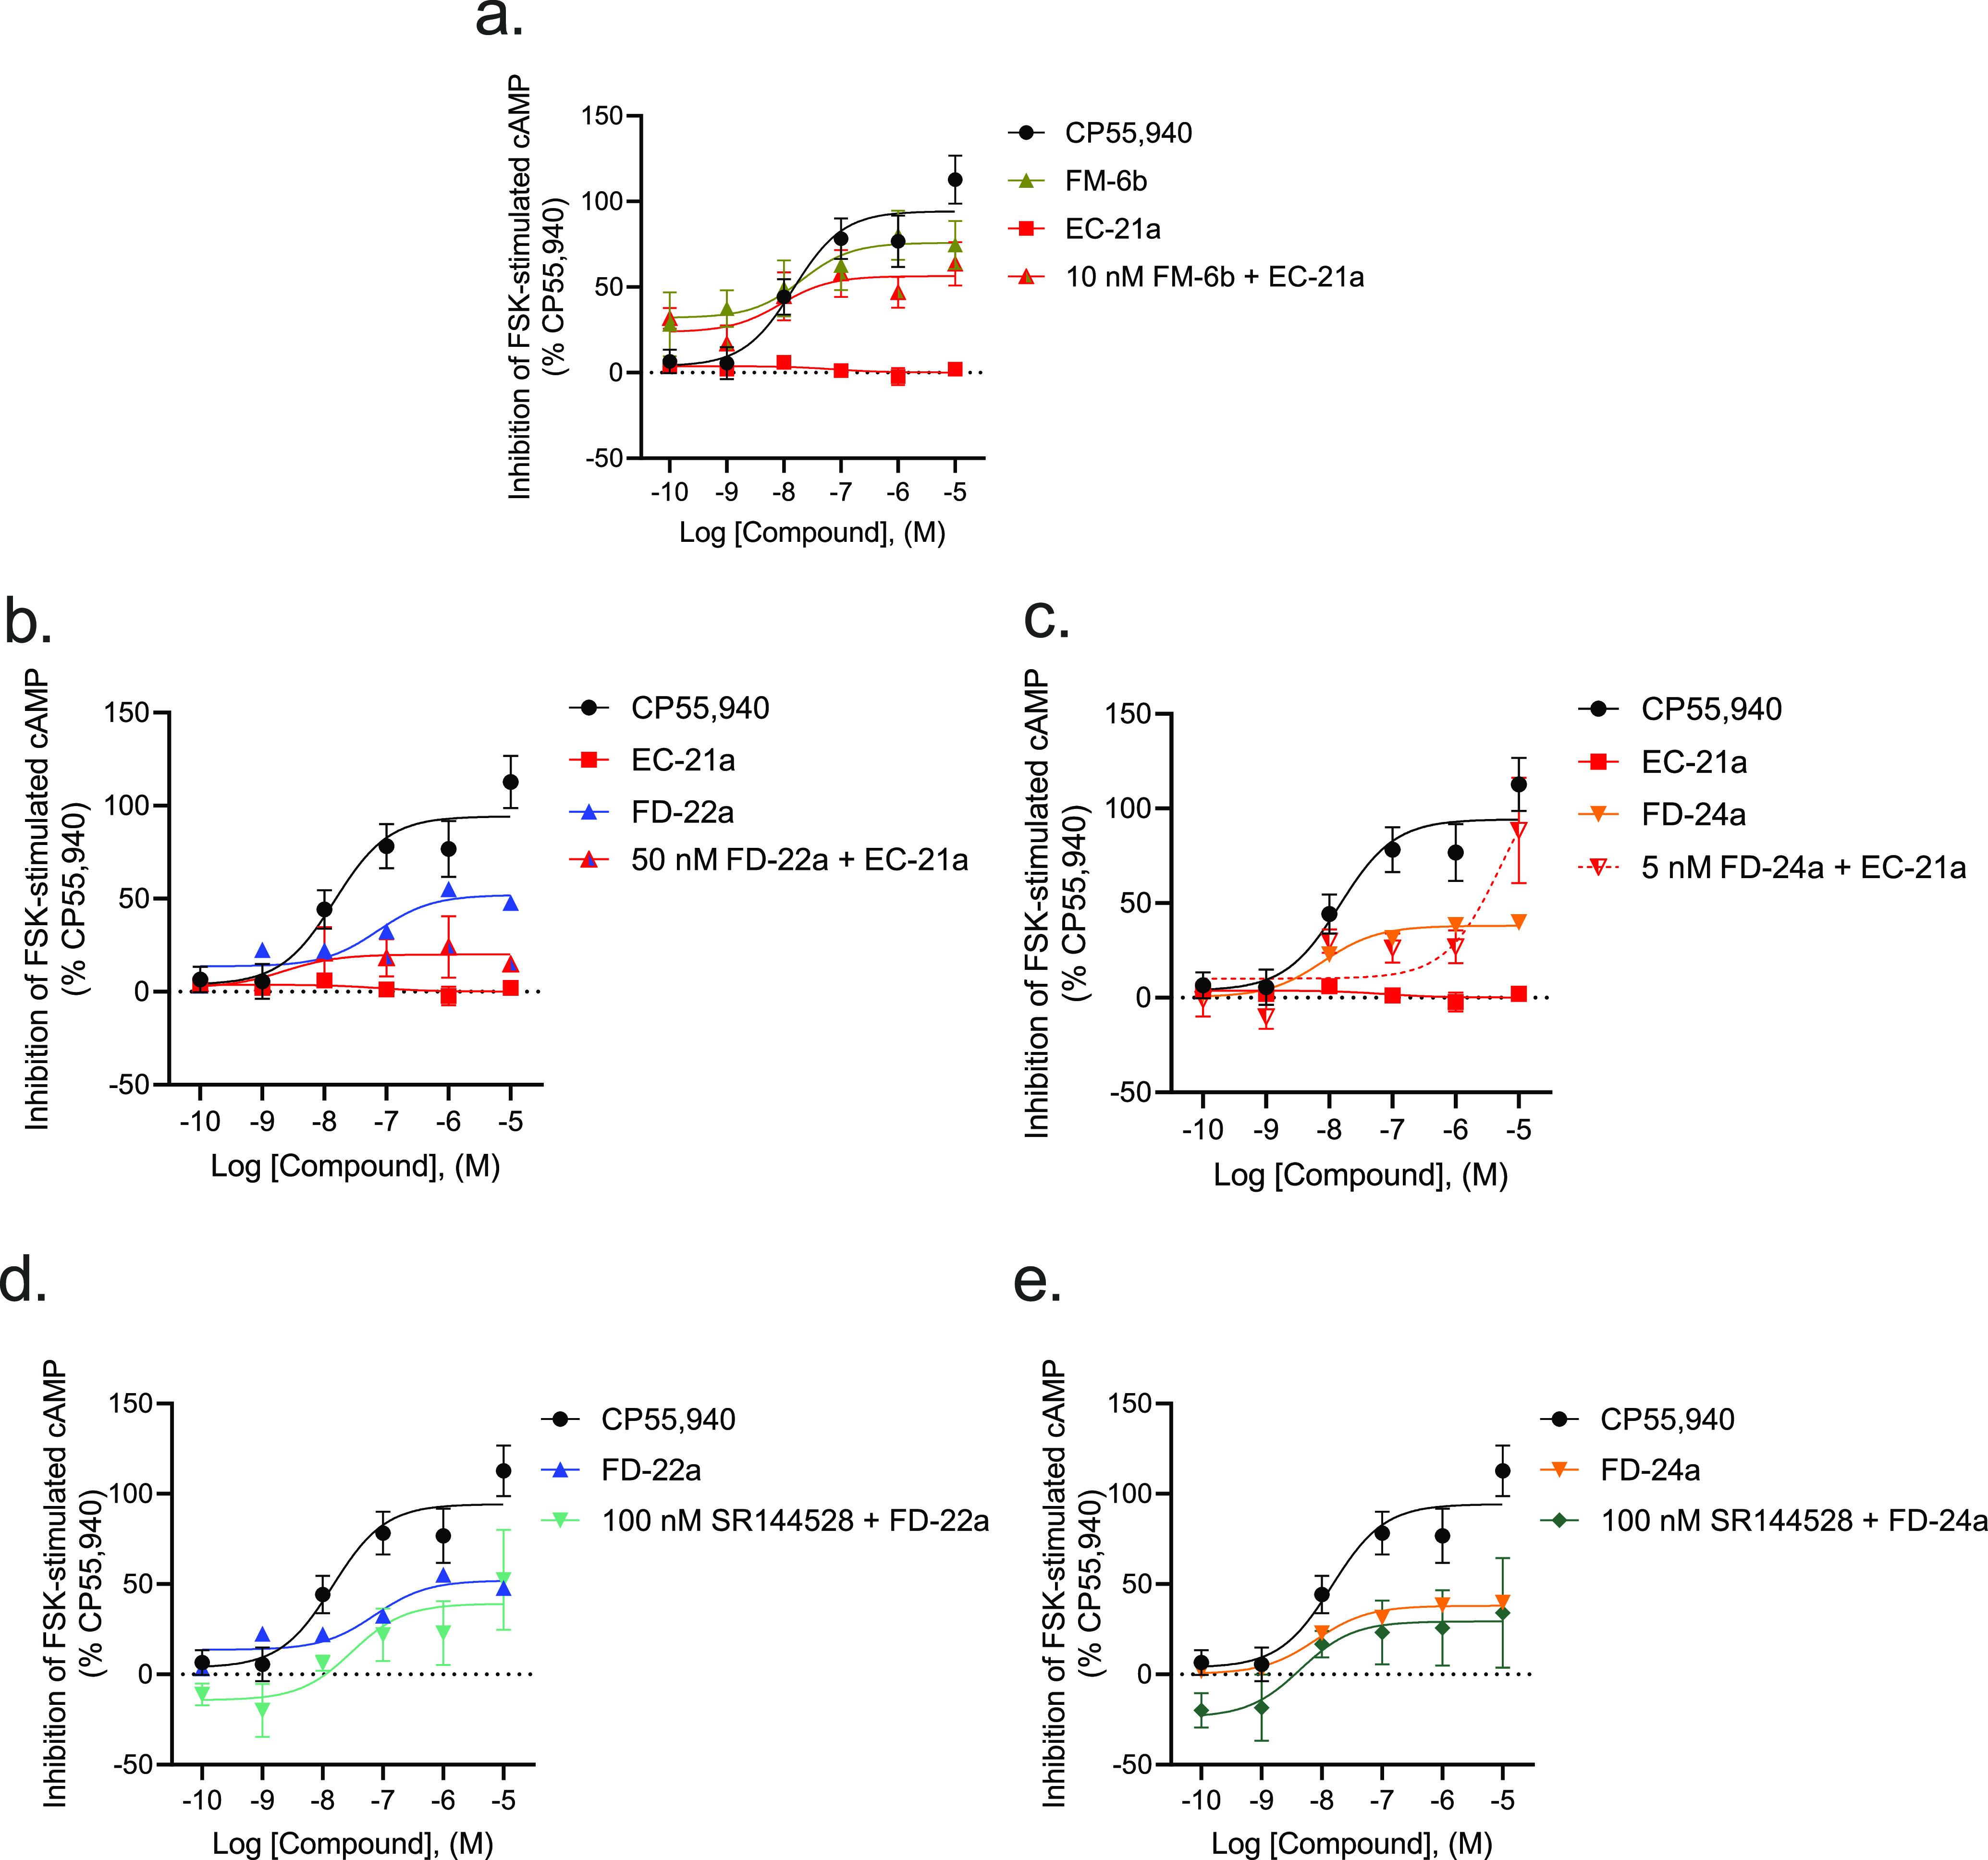
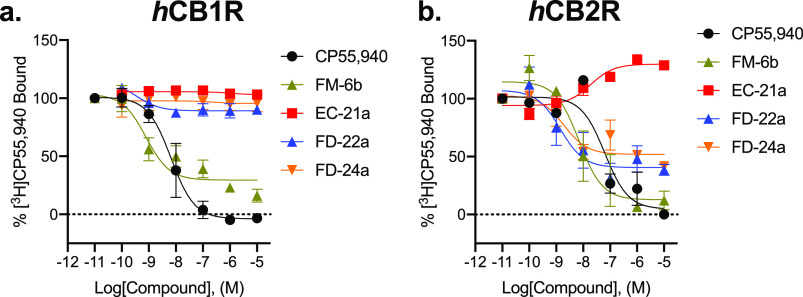
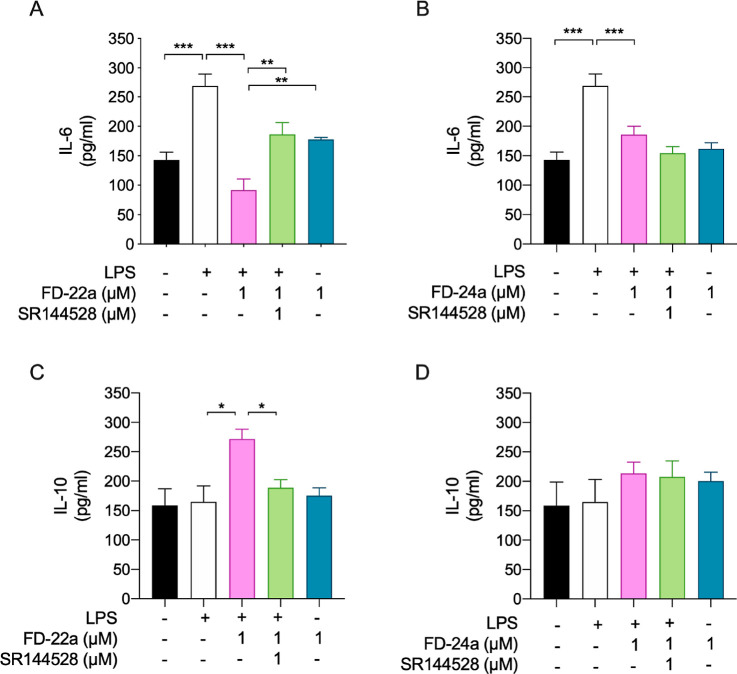
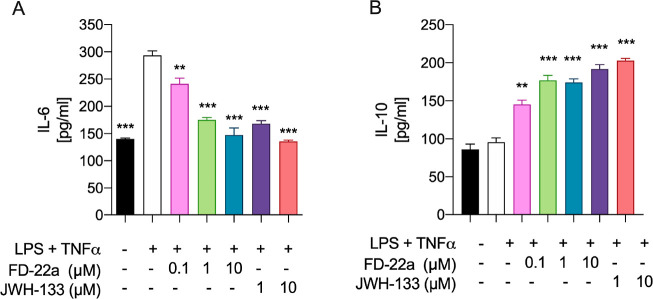
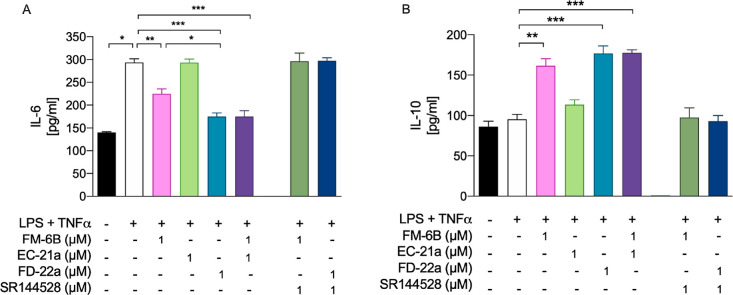
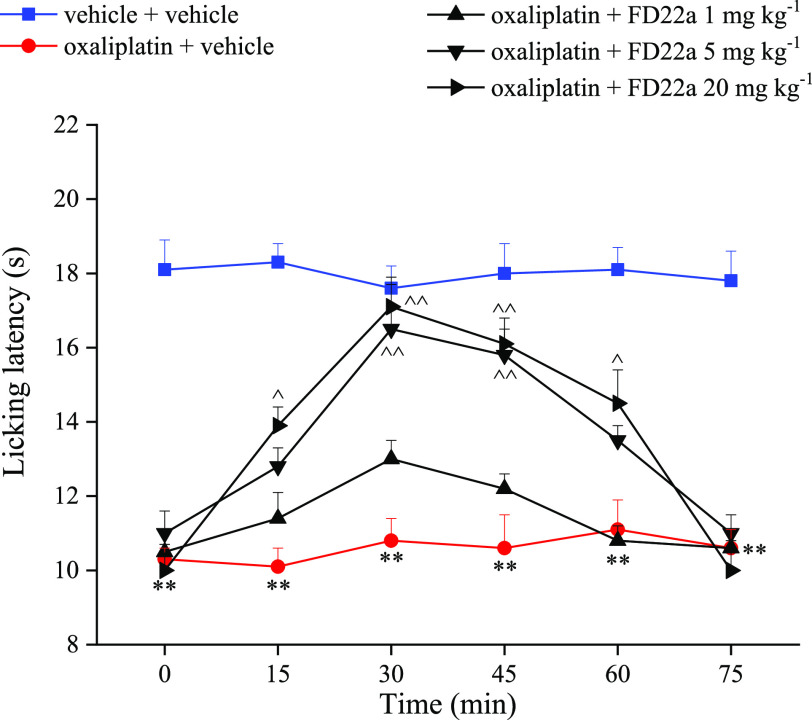
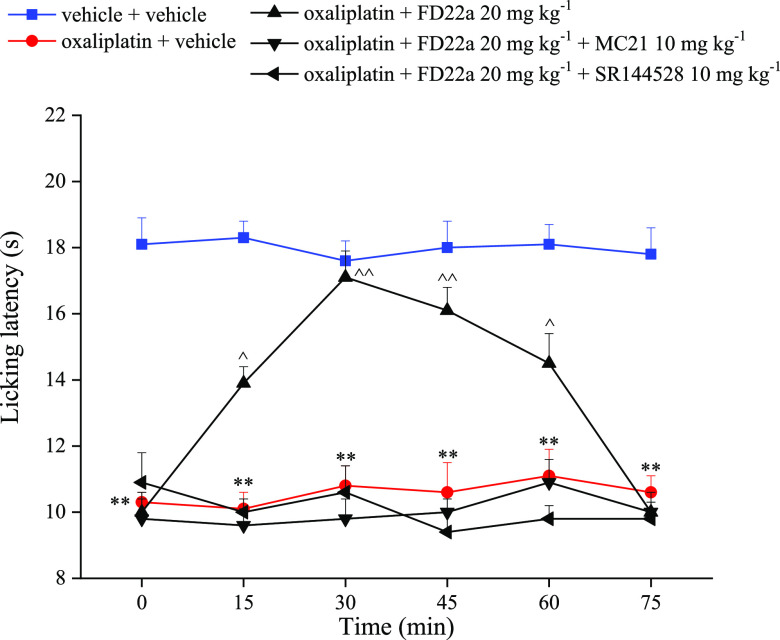
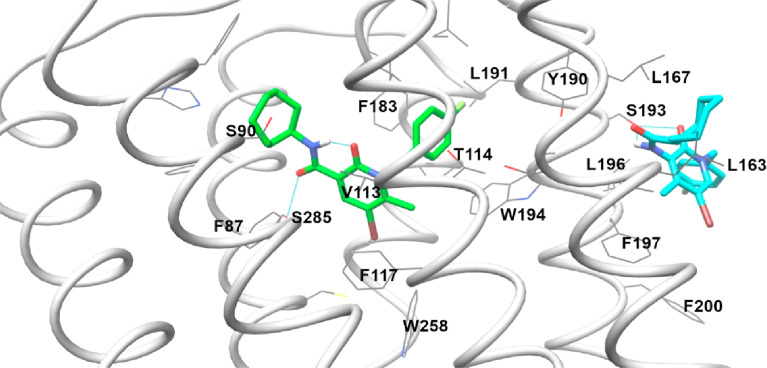
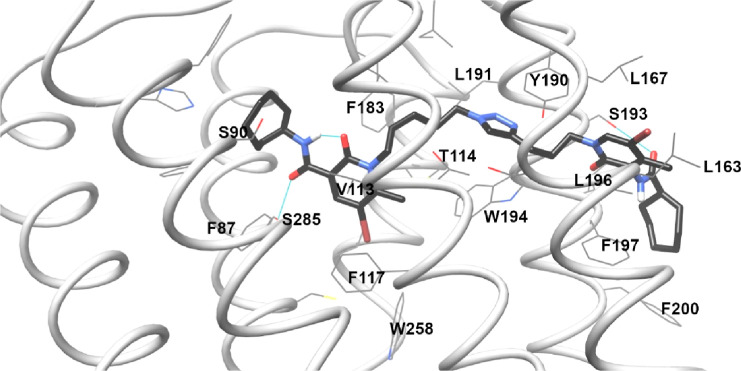
The design of dualsteric/bitopic agents as single chemical entities able to simultaneously interact with both the orthosteric and an allosteric binding site represents a novel approach in medicinal chemistry. Biased dualsteric/bitopic agents could enhance certain signaling pathways while diminishing the others that cause unwanted side effects. We have designed, synthesized, and functionally characterized the first CB2R heterobivalent bitopic ligands. In contrast to the parent orthosteric compound, our bitopic ligands selectively target CB2R versus CB1R and show a functional selectivity for the cAMP signaling pathway versus βarrestin2 recruitment. Moreover, the most promising bitopic ligand FD-22a displayed anti-inflammatory activity in a human microglial cell inflammatory model and antinociceptive activity in vivo in an experimental mouse model of neuropathic pain. Finally, computational studies clarified the binding mode of these compounds inside the CB2R, further confirming their bitopic nature.


Conflict of interest statement

The authors declare no competing financial interest.

Figures

Figure 1
Figure 1
Design of compounds FD-22a, FD-25a, FD-27a, and FD-32a.
Scheme 1
Scheme 1. Synthetic Pathway for the Synthesis of the Azido Derivatives 8-11
Reagents and conditions: (i) MeOH, H2SO4 96%, 90 °C, 24 h. (ii) cycloheptylamine, 100 °C, 24 h. (iii) Br2, CHCl3, rt, 12 h. (iv) (a) CsF, DMF, rt, 1 h (b) R-bromide, 50 °C, 12 h. (v) NaN3, DMF, 60 °C, 12 h.
Scheme 2
Scheme 2. Synthetic Pathway for the Synthesis of the Alkyne Derivatives 15 and 16
Reagents and conditions: (i) Fe, NH4Cl, H2O/EtOH 1:2, 80 °C, 3 h. (ii) (a) cycloheptanecarboxylic acid, C2O2Cl2, DMF, rt, 0.5 h (b) NEt3, DCM, DMF, rt, 24 h. (iii) Br2, CHCl3, rt, 12 h. (iv) (a) CsF, DMF, rt, 1 h (b) R-bromide, 30 °C, 12 h.
Scheme 3
Scheme 3. Synthetic Pathway for the Synthesis of Compounds FD-22a-FD-31a
Reagents and conditions: (i) CuSO4·5H2O, sodium ascorbate, DMF/H2O 4:1, 80 °C, 2 h.
Figure 2
Figure 2
CB2R-dependent inhibition of FSK-stimulated cAMP and CB2R-dependent recruitment of βarrestin2. CHO cells stably expressing hCB2R were treated with 0.10 nM–10 μM compounds for 90 min, and cAMP inhibition (a,b) or βarrestin2 recruitment (c,d) was measured. cAMP and βarrestin2 recruitment data are expressed as the % CP55,940 response. Data were fitted to a nonlinear regression (three-parameter model, GraphPad v. 9.0). Data are mean ± S.E.M. of 6 independent experiments performed in triplicate. Data from these graphs is presented in Table 1. Statistical data for these graphs are presented in Table S1.
Figure 3
Figure 3
CB2R-dependent inhibition of FSK-stimulated cAMP CHO cells stably expressing hCB2R. cAMP inhibition data are expressed as the % CP55,940 response. Cells were treated with ligands simultaneously as indicated. 10 nM FM-6b (a), 50 nM FD-22a (b), and 5 nM FD-24a (c) were chosen after the completion of preliminary experiments with compounds alone for ease of calculations to approximate the EC50 for each compound alone. Addition of 100 nM SR144528 to 0.1 nM–10 μM of FD-22a (d) or of FD-24a (e). Data were fitted to a nonlinear regression (three-parameter model, GraphPad v. 9.0). Data are mean ± S.E.M. of 3–6 independent experiments performed in triplicate. Data from these graphs is presented in Table 2. Statistical data for these graphs are presented in Table S2.
Figure 4
Figure 4
[3H]CP55, 940 binding to CB1R (a) and CB2R (b). Membranes from CHO cells stably expressing hCB1R or hCB2R were treated with 1 nM [3H]CP55,940 and 0.10 nM–10 μM compounds for 2 h. Data are expressed as %[3H]CP55,940 bound. Data were fitted to a nonlinear regression (three-parameter model, GraphPad v. 9.0). Data are mean ± S.E.M. of 3 independent experiments performed in duplicate. Data from these graphs is presented in Table 3. Statistical data for these graphs are presented in Table S3.
Figure 5
Figure 5
Ability of FD-22a (A,C) and FD-24a (B,D) to decrease the inflammatory phenotype of LPS-stimulated BV2 microglial cells by the modulation of CB2R. Bars represent the release (pg/mL) of ILs in the presence of the drugs. Data represent mean ± (bars) from n = 3 independent experiments performed in duplicate. Statistical analysis was performed by ordinary one-way ANOVA followed by Tukey’s multiple comparison test. *p < 0.05, **p < 0.01 and ***p < 0.001.
Figure 6
Figure 6
Release of inflammatory (IL-6) (A) and anti-inflammatory (IL-10) (B) interleukins induced by different concentrations of FD-22a. Data represent means ± S.E.M. from n = 3 independent experiments performed in duplicate. The selective CB2R agonist JWH133 was used as positive control. Statistical analysis was performed by ordinary one-way ANOVA followed by Tukey’s multiple comparison test. **p < 0.01 and ***p < 0.001 compared to cells treated with LPS and TNFα.
Figure 7
Figure 7
MTT assay performed with different concentrations of FD-22a. Data represent means ± S.E.M. from n = 3 independent experiments performed in triplicate. Statistical analysis was performed by ordinary one-way ANOVA followed by Tukey’s multiple comparison test.
Figure 8
Figure 8
Ability of FD-22a to decrease the inflammatory phenotype of LPS + TNFα–stimulated HMC3 by the modulation of CB2R. Bars represent the release (pg/mL) of IL-6 (A) and IL-10 (B) in the presence of the drugs at the indicated concentrations. Data represent means ± S.E.M. from n = 3 independent experiments performed in duplicate. Statistical analysis was performed by ordinary one-way ANOVA followed by Tukey’s multiple comparison test.*p < 0.05, **p < 0.01 and ***p < 0.001.
Figure 9
Figure 9
Effect of FD-22a on oxaliplatin induced neuropathic pain in mice. The response to a thermal stimulus was evaluated by the cold plate test measuring the latency (s) to pain related behaviors (lifting or licking of the paw). Mice were daily treated i.p. with oxp 2.4 mg kg–1. Tests were performed on day 15. FD-22a (1, 5, 20 mg kg–1) was p.o., and measurements were performed 15, 30, 45, 60, and 75 min after injection. Control mice were treated with vehicle. Each value represents the mean of 16 mice per group performed in 2 different experimental sets. **p < 0.01 vs vehicle + vehicle treated mice.^p < 0.05 and ^^p < 0.01 vs oxaliplatin + vehicle treated mice.
Figure 10
Figure 10
Effects of CB2 antagonism on FD-22a pain relieving efficacy. The response to a thermal stimulus was evaluated by the cold plate test measuring the latency (s) to pain-related behaviors (lifting or licking of the paw). Mice were daily treated i.p. with oxaliplatin 2.4 mg kg–1. Tests were performed on day 15. The selective CB2R antagonists MC21 and SR144528 (10 mg kg–1) were administered i.p. 15 min before FD-22a (20 mg kg–1p.o.). Measurements were performed 15, 30, 45, 60, and 75 min after the injection of FD-22a. Control mice were treated with a vehicle. Each value represents the mean of 16 mice per group performed in 2 different experimental sets. **p < 0.01 vs vehicle + vehicle treated mice ^p < 0.05 and ^^p < 0.01 vs oxaliplatin + vehicle treated mice.
Figure 11
Figure 11
Results of FM-6b (green colored) and EC-21a (cyan colored) docking in the 6PT0 structure.
Figure 12
Figure 12
Results of FD-22a docking in the 6PT0 structure. Hydrogen bonds are reported as cyan lines.

Similar articles

Cited by

References

    1. Lagerström M. C.; Schiöth H. B. Structural diversity of G protein– coupled receptors and significance for drug discovery. Nat. Rev. Drug Discovery 2008, 7, 339–357. 10.1038/nrd2518. - DOI - PubMed
    1. Stevens R. C.; Cherezov V.; Katritch V.; Abagyan R.; Kuhn P.; Rosen H.; Wüthrich K. The GPCR network: a large-scale collaboration to determine human GPCR structure and function. Nat. Rev. Drug Discovery 2013, 12, 25–34. 10.1038/nrd3859. - DOI - PMC - PubMed
    1. Overington J. P.; Al-Lazikani B.; Hopkins A. L. How many drug targets are there?. Nat. Rev. Drug Discovery 2006, 5, 993–996. 10.1038/nrd2199. - DOI - PubMed
    1. Hauser A. S.; Attwood M. M.; Rask-Andersen M.; Schiöth H. B.; Gloriam D. E. Trends in GPCR drug discovery: new agents, targets and indications. Nat. Rev. Drug Discovery 2017, 16, 829–842. 10.1038/nrd.2017.178. - DOI - PMC - PubMed
    1. Valant C.; Sexton P. M.; Christopoulos A. Orthosteric/allosteric bitopic ligands going hybrid at GPCRs. Mol. Interventions 2009, 9, 125–135. 10.1124/mi.9.3.6. - DOI - PubMed

Publication types