. 2022 Nov;20(11):2558-2566.e5.
doi: 10.1016/j.cgh.2022.06.028. Epub 2022 Jul 16.

Humoral and Cellular Immune Response After Third and Fourth SARS-CoV-2 mRNA Vaccination in Liver Transplant Recipients

Affiliations

Humoral and Cellular Immune Response After Third and Fourth SARS-CoV-2 mRNA Vaccination in Liver Transplant Recipients

Aenne Harberts et al. Clin Gastroenterol Hepatol. 2022 Nov.

Abstract

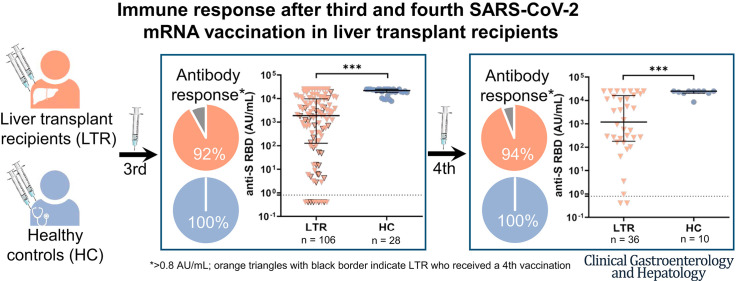
Background & aims: Liver transplant recipients (LTRs) show a decreased immune response after 2 severe acute respiratory syndrome coronavirus type 2 (SARS-CoV-2) vaccinations compared with healthy controls (HCs). Here, we investigated the immunogenicity of additional vaccinations.

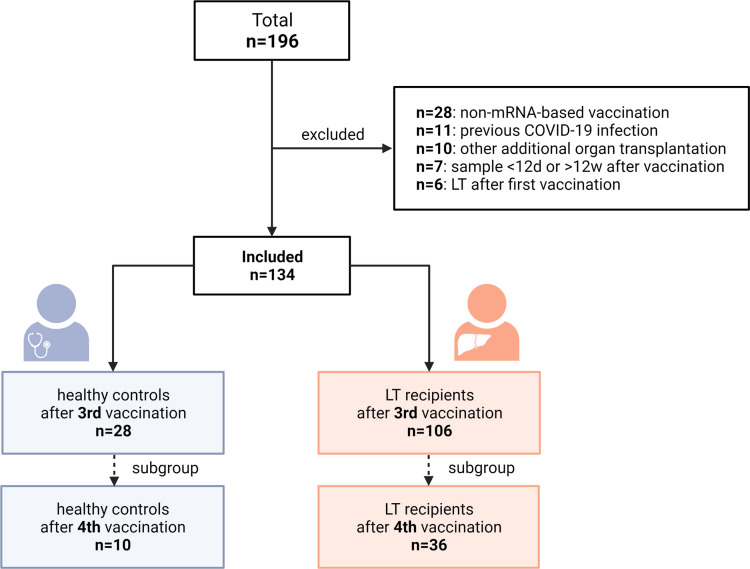
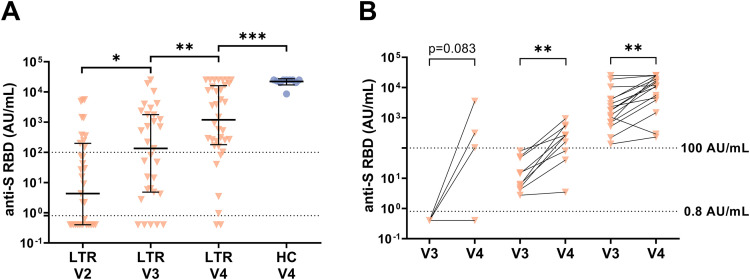
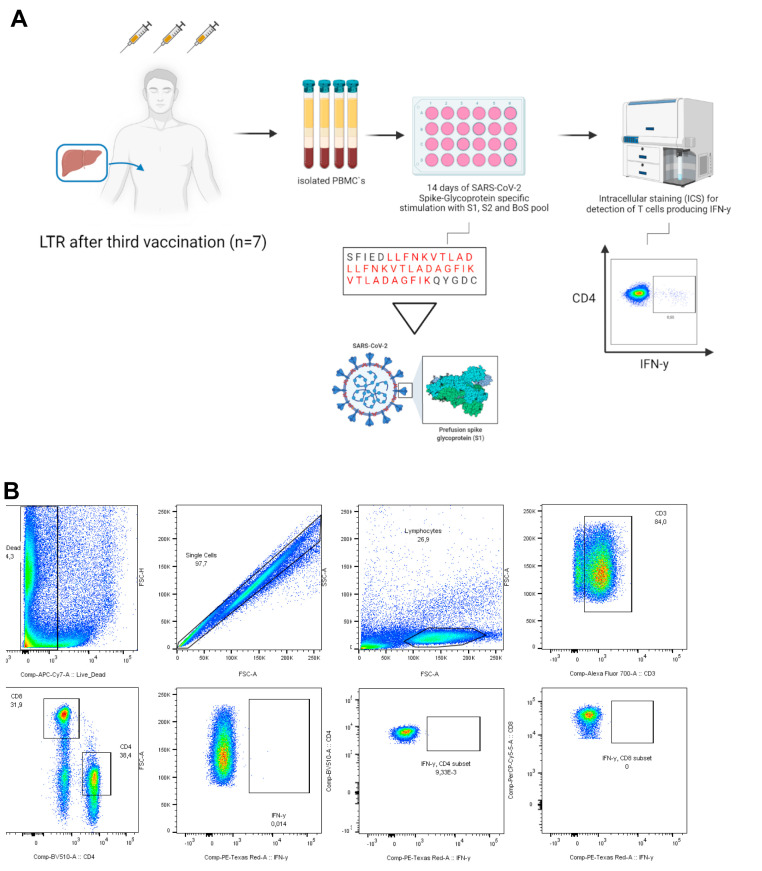
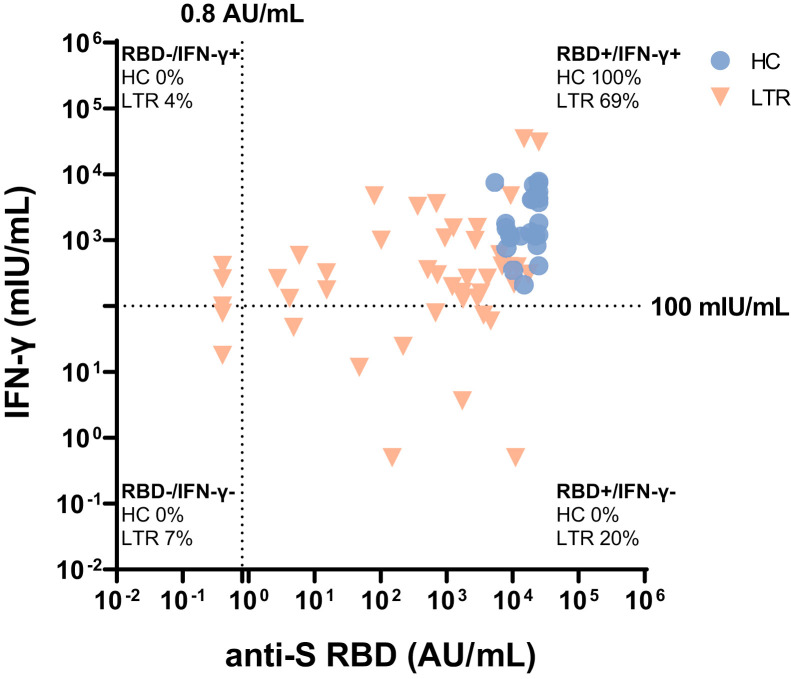
Methods: In this prospective study, humoral (anti-SARS-CoV-2 receptor-binding domain [anti-S RBD]) and cellular (interferon-gamma release assay) immune responses were determined after mRNA-based SARS-CoV-2 vaccination in 106 LTRs after a third vaccination and in 36 LTRs after a fourth vaccination. Patients with anti-S RBD antibody levels >0.8 arbitrary unit (AU)/mL after vaccination were defined as responders.

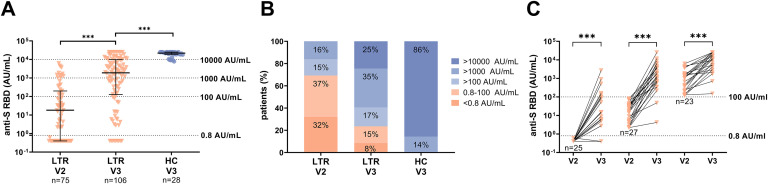
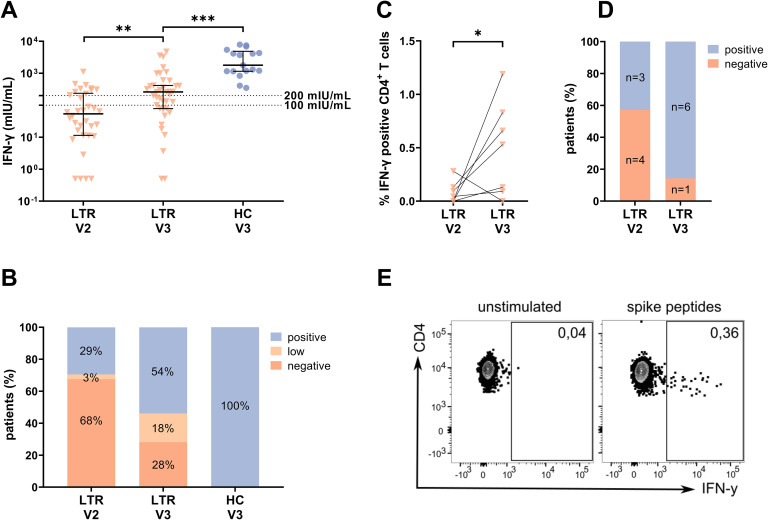
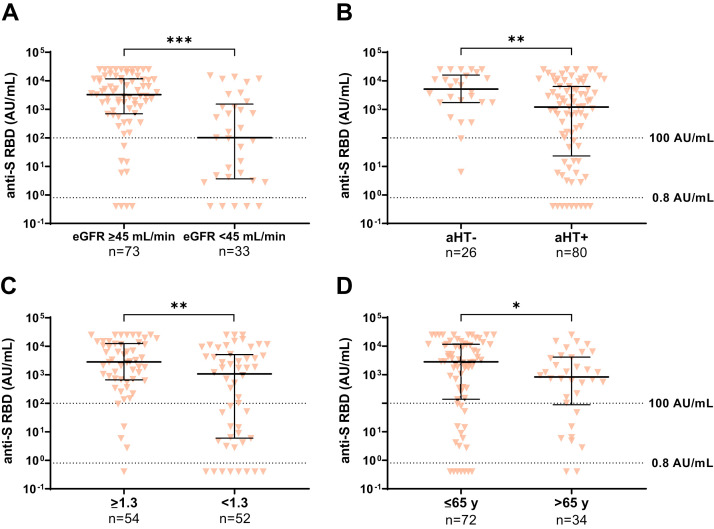
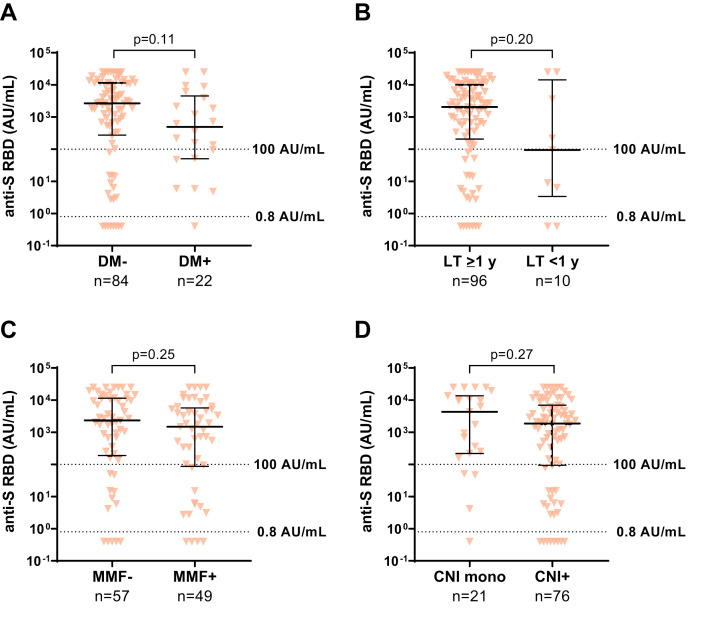
Results: After 3 vaccinations, 92% (97/106) of LTRs compared with 100% (28/28) of HCs were responders. However, the antibody titer of LTRs was lower compared with HCs (1891.0 vs 21,857.0 AU/mL; P < .001). Between a second and third vaccination (n = 75), the median antibody level increased 67-fold in LTRs. In patients seronegative after 2 vaccinations, a third dose induced seroconversion in 76% (19/25), whereas all HCs were already seropositive after 2 vaccinations. A spike-specific T-cell response was detected in 72% (28/39) after a third vaccination compared with 32% (11/34) after a second vaccination. Independent risk factors for a low antibody response (anti-S RBD <100 AU/mL) were first vaccination within the first year after liver transplant (odds ratio [OR], 8.00; P = .023), estimated glomular filtration rate <45 mL/min (OR, 4.72; P = .006), and low lymphocyte counts (OR, 5.02; P = .008). A fourth vaccination induced a 9-fold increase in the median antibody level and seroconversion in 60% (3/5) of previous non-responders.

Conclusions: A third and fourth SARS-CoV-2 vaccination effectively increases the humoral and cellular immune response of LTRs, but to a lesser extent than in HCs. A fourth vaccination should be generally considered in LTRs.

Keywords: COVID-19; Immunosuppression; Liver Transplant Recipients; T Cells; Third and Fourth SARS-CoV-2 Vaccination.


Figures

None
Graphical abstract
Figure 1
Figure 1
Flowchart of the study design.
Figure 2
Figure 2
Humoral immune response after a second (V2) and third (V3) SARS-CoV-2 vaccination in LTRs (orange descending triangles) and HCs (blue dots). A, Anti-S RBD (AU/mL) levels. B, The bar graphs indicate the proportions of negative (<0.8 AU/mL), low positive (<100 AU/mL), positive (>100 AU/mL), high (>1000 AU/mL), and very high response (>10000 AU/mL). C, Humoral response after a third vaccination depending on the humoral response level after a second vaccination (<0.8, 0.8‒100, >100 AU/mL) in a subgroup of 75 LTRs. Statistical analysis was performed by the Mann-Whitney test (∗P < .05; ∗∗P < .01; ∗∗∗P < .001). Solid horizontal lines indicate medians and interquartile; dotted horizontal lines indicate cutoff values for no response, low positive, positive, high, and very high response.
Figure 3
Figure 3
T-cell response using IGRA (A‒B) and in vitro (C‒E) assay after a third vaccination. A, IFN-γ level (mIU/mL) of LTRs and HCs. Solid horizontal lines indicate medians and interquartile ranges; dotted horizontal lines indicate cutoff values for no response (<100 mIU/mL), low positive (100‒200 mIU/mL), and positive (>200 mIU/mL). B, The bar graphs indicate the proportions of negative (<100 mIU/mL), low positive (100‒200 mIU/mL), and positive (>200 mIU/mL). C, Percentage of IFN-γ+ cells of all CD4+ T cells before and after a third vaccination. D, Proportions of negative and positive cellular response before and after third vaccination detected following spike-specific T-cell expansion. E, Representative fluorescence activated cell sorting plots for C. Statistical analysis was performed by Mann-Whitney test (∗P < .05; ∗∗P < .01; ∗∗∗P < .001).
Figure 4
Figure 4
Humoral immune response in LTRs and HCs after fourth vaccination (V4). A, Anti-S RBD levels (AU/mL). B, Humoral response after a fourth vaccination depending on the humoral response level after a third vaccination (<0.8, 0.8‒100, >100 AU/mL). Solid horizontal lines indicate medians and interquartile ranges; dotted horizontal lines indicate cutoff values for no response (<0.8 AU/mL), low positive (0.8‒100 AU/mL), and positive (>100 AU/mL). Statistical analysis was performed by the Mann-Whitney test (∗P < .05; ∗∗P < .01; ∗∗∗P < .001).
Supplementary Figure 1
A, Methods and gating strategy of the in vitro T cell assay. B, To further evaluate T-cell response, in vitro clonal T-cell expansion was induced by stimulation a pool of 12 previously determined, highly immunogenic 15-mer peptides stemming from the SARS-CoV-2 spike protein (Supplementary Table 2) and anti-CD28/anti-CD49d antibodies (BD Bioscience, Franklin Lakes, NJ), 50 U/mL rIL-2 (Miltenyi Biotec, Bergisch-Gladbach, Germany) for 14 days. The pre-cultured cells were restimulated with the peptides (10 μg/mL) for 16 hours at 37 °C and 5% CO2. After 1 hour, Brefeldin A (5 μg/mL) was added to inhibit cytokine secretion. The cells were stained with Zombie NIR fixable viability dye (BioLegend, San Diego, CA) and the following fluorochrome-conjugated monoclonal antibodies cocktail: anti-CD3, clone UCHT1 (AlexaFluor700, BioLegend), anti-CD4, clone SK3 (BV510, BioLegend), anti-CD8, clone RPA-T8 (PerCP-Cy5.5, BioLegend), anti-CD14, clone 63D3 (APC-Cy7, BioLegend) and anti-CD19, clone HIB19 (APC-Cy7, BioLegend). For intracellular staining of IFN-γ (clone 4S.B3, PE-Dazzle594, BioLegend), cells were fixated and permeabilized using the Foxp3 transcription factor staining buffer set (eBioscience, Thermo Fisher Scientific, Waltham, MA). Cells were acquired on a BD fluorescence activated cell sorting Canto II or LSRFortessa II cytometer (BD Biosciences), and FlowJo version 10.8.0 (BD Biosciences) or FACSDiva V8 was used for the flow cytometric analysis.
Supplementary Figure 2
Adverse events in LTRs after third and fourth SARS-CoV-2 vaccinations.
Supplementary Figure 3
Risk factors for a low humoral response after third SARS-CoV-2 vaccination. Anti-S RBD (AU/mL) after the third vaccination in LTRs. A, eGFR <45 mL/min vs ≥45 mL/min. B, Normal blood pressure vs aHT. C, Lymphocyte count ≥1.3/nL vs <1.3/nL. D, Age groups ≤65 and >65 years. Statistical analysis was performed by the Mann-Whitney test (∗P < .05; ∗∗P < .01; ∗∗∗P < .001). Solid horizontal lines indicate medians and interquartile ranges; dotted horizontal lines indicate cutoff values for no response (<0.8 AU/mL), low positive (0.8‒100 AU/mL), and positive (>100 AU/mL).
Supplementary Figure 4
Risk factors with no significance for a low humoral response after third SARS-CoV-2 vaccination. Anti-S RBD (AU/mL) after the third vaccination in LTRs. A, No diabetes mellitus vs diabetes mellitus. B, First vaccination ≥1 year after LT vs first vaccination within the 1 year after LT. C, Immunosuppression without MMF vs including MMF. D, Immunosuppression with CNI monotherapy vs CNI plus any other immunosuppressive medication. Statistical analysis was performed by the Mann-Whitney test. Solid horizontal lines indicate medians and interquartile ranges; dotted horizontal lines indicate cutoff values for no response (<0.8 AU/mL), low positive (0.8‒100 AU/mL), and positive (>100 AU/mL). DM, Diabetes mellitus.
Supplementary Figure 5
Correlation between humoral and T-cell immune response after third vaccination. Correlation between humoral and T-cell immune response for LTR (red descending triangles) and healthy controls (blue dots) after third vaccination. Humoral response measured with anti-S RBD (AU/mL); T-cell response measured with IFN-γ release (mIU/mL). Dotted lines indicate cutoff values. Percentages indicate proportions of values for every patient group.

References

    1. Webb G.J., Marjot T., Cook J.A., et al. Outcomes following SARS-CoV-2 infection in liver transplant recipients: an international registry study. Lancet Gastroenterol Hepatol. 2020;5:1008–1016. - PMC - PubMed
    1. John B.V., Deng Y., Khakoo N.S., et al. COVID-19 vaccination is associated with reduced SARS CoV2 infection and death in liver transplant recipients. Gastroenterology. 2022;162:645–647.e2. - PMC - PubMed
    1. Ruether D.F., Schaub G.M., Duengelhoef P.M., et al. SARS-CoV2-specific humoral and T-cell immune response after second vaccination in liver cirrhosis and transplant patients. Clin Gastroenterol Hepatol. 2022;20:162–172.e9. - PMC - PubMed
    1. Rabinowich L., Grupper A., Baruch R., et al. Low immunogenicity to SARS-CoV-2 vaccination among liver transplant recipients. J Hepatol. 2021;75:435–438. - PMC - PubMed
    1. Hoffmann M., Krüger N., Schulz S., et al. The Omicron variant is highly resistant against antibody-mediated neutralization: implications for control of the COVID-19 pandemic. Cell. 2022;185:447–456.e11. - PMC - PubMed

Publication types