. 2022 Jul 18;24(1):52.
doi: 10.1186/s13058-022-01547-7.

Combinatorial targeting of a chromatin complex comprising Dot1L, menin and the tyrosine kinase BAZ1B reveals a new therapeutic vulnerability of endocrine therapy-resistant breast cancer

Affiliations

Combinatorial targeting of a chromatin complex comprising Dot1L, menin and the tyrosine kinase BAZ1B reveals a new therapeutic vulnerability of endocrine therapy-resistant breast cancer

Annamaria Salvati et al. Breast Cancer Res. .

Abstract

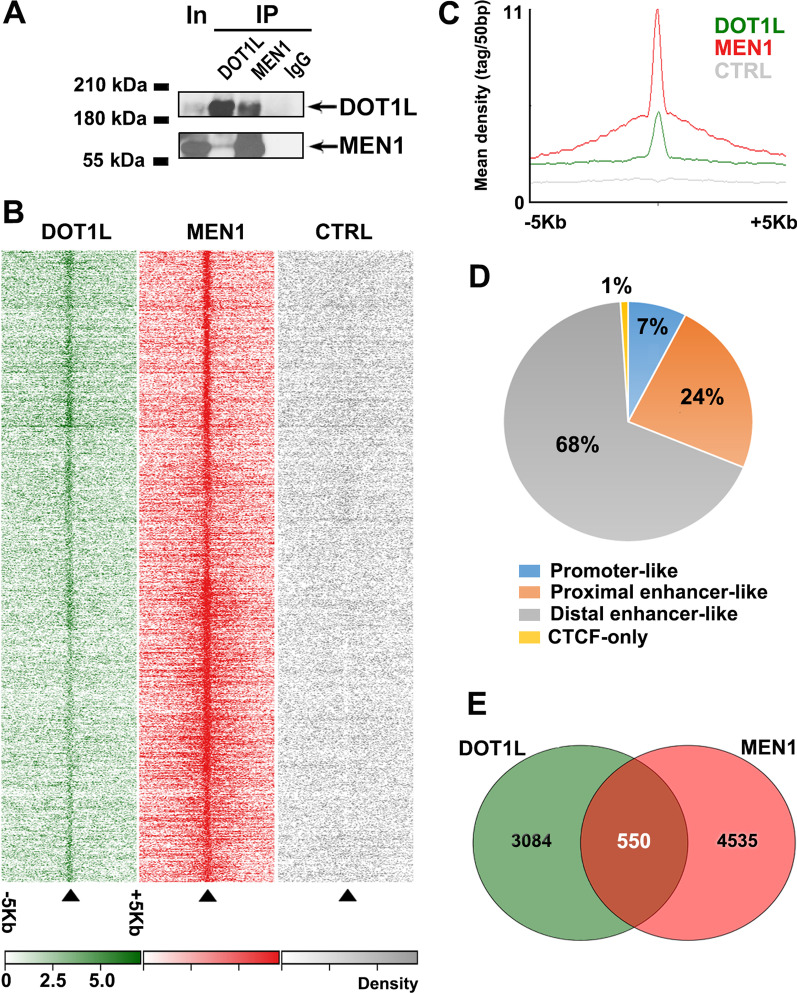
Background: Targeting vulnerabilities of cancer cells by inhibiting key regulators of cell proliferation or survival represents a promising way to overcome resistance to current therapies. In breast cancer (BC), resistance to endocrine therapy results from constitutively active or aberrant estrogen receptor alpha (ERα) signaling to the genome. Targeting components of the ERα pathway in these tumors represents, therefore, a rational way toward effective new treatments. Interaction proteomics identified several proteins associated with ERα in BC cells, including epigenetic complexes controlling gene transcription comprising the scaffold protein menin and the histone methyltransferase Dot1L.

Methods: We combined chromatin immunoprecipitation, transcriptome sequencing, siRNA-mediated gene knockdown (kd), pharmacological inhibition coupled to cellular and functional assays and interaction proteomics in antiestrogen (AE)-sensitive and AE-resistant human BC cell models to: map menin and Dot1L chromatin localization, search for their common and specific target genes, measure the effects of single or combinatorial knockdown or pharmacological inhibition of these proteins on cell proliferation and survival, and characterize their nuclear interactomes.

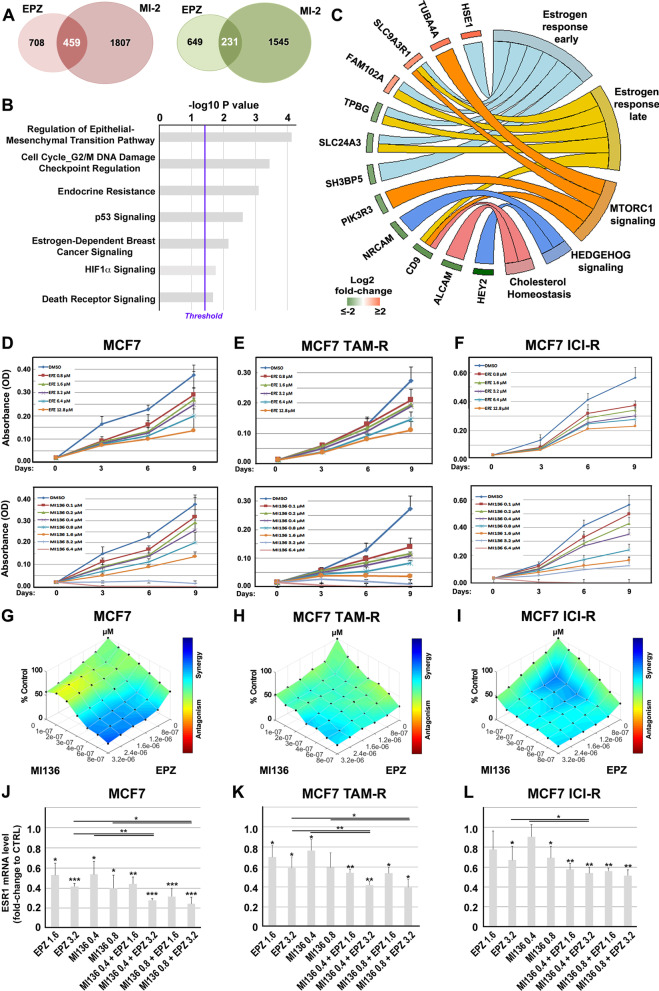
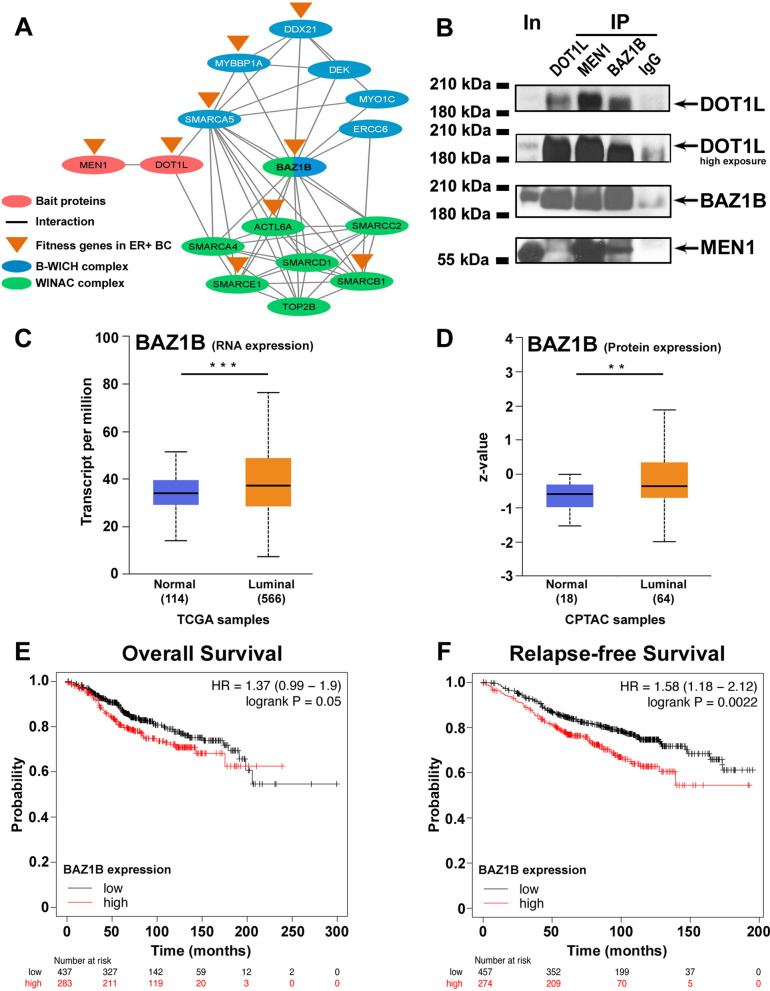
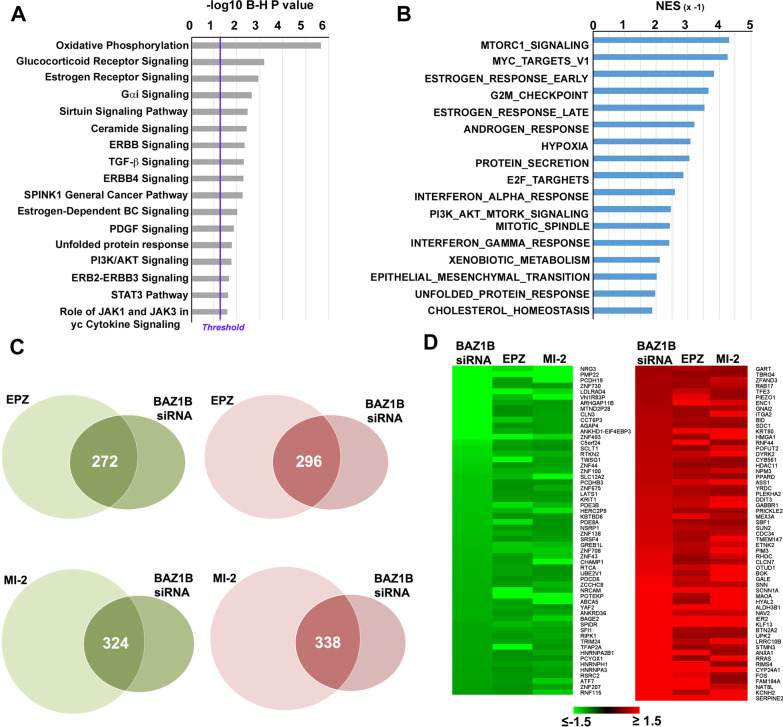
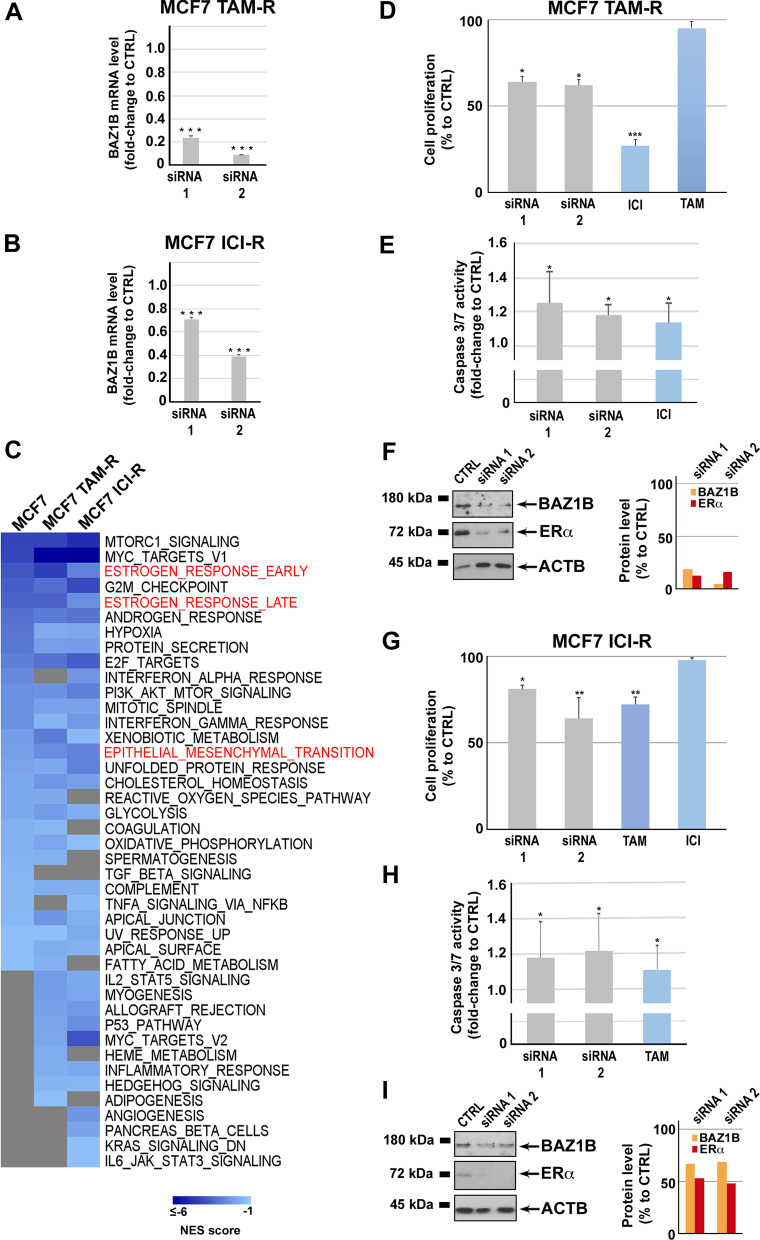
Results: Dot1L and menin associate in MCF-7 cells chromatin, where they co-localize in a significant fraction of sites, resulting in co-regulation of genes involved, among others, in estrogen, p53, HIF1α and death receptor signaling, regulation of cell cycle and epithelial-to-mesenchymal transition. Specific inhibitors of the two factors synergize with each other for inhibition of cell proliferation of AE (tamoxifen or fulvestrant)-sensitive and AE-resistant BC cells. Menin and Dot1L interactomes share a sizeable fraction of their nuclear partners, the majority being known BC fitness genes. Interestingly, these include B-WICH and WINAC complexes that share BAZ1B, a bromodomain protein comprising a tyrosine-protein kinase domain playing a central role in chromatin remodeling and transcriptional regulation. BAZ1B kd caused significant inhibition of ERα expression, proliferation and transcriptome changes resulting in inhibition of estrogen, myc, mTOR, PI3K and AKT signaling and metabolic pathways in AE-sensitive and AE-resistant BC cells.

Conclusions: Identification of a functional interplay between ERα, Dot1L, menin and BAZ1B and the significant effects of their co-inhibition on cell proliferation and survival in cell models of endocrine therapy-resistant BC reveal a new therapeutic vulnerability of these aggressive diseases.

Keywords: BAZ1B; Breast cancer; Dot1L; Endocrine therapy resistance; Estrogen signaling; Menin.


Conflict of interest statement

The authors declare no competing interests.

Figures

Fig. 1
Fig. 1
Dot1L and menin binding to BC cells chromatin. A ChIP–western blot showing Dot1L and MEN1 co-recruitment on chromatin. IgG was used as negative control. B Heatmap showing read density within 10 kb regions centered on Dot1L and menin binding sites in MCF-7 cells. Control (CTRL) was obtained using nonspecific Abs. C Mean read density within and around Dot1L and menin co-localized binding sites. D Pie chart showing the distribution of Dot1L + menin shared binding sites within the genome. E Venn diagram showing the number of expressed transcripts harboring specific and common Dot1L and menin binding sites
Fig. 2
Fig. 2
Impact of Dot1L and menin blockade on gene expression and cell functions in BC cells. A Venn diagram showing the number of specific and common transcripts up-regulated (red) and down-regulated (green) following EPZ or MI-2 treatment. B Bar charts from KEGG functional enrichment analysis showing statistically significant common pathways deregulated upon MCF-7 cell treatment with EPZ and MI-2. C Circos plot showing common up-regulated (red) and down-regulated (green) transcripts following EPZ and MI-2 treatment harboring Dot1L + menin binding sites and the statistically significant (p ≤ 0.05) pathways they are involved in. Effect of Dot1L and menin pharmacological blockade on AE-sensitive (MCF7; D) tamoxifen (MCF7 TAM-R; E)- or fulvestrant/ICI (MCF7 ICI-R; F)-resistant BC cells following increasing concentrations of EPZ (up) or MI-136 (bottom) after 3, 6 and 9 days. DMSO was used as control. Data are presented as mean ± SD from six independent replicates. Combenefit software was used to generate dose–response surface curves in AE-sensitive (MCF7; G) tamoxifen (MCF7 TAM-R; H)- or fulvestrant/ICI (MCF7 ICI-R; I)-resistant BC cells, according to D-R Lowe model, combining increasing dose of EPZ and MI-136 for 9 days. Color scale bar indicate the level of synergy (blue) or antagonism (red) at each combination. Reverse transcription quantitative real-time polymerase chain reaction (RT-qPCR) analysis of ESR1 () mRNA level in AE-sensitive (MCF7; J) tamoxifen (MCF7 TAM-R; K)- or fulvestrant/ICI (MCF7 ICI-R; L)-resistant BC cells following EPZ or MI-136 as single agents and in combination after 9 days of treatment. RT-qPCR results shown are the mean ± SD of triplicate determinations from a representative experiment. Asterisks indicate statistically significant differences (*p ≤ 0.05, **p ≤ 0.01, ***p ≤ 0.005) to CTRL or to single treatment (black bars)
Fig. 3
Fig. 3
Dot1L and menin interactomes analysis in MCF-7 BC cell nuclei. A Representative western blot showing Dot1L and menin co-immunoprecipitation in MCF-7 nuclear extracts. IgG was used as negative control. B Experimental workflow for Dot1L and menin interactome identification and characterization. For each sample three independent biological replicates were performed. (C and D) Bar charts showing molecular type classification of Dot1L (left, green) and MEN1 (right, red) associated proteins. Asterisks indicate statistical significance (p* ≤ 0.05). E Venn diagram showing overlaps between Dot1L and MEN1 associated interactors. F Bar chart showing the molecular type classification of the 561 Dot1L andMEN1 common interactors. The red line indicates the number of interactors that are also fitness genes. Asterisks indicate statistical significance (p* ≤ 0.05). G Results of IPA (Ingenuity Pathway Analysis) functional analysis showing statistically significant molecular functions enriched in Dot1L and menin common interactors
Fig. 4
Fig. 4
Association between BAZ1B, Dot1L and menin and analysis of BAZ1B expression in BC tumors. A Network reprentation interaction between Dot1L, menin, BAZ1B and the proteins of B-WICH (blue) and WINAC (green) complexes found among Dot1L and menin common interactors. B Western blot showing BAZ1B, Dot1L and menin co-immunoprecipitation MCF-7 nuclear extracts. BAZ1B mRNA C and protein D expression levels in luminal-like breast cancer samples from The Cancer Genome Atlas (TCGA) and Clinical Proteomic Tumor Analysis Consortium (CPTAC) datasets analyzed with UALCAN. Kaplan–Meier curves, generated using the Kaplan–Meier Plotter, showing the probability of overall (E; 437 low and 283 high samples, respectively) and relapse-free (F: 457 low and 274 high samples, respectively) survival of ERα + BC patients according to BAZ1B mRNA expression levels
Fig. 5
Fig. 5
Impact of BAZ1B silencing on gene expression in MCF-7 BC cells. A Results of IPA (Ingenuity Pathway Analysis) functional analysis showing statistically significant pathways enriched following BAZ1B silencing in MCF-7 cells for 72 h. B Statistically significant functions highlighted by Gene Set Enrichment Analysis (GSEA) in siRNA-mediated BAZ1B kd cell transcriptome in MCF-7 cells. NES: Negative Normalized Enrichment Score. C Venn diagram showing the number of common transcripts up-regulated (red) and down-regulated (green) following EPZ treatment or siRNA-mediated BAZ1B kd (upper panel) and MI-2 treatment or siRNA-mediated BAZ1B kd (lower panel) in MCF-7 cells. D Heatmap showing common down-regulated (green) and up-regulated (red) transcripts following BAZ1B silencing, EPZ or MI-2 treatments in MCF-7 cells
Fig. 6
Fig. 6
Effect of BAZ1B silencing in MCF-7 BC cells. MCF-7 cell proliferation rate A and Caspase 3/7 activity assay B performed following BAZ1B silencing or treatment with fulvestrant (ICI; 100 nM). C ERα trans-activating activity assessed in MCF-7 cells stably expressing the ERE-Luc reporter gene following BAZ1B silencing or treatment with ICI (100 nM). All data are analyzed respect to the scramble (Silencer Select Negative Control: CTRL). Data are presented as the mean ± SD of determinations from a representative experiment performed in six independent replicates after 72 h of silencing. D RT-qPCR (upper panel) analysis of ESR1 (ERα) and TFF1 mRNA levels following BAZ1B silencing. RT-qPCR results are shown as mean ± SD of triplicate determinations from a representative experiment after 72 h of silencing. Western blot (left lower panel) and relative densitometry (right lower panel) showing BAZ1B and ERα protein level following BAZ1B silencing or treatment with ICI (100 nM). β-actin (ACTB) was used as control. Images were processed with ImageJ software (https://imagej.net) for densitometry readings. E) Cell proliferation rate (left) and western blot analysis (right) comparing MCF-7 and MCF-7-flag cells following BAZ1B silencing. For MTT assay, all data are analyzed respect to the scramble (Silencer Select Negative Control: CTRL). Data are presented as the mean ± SD of determinations from a representative experiment performed in six independent replicates after 72 h of silencing. Western blot analysis showing BAZ1B and ERα protein level following BAZ1B silencing. β-actin (ACTB) was used as control. Asterisks indicate statistically significant differences (*p ≤ 0.05, **p ≤ 0.01, ***p ≤ 0.005) to CTRL
Fig. 7
Fig. 7
Effects of BAZ1B silencing in antiestrogen-resistant BC cells. RT-qPCR analysis of BAZ1B mRNA level following BAZ1B silencing in tamoxifen (MCF7 TAM-R; A)- and fulvestrant/ICI (MCF7 ICI-R; B)-resistant BC cells. RT-qPCR results represent mean ± SD of triplicate determinations from a representative experiment after 72 h of silencing. Asterisks indicate statistically significant differences (***p ≤ 0.005) to CTRL. C Heatmap showing the Normalized Enrichment Score (NES) of selected functions involving gene expression changes in AE-sensitive (MCF7), tamoxifen (MCF7 TAM-R)- or fulvestrant/ICI (MCF7 ICI-R)-resistant BC cells following BAZ1B silencing. Key functions are highlighted in red. Cell proliferation rate assessed by MTT assay in tamoxifen (MCF7 TAM-R; D)- and fulvestrant/ICI (MCF7 ICI-R; G)-resistant BC cell lines following BAZ1B silencing and treatment with ICI (100 nM) or tamoxifen (TAM; 100 nM). Caspase 3/7 activity assay performed in the same experimental condition mentioned above in tamoxifen (MCF7 TAM-R; E)- and fulvestrant/ICI (MCF7 ICI-R; H)-resistant BC cells. All data are analyzed respect to the scramble (Silencer Select Negative Control: CTRL). Data are presented as the mean ± SD of multiple determinations from a representative experiment performed six independent replicates after 72 h of silencing. Asterisks indicate statistically significant differences (*p ≤ 0.05, **p ≤ 0.01, ***p ≤ 0.005) to CTRL. Western blot and relative densitometry showing ERα protein level in tamoxifen (MCF7 TAM-R; F)- and fulvestrant/ICI (MCF7 ICI-R; I)-resistant BC cells following BAZ1B silencing. β-actin (ACTB) was used as loading control. Images were processed with ImageJ software (https://imagej.net) for densitometry readings
Fig. 8
Fig. 8
Effects of BAZ1B silencing in combination with Dot1L or menin blockade in antiestrogen-sensitive and antiestrogen-resistant BC cells. A Proliferation rate assessed by MTT assay in AE-sensitive (MCF7) tamoxifen (MCF7 TAM-R)- and fulvestrant/ICI (MCF7 ICI-R)-resistant BC cells following BAZ1B, Dot1L or menin silencing or combining BAZ1B silencing with EPZ B or MI-136 C treatment. Data are presented as the mean ± SD of multiple determinations from a representative experiment performed in multiple replicates. RT-qPCR showing ESR1 (ERα) mRNA level by combining BAZ1B silencing with EPZ D and MI-136 E pharmacological inhibition in the same experimental condition indicated above. RT-qPCR results represent mean ± SD of triplicate determinations from a representative experiment. Asterisks indicate statistically significant differences (*p ≤ 0.05, **p ≤ 0.01, ***p ≤ 0.005) to CTRL or to single treatment (black bars)

References

    1. Bradner JE, Hnisz D, Young RA. Transcriptional addiction in cancer. Cell. 2017;168(4):629–643. doi: 10.1016/j.cell.2016.12.013. - DOI - PMC - PubMed
    1. Dawson MA. The cancer epigenome: concepts, challenges, and therapeutic opportunities. Science. 2017;355(6330):1147–1152. doi: 10.1126/science.aam7304. - DOI - PubMed
    1. Yager JD, Davidson NE. Estrogen carcinogenesis in breast cancer. N Engl J Med. 2006;354(3):270–282. doi: 10.1056/NEJMra050776. - DOI - PubMed
    1. Musgrove EA, Sutherland RL. Biological determinants of endocrine resistance in breast cancer. Nat Rev Cancer. 2009;9(9):631–643. doi: 10.1038/nrc2713. - DOI - PubMed
    1. Garcia-Martinez L, Zhang Y, Nakata Y, Chan HL, Morey L. Epigenetic mechanisms in breast cancer therapy and resistance. Nat Commun. 2021;12(1):1786. doi: 10.1038/s41467-021-22024-3. - DOI - PMC - PubMed

Publication types

MeSH terms